Chapter III
Identify Dynamical Systems Properties in Team Sports of Rugby Union
Abstract
Previous research attempting to identify dynamical systems properties in
patterns of play in team sports has solely used 2-D analysis methods, implying that the
plane of motion must be pre-selected, and ignoring movements out of the chosen plane.
The present study examined the utility of 3-D methods of analysis for establishing the
presence of dynamical systems properties, such as phase transitions and
symmetry-breaking processes in the team sport of rugby. Artificial Neural Networks (ANNs) were
employed to reconstruct the three-dimensional performance space in a typical 1 v 1
sub-phase of rugby. Results confirmed that the ANN is a reliable tool for reconstructing a
3-D performance space and that it may be instrumental in identifying pattern formation in
team sports generally.
Key words: Symmetry breaking, dynamical systems, team patterns, Artificial Neural
Introduction
Identifying the reasons why some individuals and teams achieve success is one
of the most common aims identified in the research literature on sport performance. The
methodologies used to study sport performance have been established to compare the
actions of successful and unsuccessful teams and athletes, and the outcomes include a
range of statistical data of discrete actions that teams and players perform during
competition (see Hughes and Franks, 2004). Despite the importance of these data, an
important criticism of the notational analysis of sport performance is that it does not
identify the reasons for those discrete actions in order to explain the difference between
successful and unsuccessful teams. The data typically inform us “what” happens, and
not “how” and “why” it happens.
To understand the dynamical processes in sport performance, McGarry and Perl
(2004) used a specific type of neural network: the Kohonen feature map (KFM). They
argued that the neural networks approach must first be used to recognise situations and
analyse processes, and only then identify decision-making processes. However, with
that approach, the information structure implemented to represent a pattern was
two-dimensional (e.g. a pair of coordinates), which decreases the ability of a neural network
to analyze the complex processes that emerge in sports contests.
Additional problems concerned with the network learning processes include
their dependency on inputs patterns, and the fact that those patterns change continuously
because of a player’s tactical behaviors. A theoretical rationale from ecological
psychology allows us to understand that tactical behaviors are dependent of the
information available in specific contexts, and that information is created by each
player’s tactical behaviour. Clearly, the use of KFMs to study performance might incur
problems in reliably recognising patterns in sport contests. Another method proposed by
McGarry and Perl (2004) is the dynamical controlled network (DyCoN) already tested
successfully in different areas of sport (Perl, 2002a). This method deals with the
problem of dependency on input patterns. The DyCoN has the ability to learn in a
continuous fashion or in separate phases and so input patterns need not be presented to
the network as one data set. The authors argued that the information acquired during the
learning of the DyCoN could be used in “complementing our understanding of the
processes that take place in the learning of cognitive and/or motor skills in humans”
contests be interpreted as dynamical systems and with an applied methodological mode
of functioning based on discrete cognitive approaches?
This question highlights the necessity of constructing a methodology that will
allow researchers to analyze the complexity of dynamical processes in sport
performance seeking to establish parameters in the three planes of motion. The artificial
neural network proposed in this paper represents an attempt to initiate this
methodological approach.
Previous Research on Team Sports Sub-Phases
Viewed as dynamical systems, team ball sports are highly complex phenomena
due to the number of degrees of freedom involved that characterize the relationship
between system components (e.g. an attacker and a defender are two components of a
dyadic system) that evolve in time. Therefore, interpersonal coordination within teams
emerges from the coupling of the components of the system (i.e. the players). The first
step in understanding team ball games as dynamical systems is to find simple measures
that capture the complexity of the system. To achieve this aim, the parameters that best
describe interpersonal coordination over time need to be discovered.
Some initial attempts have been made to develop tools that collect such data
from real game situations, allowing an analysis that goes beyond the use of central
tendency parameters, which only provide intermittent data. For example, utilizing the
framework of dynamical systems theory, Araújo et al. (2002) conceptualized the
attacker vs defender dyad in basketball as an interpersonal coordination system
suggesting that the attacker and defender are two elements of a complex, dynamical
system linked by visual (and other) informational fields.
In their study, Araújo et al. (2002) used a methodology to measure the horizontal
plane trajectory (two-dimensional) of the center of mass of each player. Results were
reported in a qualitative analysis, substantiated by position-time (interpersonal distance
over time; distance of each player to basket over time) and position-position (defender
position as a function of attacker position) coordinates1. Data supported the view that a
1
symmetry breaking process had occurred in successful dribbling, when there was an
abrupt change in the shape of the curve describing the interpersonal distance of each
attacker-defender dyad.
Under the distinct task constraints of Rugby, many similar instances of
interpersonal coordination may be observed, e.g. attacker versus defender movement
patterns near the try line. Here, the goal of the attacker is to cross the try line and ground
the ball by hand. The defender attempts to remain between the attacker and the try line
by counterbalancing any movement of the attacker, resulting in a state of interpersonal
coordination during this sub-phase of the game. According to previous work on
basketball, (Araújo et al., 2004), the attacker’s decision-making should emerge from
his/her movements, during a process of searching for an available running line towards
the try area and avoiding a tackle. During a successful run by the attacker, the initial
state of order of the dyad (e.g. a positional balance between attacker and defender) is
annihilated and sustained by information fields a new state of order emerges in this
dynamical system during a phase transition.
As stated earlier, in exploring the emergence of symmetry-breaking processes in
team ball sports the studies of Araújo et al. (2002, 2004) used two-dimensional analysis
techniques. However, two-dimensional analysis methods require that the plane of
motion of each participant must be preselected, therefore ignoring movements out of the
chosen plane (Bartlett, 1997). Moreover, in qualitative terms, Kelso, Buchanam,
DeGuzman and Ding (1993) demonstrated that, when motion is restricted to the
horizontal plane, only the symmetric and antisymmetric modes of coordination are
stable over a range of frequencies. For frequencies above this range, however, no
comparably stable pattern is available in the horizontal plane of motion. The system
consisting of an established active set of components that have been self-organized for
particular movement patterns is now no longer able to support such behavior. To
achieve stability, previously quiescent system degrees of freedom (i.e. in the vertical
dimension) are spontaneously recruited. With the availability of these added degrees of
freedom the system can attain stability once more. It is noteworthy that the new
movement pattern may still be topologically equivalent to the previous one, but
additional degrees of freedom are required to perform the task. Consequently, although
Araújo and colleagues (2002, 2004) could only observe phase transitions in
interpersonal coordination dynamics in the horizontal plane, symmetry breaking
In methodological terms, according to Bartlett (1997), the major advantages of
three-dimensional motion analysis, when compared to two-dimensional analysis,
include: i) it can show the complete spatial motion of participants; ii) it allows other
angles of vision, for example, the trajectories of attackers and defenders can be
visualized from above; and iii), it enables the reconstruction of simulated views of
performance other than those seen by the cameras. Therefore, players’ displacement
during sub-phases of games can be observed from any chosen angle and analysis of
symmetry breaking processes cannot be limited by use of only a horizontal plane
analysis.
Building and Developing a 3D Model
To analyse the trajectory of both players in a dyad we used a three-dimensional
image measurement technique called videogrammetry (Gruenn, 1997). The aim of this
technique is to reconstruct three-dimensional space, by transforming the pairs of
coordinates of each camera into three coordinate planes (x, y, z). The reconstruction of
three-dimensional space is termed the ‘resolution stereo problem’, and the technique
that offers most advantages is the Artificial Neural Network (ANN) approach (Memon
& Khan, 2001).
The advantages of adopting ANN to solve the resolution stereo technique
include: i) one can dispense with the knowledge of intrinsic camera parameters
demanded by linear models such as focal distance, image centre, image scale, and
distort coefficient lens, as well as extrinsic camera parameters such as camera position
related to origin and camera orientation; ii) with the ANN it is possible to work with
any kind of camera; iii) there is no need for cameras to be in a fixed location related to
the origin; iv) the axes amongst the cameras do not need to be aligned in a fixed
position; and v), contrary to linear models, the ANN deals automatically with the
distortion lens problem (Gruenn, 1997).
An ANN is an information processing system with parallel distribution and a
tendency to store experimental data to make it available for future use (Haykin, 1994;
Stergiou & Siganos, 1996; Smith, 2001). The ANN’s functions are based on two main
characteristics: i) knowledge is acquired through a learning process; and ii), the
information (Haykin, 1994). In our study, we used an ANN from the feed forward class
because it has a topology that allows information to flow from input to output.
Finally, using ANN enhances the coherence between the theoretical and
methodological approaches we are following. As an example, the ANN can deal with
the variability of camera parameters, which linear methods are unable to do. From a
theoretical perspective, dynamical systems theory assumes that both linear and
non-linear processes exist in biological movement systems (e.g., Kelso, 1995), and from a
methodological point of view, using linear methods biases the analysis towards
linearity, thus creating a fundamental contradiction.
In order to demonstrate how ANNs might be a useful methodological advance to
study pattern formation and interpersonal dynamics in team sports, viewed as complex
systems, we applied the method to analyze phase transitions in Rugby. Rugby is a
performance context characterized by intense physical contact, according to the laws of
the game, which allows defenders to tackle attackers, put them on the floor and recover
ball possession for their team. Moreover, it is not possible to pass the ball forward with
the hands, and the ball’s shape makes it difficult to control it with the feet. These task
constraints characterize Rugby as a sport with a different functional organization than
the sport of Basketball, investigated in previous work.
The coaching literature in Rugby provides detailed descriptions of optimal ways
to tackle an opponent (e.g., Biscombe and Drewett, 1998). Those descriptions explain
what defenders must do when contact occurs with attackers. However, the pedagogical
literature typically fails to address how defenders can drive attackers to a contact point.
Perhaps the exception is Greenwood (2003) who stated that for a successful tackle,
defenders must “start fast but arrive in balance” (p.166). We can speculate from his
words that if defenders “arrive in balance” the dyad formed between an attacker and a
defender would maintain its initial state of order, and that if defenders cannot “arrive in
balance”, a symmetry breaking process is more likely to occur. However, to “arrive in
balance” is a rather nebulous term for understanding the emergence of stabilities and
instabilities in the interpersonal dynamics of team ball games. A particularly interesting
question concerns the parameters in the organization of attacker-defender dyads that
afford maintaining or changing their functional organization.
Thus, the third chapter of the present study had three aims: i) to identify phase
transitions in a team ball sport with different task constraints to basketball. To achieve
interpersonal dynamics of attacker-defender dyads in Rugby; and iii), to identify
parameters to measure dynamical systems properties in these dyads.
Methodology
Participants
Eight male rugby players aged between 11 and 12 years old participated in the
study (years of Rugby practice, mean=4.0; SD=0.5). It was decided to investigate such
young players in order to prevent the confounding effects of expertise and differents
amount of learning, since we believed that these variables would have biased the data
(cf. Zanone & Kelso, 1994). We followed the procedures outlined by Bates, Dufek and
Davis (1992) for ensuring a correspondence between the number of trials (task
repetitions) and the number of participants: for a sample size of 10, 5 and 3 trials, the
sample size of participants should be respectively 5, 10 and 20 individuals. Due to the
nature of our task, participant interactions were analyzed as interpersonal coordination
in attacker-defender dyads. Therefore, we randomly allocated a number to each rugby
player of our sample. Each player acted both as attacker and defender, and they
participated with each other player in dyads. In order to prevent possible fatigue effects
on performance, it was decided that each dyad would perform two trials. With all
possible number combinations, we observed the responses of 32 different dyads.
The Task
We designed a task that was representative of a sub-phase of Rugby with the
minimum number of players involved i.e. the common 1 v 1 situation near the try line.
In this sub-phase, a pair of rugby players with opposing functions and goals forms a
dyad: i) the attacker aim to place the ball with the hand in the try area; ii) the defender
aims to stop the attacker’s progression towards the try-line and put him on the floor
within the rules of Rugby. We established depth and width of the field following the
procedures of Biscombe and Drewett (1998) who recommendedthe field dimensions
for 1 v 1 sub-phase practice tasks. This advice helped us to construct the task constraints
Figure 1. Task design.
According to their coaches, all the selected participants knew how to tackle (i.e.,
the action of intercepting an attacker and stopping his progression towards the try line).
Defenders attempted to contact attackers with the shoulders and the arms, and held the
legs or trunk to put him on the floor (Biscombe and Drewett, 1998).
Instruments
Player motion was captured by two digital video cameras. For image treatment,
we used the software TACTO 7.0, digitized at 25 frames per second (Fernandes &
Caixinha, 2003). The ball used was size 5 as defined by the Portuguese Federation of
Rugby for this age group. Twelve rods, 1.8 m in length, were used to build a cube
shaped reference structure, which was moved in order to cover the entire data collection
volume. This reference structure gave us the points used for training and validation
procedures for the Artificial Neural Network.
Procedures for Recording the Dyad’s Action
Camera positions
Bartlett (1997) suggested that the angle between cameras for motion capture
should vary between the 60º and 120º. We followed this procedure, even though the Try line
5 meters
Defender
Attacker
ANN procedures did not require it, as explained earlier. To synchronize the images
recorded by both cameras over trials, we used the specific frame when the attacker
touched the ball with the foot before initiating his attempt to cross the try-line. The
video images were acquired by the computer, via USB, by using the Pinnacle Studio
version 8.0 SE software and saved as AVI files.
Image Processing
To extract data on player displacement coordinates we used TACTO 7.0
(Fernandes & Caixinha, 2003). The procedures consisted of following with the mouse
the working point located in the middle of the abdominal area of each player, after
which the coordinates were automatically extracted.
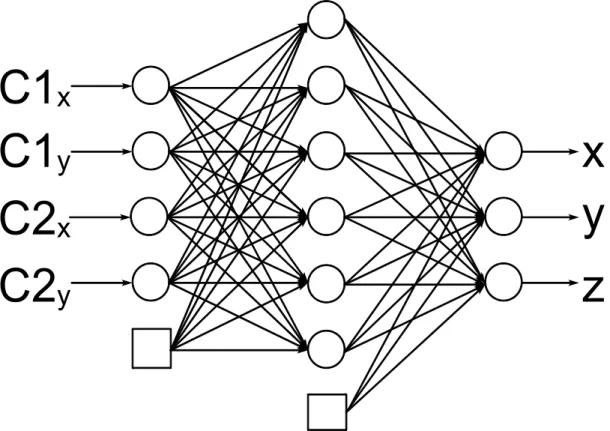
As noted earlier, the ANN architecture used in the present research program
belonged to the feed forward class. It consisted of four input neurons, corresponding to
four coordinates of stereo images for each player (e.g. two from the frontal camera (x1,
y1) and two from the transversal camera (x2, y2), six neurons in a hidden layer, and
three output neurons, corresponding to real coordinates, x, y and z (Memon & Khan,
2001) (see Figure 2).
x
z
y
C1
x
C2
x
C1
y
C2
y
Artificial Neural Network Training and Validation
To ensure accurate information running on the ANN, a previous stage of training
is required. The ANN training procedure allowed us to convert the known stimulus (e.g.
point coordinates from two images) to an adequate response (e.g. spatial coordinates of
that point).
The procedure consisted of using a backpropagation algorithm to minimize the
difference between the actual output and the desired output (Haykin, 1994). The
backpropagation process had two phases: i) propagation of the functional signal,
signifying that information flowed in a positive way, from input to output, layer by
layer. During this phase, the synaptic weights were maintained; and ii), estimation of
the error (e.g. difference between the actual output and the desired output). That error
was then backpropagated to the network in the opposite way, from the output to the
input and the synaptic weights were adjusted to minimise error to acceptable values.
We used a backpropagation algorithm in the learning network, an iterative
process, indicating that there is an iterative change in the parameters of the transfer
function of each neuron in the network. This change was made after feeding the
network with the bidimensional coordinates of both cameras and comparing the output
with the actual coordinates for that point. Using this procedure, it was necessary to
know the actual coordinates of a set of points from the space where a particular task was
performed.
Those points were extracted from the cube shaped reference structure described
earlier, which we moved in order to cover the entire surface/volume of the performance
field. This structure is similar to the one suggested by D’Appuzo (2002) who used it for
measuring moving surfaces and tracking body parts (e.g. left wrist), before transforming
the data to a three-dimensional shape to capture motion information. The reference
structure was composed of 330 points of which 108 were used in the training procedure,
with the remainder used to validate the network.
This last procedure consisted of feeding the network with a set of pairs of
bidimensional coordinates (from the reference structure but not used on the training
stage) and comparing the ANN outputs to the actual spatial coordinates observed). The
Network Reliability
Accuracy
To evaluate network performance, accuracy is a basic concept that needs to be
measured, referred to by Gruen (1997) as the “quality of the model”, in which the
estimated coordinates of a given point in the model corresponds to the actual
coordinates of that same point. According to Memon and Khan (2001), model accuracy
should be assessed by comparing the predicted coordinates of a set of points not used in
the training procedure, to actual coordinates observed. The difference between the
predicted and actual coordinates can be used to calculate the mean error value for the
network, providing a measure of accuracy. The lower the mean error value, the more
accurate is the network. The average Root Mean Square error, which reflects the mean
difference between actual and predicted 3D coordinates (reflecting system inaccuracy)
calculated over 110 points (not used in the training procedure), had a value of 1.3 cm,
which is acceptable for the stated purpose. This value is small enough to avoid a
measurement bias in coordinate estimation.
Precision
Precision can be defined as the closeness of the predicted coordinates when the
same actual point is digitised (in both video streams) several times. Ideally, the
predicted coordinates must be equal every time a particular point is digitised. However
some aspects contribute to small differences among them including: i) the 2D to 3D
coordinates transfer function; ii) the quality of the software used in the digitising
process; iii) experimenter skill in manipulating the pointing device (e.g. the computer
mouse); iv) the resolution of the video streams; and v), the positioning of the video
cameras.
Precision is commonly operationalized as the standard deviation of a set of
predicted 3D coordinates for each particular digitised point. As constant precision
could not be a priori guaranteed over the entire playing field we used 8 points (digitised 6 times in random order) located at the extremes of the field in order to quantify a
obtained pooled standard deviation was 0.03 m, which is an acceptable figure since it
corresponds to 0.3% of the playing field length.
Measurement of Dependent Variables
The following dependent variables were calculated in the study:
i) Distance of the attacker and defender to the try line. This variable measures the absolute distance of each player relative to the try line plotted over time. This variable
was measured by calculating the distance between the closest point of the try line and
each player, in a straight line. It was calibrated in centimeters and displayed in
two-dimensional position-time graphics. This variable is also calibrated in meters and
displayed in three-dimensional graphics;
ii) Distance of the attacker and defender to both lateral lines. This variable measures the absolute distance of each player relative to both lateral lines. It was calibrated in
meters and displayed in three-dimensional graphics;
iii) Vertical oscillation. This variable measures the height (in centimetres) of the working point (located in middle of the abdominal area of each participant in the dyad)
to the floor over time. It was displayed in three-dimensional graphics;
iv) Stability of vertical oscillation. This variable provides a measure of the means and standard deviations of height of the working point over time.
Results
In this section, we begin by presenting the results of the phase transition analysis
with two-dimensional (2D) position-time graphics, to ascertain whether the same
patterns identified in basketball (see Araújo et al, 2002) existed in the performance
context of rugby. We follow that analysis by presenting three-dimensional (3D)
graphics in order to identify phase transitions that could be hidden within 2D
position-time graphics. The 3D graphical analysis also helped us to identify parameters (such as
vertical oscillation) that could be the source of differences between a defender’s
supremacy (a successful tackle) and an attacker’s supremacy (a try scored). Finally, we
present a stability analysis to understand how the vertical oscillation parameter behaved
Phase Transitions Analysis
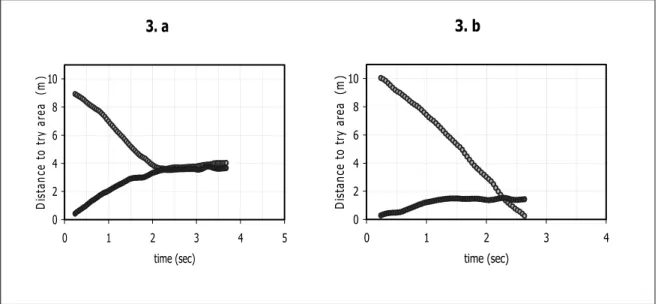
In Figure3.a and 3.b, two main features of the data may be observed. For
successful tackles (Figure 3.a), there is no crossover of player displacement trajectory
lines. Despite the variability of attacker behavior, both lines of displacement maintained
the same pattern over time, with the defender always remaining closer to the try line, as
the initial state of order of the dyad was maintained.
For try situations (Figure 3.b), it can be observed that initially, both
displacement trajectories displayed a pattern similar to successful tackles by the
defender. However, over time, the attacker’s trajectory became more adjacent to the
defender’s and suddenly a crossover occurred. The attacker became the player closest to
the try line and the initial state of order of dyad was annihilated, with a new state of
order emerging.
Figure 3. Distance to try area (y values in meters). Attacker (grey line) and defender
(black line). Successful tackle (3. a) and try (3 .b).
3D Analysis
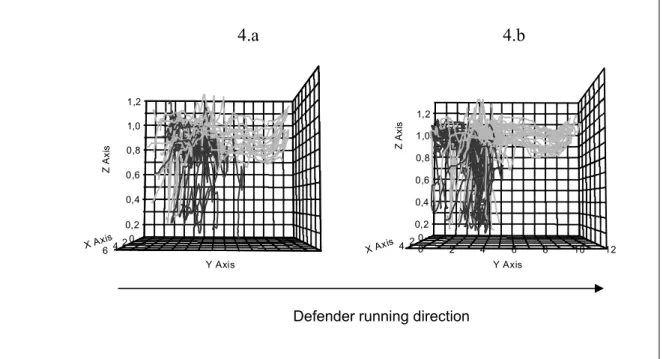
With the lateral graphics (Figure 4.a and b), two kinds of analysis were
conducted. We searched for parameters that could describe motion differences between
3. b 0 2 4 6 8 10
0 1 2 3 4
time (sec) D is tan ce t o t ry ar ea ( m ) 3. a 0 2 4 6 8 10
0 1 2 3 4 5
try situations and successful tackles by the defender preventing a try. Our analysis
showed that the variables “distance to try area” (y values) and “vertical oscillation” (z
values) are the sources of two main differences between those situations. When a try
was scored, defenders were usually more advanced in the field compared to when a
successful tackle was made (for successful tackles, defenders acquired a position in the
field between 2 and 4 m from the try line; for try situations the defenders acquired a
position between 2 and 6 m from the try line).
In addition, vertical oscillations (z values) of defenders, describing the up and
down movements of players on each trial, were of greater magnitude when a try was
scored, compared to a successful tackle. Differences in the range of vertical movements
can be observed in Figure 4 (a and b). For try situations, defenders produced the largest
range of up and down movements as shown by the lowest z value (0.7 m) when
compared to successful tackle (z values of 0.9 m). The upper limit is the same for both
situations. The results indicated that defenders decreased the distance to the floor in
order to counterbalance attacker actions, and that there was a critical boundary distance
to the floor below which defenders were not able to perform a successful tackle.
As displayed in Figure 4.a, when defenders advanced into the field a distance of
approximately 4 m, vertical oscillations assumed values between 0.7 and 1.1 meters.
For successful tackles, defenders advanced in depth approximately 2 m, and vertical
oscillations assumed values between 0.9 and 1.1 meters. Additional analyses were
oriented to identify displacement curve shapes. For successful tackles, defender curves
presented a better-defined pattern, the advancement into the field and the abrupt
decreasing of z values, suggesting an inverted “J” shape. In contrast, when tries were
0 2 4 6
0,2 0,4 0,6 0,8 1,0 1,2
0 2 4
0,2 0,4 0,6 0,8 1,0 1,2
0 2 4 6 8 10 12
Z
A
x
is
Y Axis
X Axis
Z
A
x
is
Y Axis
X Axis
Figure 4. Distance to try area. Attacker (grey line) and defender (black line). Try (4. a;
N=21) and successful tackle (4. b; N=26). Distance of the attacker and defender to try
line (y values in meters). Vertical oscillation (z values in meters).
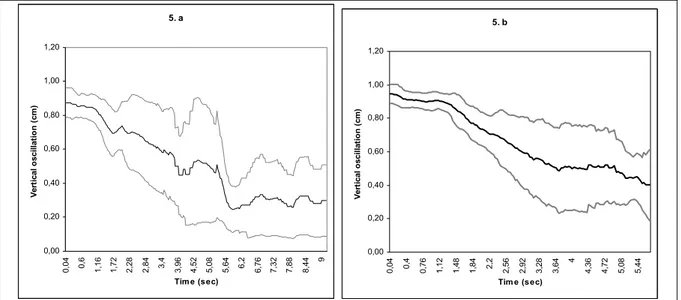
Vertical Oscillation Analysis
Vertical oscillations were identified by 3D graphics. Figure 5 (a and b) shows
means and standard deviations of the “z values”. The smaller standard deviation values
indicates that vertical oscillations were more stable when successful tackles were made
implying that defenders’ actions were more stable under those circumstances.
Moreover, when a try was scored one can observe an initial stability of z values (until
1.6 s after initiation of the move), similar to that found in successful tackles (1.96 s).
Over time, Figure 5 shows enhanced variability of z values when a try was scored
(starting approximately at 2.12 s) and a more abrupt change in the curve shape (between
4.72 and 6.28 s) suggesting a phase transition. During successful tackles, there was also
an increased variability (starting approximately at 1.96 s), with a final decrease (at 4.84
s), resulting in the dyadic system maintaining its initial state of order. Defender running direction
Figure 5. Mean (black line) and Standard Deviation (grey line) of defenders’ vertical
oscillation. 5.a for try; 5.b for successful tackles.
Discussion
Overall analysis of the data revealed that this research method allowed us to
collect data directly during reconstruction of a three-dimensional performance field,
resulting in analysis of continuous time series data that represented interpersonal
dynamics in a common sub-phase of rugby. In this discussion, we will follow an order
of presentation in line with our aims presented earlier, followed by an evaluation of the
strengths and weaknesses of the ANN, and concluding with identification of trends for
future research.
To summarize, the first aim of our study was to identify phase transitions in a
team ball sport with different task constraints to basketball. To achieve this aim we used
sub-phases of the team game of Rugby. The data showed that, using position-time
graphics it was possible to identify phase transitions similar to those found by Araújo et
al. (2002) in the sport of basketball. Our second aim was to present a 3D analysis of
interpersonal dynamics of attacker-defender dyads in rugby. Our findings showed that
the use of ANN proved to be a reliable method to build a 3D model of our performance
field, which allowed us to analyse the trajectory of players from every angle selected.
Finally, despite a qualitative analysis of dynamical systems properties, there was a need
to identify parameters to measure those properties, and the data appeared to reveal two
parameters that might be key variables in a successful defence.
5. a 0,00 0,20 0,40 0,60 0,80 1,00 1,20 0, 0 4
0,6 1,16
1, 7 2 2, 2 8 2, 8 4
3,4 3,96
4, 5 2 5, 0 8 5, 6 4
6,2 6,76
7, 3 2 7, 8 8 8, 4 4 9
Tim e (sec)
V e rt ic al o scil lat io n ( c m ) 5. b 0,00 0,20 0,40 0,60 0,80 1,00 1,20 0,
04 0,4
0, 76 1, 12 1, 48 1,
84 2,2
2, 56 2, 92 3, 28 3, 64 4 4, 36 4, 72 5, 08 5, 44
Tim e (sec)
Phase Transitions Analysis
Results revealed that behavior of both players in a dyad emerged through
exploration of the environment. Data indicated that decision-making in team ball sports,
exemplified in 1 v 1 situations, can be characterized by a self-organized process
depending on the specific ongoing interactions between an attacker and defender in the
dyad. Indeed, the results can be interpreted as displaying two key properties of a
self-organized dynamical system: i) maintenance of the initial state of order, with advantage
for the defender (Figure 3.a); and ii), a phase transition, when the attacker gets past the
defender (Figure 3.b).
From an applied perspective, the results suggested that an ideal model of
performance, for both defender or attacker movement, did not exist. Therefore, it is not
desirable to determine in advance the specific technical manoeuvres that players should
attempt to perform, during practice. Rather, the data suggested that coaches should
manipulate task constraints (e.g. increasing or decreasing the field dimensions) to
increase or decrease the task difficulty, so that the players’ performance is constrained
by the specific demands of a particular performance situation in order to maintain goal
direct behavior.
3D Analysis
Data confirmed that the ANN is a reliable tool for reconstructing a 3-D
performance space, allowing a more complete analysis of sport performance.
Although previous research showed that dynamical systems properties of sport
performance might be observed with a 2D analysis, the current study showed that the
key variables used to measure those properties could be more comprehensively
identified with a 3D analysis. More specifically, the symmetry breaking process
observed with position-time graphics (2D) could be accurately measured by analysis of
vertical oscillations of a player’s position, a variable that can only be observed using
3-D analysis.
Differences found in the range of vertical movements revealed that a greater
magnitude of vertical oscillations, (z values) indicated more irregular up and down
more unpredictable, signifying that the defender was searching for a better position in
order to attack his opponent. In addition, an increase in vertical oscillation variability
revealed greater movement uncertainty due to exploratory activity to find a balanced
position to tackle the attacker. Finally, a decrease in stability of vertical oscillations
signified that the defender was more sensitive to the perturbations induced by the
attacker’s actions.
The data appeared to suggest that a balance between the forward motion and the
vertical oscillation of the player may be key variables for the defender to consider when
tackling in rugby. In addition, the inverted “J” shape in the displacement curves
suggested that most of the defenders adopted a similar pattern of behavior that led them
to success.
To summarize, it can be concluded that successful defending in this sub-phase of
rugby depends on the balance between advancing in the field and stabilizing the vertical
oscillation. It is suggested that those two parameters might characterize what
Greenwood terms as ‘arriving in balance’ (Greenwood, 2003).
Strengths and Weaknesses of Artificial Neural Networks
Weaknesses
The first weakness is that ANNs are field specific, signifying that data cannot be
imported from other performance fields because ANNs can only run data that are
collected inside of the specific reference structure used in training and validation
procedures. Second, once we placed the cameras in specific locations, we could not
move the cameras to right or left to follow the action of a player or a group of players
that might have interested us. Additionally, we could not use the zoom lens to observe
in more detail specific movements of players. This technicality implies that the area
designated to capture the motion of objects must be defined from the beginning. Every
time cameras are moved, the calibration procedures must be repeated. Third, ANN
training is a time-consuming and relative slow process due to the iterative nature of the
backpropagation based learning. The learning variables (e.g. learning rate and
momentum coefficient) need to be adjusted according to the complexity of the problem.
Too high a learning rate usually leads to poor prediction capabilities due to oscillation
difference between the ANN output and the actual values) they never converge
(Basheer, 2000). The opposite is also undesirable due to the long time required to
converge. The high and/or low definitions can only be determined during the network
training process by observing the evolution of error minimisation. In that case, if not
suitable to solve a particular problem, the process might be stopped and restarted after
adjustment of the learning variables. Although several approaches to automatically vary
the learning rate have been proposed, there are no general rules to establish initial
values for both the learning rate and the momentum coefficient. Although the number of
input and output neurons are defined by the problem to solve the network architecture
(the number of neurons in the hidden layer(s) and is commonly established by a trial
and error approach since no rules for a priori establishment exists. This aspect is not exclusive for this kind of application (spatial coordinates calculation). Finally, there are
other 3D reconstruction approaches such as the linear approaches (e.g. Direct Linear
Transformation) that require fewer reference points than ANNs. However, as stated
before, to use these techniques we need to know the intrinsic parameters of the cameras,
which significantly constrains the method of obtaining the data. Moreover, using linear
models to analyse non-linear phenomena can reduce the coherence between the
theoretical and methodological approaches.
Strengths
First, despite these limitations, using ANNs as a method for analysing sport
performance brings practical advantages. Once the net for a specific performance field
has been constructed, the only major concern is to locate the cameras exactly at the
same place and at the same height, to facilitate different types of movement analysis.
Second, as stated earlier, there is no need to know any of the intrinsic and/or extrinsic
camera parameters such as focal distance and camera position related to the origin.
Additionally results produced by ANNs are accurate even in the presence of optical
and/or digital distortion, when a sufficient number of reference points are used. Finally,
as discussed earlier, to build the net, a set of points from a reference structure are
needed for the training and validation procedures. Knowledge of certain kinds of
measures that represent the depth, width and height of the performance field (e.g. length
of field lines, distance between lines, and height of posts) can provide a set of points
experimenters to collect images that are reliable to analyse sport performance for any
kind of field. Nowadays naturalistic methods to study decision-making are gaining
popularity (Klein, 2001), although there is little agreement on an adequate method for
measuring behavior. In this paper, we propose that ANNs might be suitable methods for
improving the analysis of decision making in sports tasks.
Future Research
From a qualitative point of view, it was possible to identify the existence of
phase transitions in the sport of Rugby, however future research needs to confirm these
findings by identifying quantitative measures of this property. Further work is needed to
simplify the use of Artificial Neural Networks to reconstruct a three-dimensional
performance fields in order to become more “user-friendly”. Finally, in this paper we
suggested parameters that were related to a single player analysis, not to the properties
of an attacker-defender dyad as a dynamical system. The need to identify a parameter
(i.e. a collective variable) that could explain the behavior of an attacker and defender
References
Araújo, D., Davids, K., Sainhas, J. & Fernandes, O. (2002). Emergent
decision-making in sport: a constraints-led approach. In L. Toussaint, & P. Boulinguez (Ed.),
International Congress "Movement, Attention & Perception" (pp. 77). Poitiers, France:
Université de Poitiers.
Araújo, D., Davids, K., Rocha, L., Serpa, S. & Fernandes, O. (2003). Decision
making in sport as phase transitions. International Journal of Computer Science in Sport, 2(2), 87-88.
Araújo, D., Davids, K., Bennett, S., Button, C., & Chapman, G. (2004).
Emergence of Sport Skills under Constraints. In A. M. Williams, N.J. Hodges (Ed.),
Skill Acquisition in Sport: Research, Theory and Practice (pp. 409-433). London:
Routledge, Taylor & Francis.
Basheer, M. H., (2000). Artificial neural networks: fundamentals, computing,
design, and application. Journal of Microbiological Methods. 43, (3-31).
Bartlett, R. (1997). Introduction to Sport Biomechanics. London: E&FN SPON.
Bates, B.T., Dufek, J.S. & Davis, H.P. (1992). The effect of trial size on
statistical power. Medicine and Science in Sports and Exercise, 24, 1059-1068. Biscombe, T. & Drewett, P. (1998). Rugby. Steps to Success. Champaign, IL:
Human Kinetics.
Bocanegra, C. (2002), Procedimentos para tornar mais efectivo o uso das redes
neurais artificiais em planejamento de transportes. [Procedures to increase the
effectiveness of artificial neural networks on public transports planning]. Tese de
Mestrado. (Master Thesis). Universidade de São Paulo, Escola de Engenharia de São
Carlos, Departamento de Transportes.
Brunswik, E. (1956). Perception and the representative design of psychological
experiments (2nd ed.). Berkeley: University of California Press.
D’Appuzo, N. (2002), Surface measurement and tracking of human body parts
from multi-image video sequences. ISPRS Journal of Photogrammetry & Remote Sensing, 56, 360-375.
Fernandes, O. (2001). Biomecânica: desenvolvimento de um instrumento de
of a tool for 3D kinematic analysis and aplications in gymnastics]. Master thesis not
published. Technical University of Lisbon. Lisbon.
Fernandes, O., & Caixinha, P. (2003). A new method in time-motion analysis in
soccer training and competition. Paper presented at the 5th world congress of Science &
Football (pp. 270-271), Lisbon.
Gibson, J.J. (1979). An Ecological Approach to Visual Perception. Boston, MA:
Houghton-Mifflin.
Greenwood, J. (2003). Total Rugby. Fifteen-man rugby for coach and player.
London. A&C Black.
Gruen, A. (1997). Fundamentals of videogrammetry – A review. Human Movement Science, 16, 155-187.
Haykin, S (1994). Neural Networks: a comprehensive foundation. New York.
MacMillan.
Kelso, J.A. S. (1995). Dynamic Patterns, The self-organization of brain and
behaviour. Massachusetts: MIT Press.
Kelso, J.A.S., Buchanan, J.J., DeGuzman, G.C. & Ding, M. (1993). Spontaneous
recruitment and annihilation of degrees of freedom in biological coordination. Physics Letters A, 179, 364-371.
Klein, G. (2001). The fiction of optimization. In G. Gigerenzer, & R. Stelten
(Ed.), Bounded Rationality. The adaptive toolbox (pp. 103-121). Massachusetts: MIT. Kugler, P. & Shaw, R. (1990). Symmetry and Symmetry-Breaking in
Thermodynamic and Epistemic Engines: A Coupling of First and Second Laws. In H.
Haken & M. Stadler (Ed.) Synergetics and Cognition, (pp. 296-331), Springer-Verlag
Berlin.
McGarry, T., & Perl, J. (2004). Models of Sports Contests-Markov processes,
dynamical systems and neural networks. In Hughes, M. & Franks, M. (Eds.). Notational
Analysis of Sport (pp. 227-242). London: Routledge, Taylor & Francis.
Memon, Q. & Khan, S. (2001). Camera calibration and three-dimensional world
reconstruction of stereo-vision using neural networks. International Journal of Systems Science, 32, (9), 1155-1159.
Perl, J. (2002a). Game analysis and control by means of continuously learning
Schmidt, R.C., Carello, C. & Turvey, M.T. (1990). Phase transitions and critical
fluctuations in the visual coordination of rhythmic movements between people. Journal of Experimental Psychology: Human Perception and Performance., 16, 227-247.
Schmidt, R.C., O'Brien, B. & Sysko, R. (1999). Self-organization of
between-persons cooperative tasks and possible applications to sport. International Journal of Sport Psychology. 30, 558-579.
Smith, L. (2001), An introduction to neural networks. Download on 31 March
2004 from World Wide Web: http://www.cs.stir.ac.uk/~1ss/NNIntro/InvSlides.html
Stergiou, C. & Siganos, D. (1996), Introduction to neural networks. Download
on 31 March 2004 from World Wide Web:
http://ww.doc.ic.ac.uk/~nd/surprise_96/journal/vol4/cs11/report.html
Turvey, M. (1990), Coordination. American Psychologist. 45, 938-953.
Wells, G., Venailles, C. & Torras, C. (1996), Promising research Vision-based
robot positioning using neural networks. Image and Vision Computing. 14, 715-732. Zanone, P. G. & Kelso. J.A.S. (1994). The coordination dynamics of learning. In
S. Swinnem, H. Hever, J. Massion & P. Cassler (Eds.), (pp. 462-490). San Diego, CA: