Scientific/Technical Article
http://dx.doi.org/10.1590/2318-0331.0217160012
A procedure to analyze the viability of rainwater harvesting systems in urban areas
based on pre-defined diagrams
Procedimento para análise da viabilidade de implantação de sistemas de aproveitamento de águas pluviais em centros urbanos por meio de diagramas de pré-dimensionamento
Felipe Eugenio de Oliveira Vaz Sampaio1,2 and Conceição de Maria Albuquerque Alves3
1Centro Universitário Instituto de Educação Superior de Brasília, Brasília, DF, Brazil
2Ministério Público Federal, Brasília, DF, Brazil
3Universidade de Brasília, Brasília, DF, Brazil
E-mails: felsvaz@yahoo.com.br (FEOVS), calves@unb.br (CMAA)
Received: September 20, 2016 - Revised: June 28, 2017 - Accepted: September 03, 2017
ABSTRACT
Giving some specific precipitation regimes and technical design parameters, urban Rainwater Harvesting Systems (RWHS) may represent an alternative source to drinking water supply system promoting its conservation and rational use. The use of RWHS requires the definition of generic and simplified method for sizing RWHS accumulation tanks, which is has being considered the most expensive component of the system. Additionally, several methods have being used to define reservoir volumes leading to a wide variety of final reservoir volumes many of them over estimated. The main objective of this article is to present a new methodology to define RWHS
reservoir volumes considering technical and economic viabilities of the systems. The proposed methodology was incorporated into a
Decision Support System (DSS), named SARA. The method provides an alternative way to define smaller RWHS reservoir volumes once it accepts lower levels of reliabilities giving that the RWHS is considered a complimentary system, better suited for urban areas. RWHS design diagrams are built as a result of the methodology in an attempt to offer a tool to initial and rapid design of reservoir volumes for RWSH. The method was applied to different urban areas in Brazil.
Keywords: Rational water use; Rainwater harvesting systems; Decision support system.
RESUMO
Em situações específicas de regime de precipitação e de parâmetros técnicos de concepção, os Sistemas de Aproveitamento de Águas
Pluviais (SAAP) urbanos podem representar fonte alternativa complementar à água potável fornecida pelas companhias de saneamento,
além de promover sua conservação. A disseminação dessa prática pode ser favorecida pela definição de método simplificado para
dimensionamento de reservatórios de acumulação de SAAP, componente mais oneroso do sistema. Diante desse cenário, o principal objetivo deste trabalho é construir uma metodologia para dimensionamento preliminar de reservatórios de acumulação de SAAP e avaliação da viabilidade econômica de implantação desses sistemas. A metodologia proposta foi inserida em um Sistema de Apoio à Decisão (SAD), denominado SARA. O método propõe ainda uma alternativa de dimensionamento de reservatórios de SAAP
que não foca na máxima confiabilidade do sistema mas sim no atendimento complementar da demanda o que resulta em volumes de reservatórios menores e economicamente mais viáveis, mais adequados para centros urbanos. Para avaliar a metodologia, foram realizadas simulações, em centros urbanos selecionados e para diversos cenários de regime de precipitação e de parâmetros técnicos,
com o intuito de gerar diagramas capazes de promover o pré-dimensionamento e analisar a viabilidade de SAAP de forma fácil e rápida.
INTRODUCTION
According to the World Health Organization (WHO, 2015),
almost 2,4 billion people do not have access to adequate sanitary
services and more than 663 million people do not have access to water in appropriate conditions. Yet, more than half of the world population lives in urban areas where the population growth rates and migration impose great stress on the already precarious sanitary systems. This scenario is even worse in regions that presents low
levels of precipitation or faces problems of water quality pollution
(in surface or underground water resources). Usually, the search for water in these regions tends to reach further and further river basins resulting in onerous water supply systems and water
allocation conflicts as recently faced between the States of São
Paulo and Rio de Janeiro, and Paraiba and Rio Grande do Norte during 2012 and 2014 (ANA, 2015).
According to Thackray; Cocker and Archibald (1978), DeOreo and Mayer (1999), Tomaz (2003), Ghisi and Ferreira (2006), Ghisi and Oliveira (2007) the urban water consumption in Brazil and in other countries varies with climate, social, economic
and cultural aspects. It is also verified that non potable demands represent between 33,8% and 63,5% of the total water supply in
a residence (Tomaz, 2003) which represent a great opportunity
to the definition of programs and alternatives of rational water
use in urban systems.
Based on that, the use of Rainwater Harvesting Systems (RWHS) in urban areas directed to non potable water uses represents
a valuable alternative to relieve the stress on urban water systems and their companies.
Many researchers have focused their work on the viability
analysis of RWHS in order to define optimal reservoir volume which is recognized as the most expensive component of the RWHS (FEWKES, 2000; CORDOVA; GHISI, 2011; MORUZZI;
CARVALHO; OLIVEIRA, 2012; MURÇA; JULIO; MORUZZI, 2014; MORUZZI et al., 2016; PELAK; PORPORATO, 2016). These studies differentiate themselves in the following aspects: viability analysis methods, reservoir volume calculation methods,
RWHS purposes (potable or non potable uses), RWHS reliability (the RWHS is the only source of water supply or there is a water
supply company in the area).
In order to estimate the reservoir volume for the RWHS,
many studies have chosen one of the methods indicated in the A
Attachment of the NBR 15.527 (ABNT, 2007) for RWHS with different purposes. These procedures may result in a variety of reservoir volumes (DORNELLES; TASSI; GOLDENFUM, 2010). The methods suggested in the NBR 15.527 were originally
defined for water supply systems, so they design the reservoir
volume based on high levels of reliability (or reduced failure risks).
This may result in the definition of reservoir sizes greater and greater in order to reach desired levels of reliability (between 95% and 99%) or acceptable failures (between 5% and 1%). If RWHS
are designed based on these methods, it is likely that they will fail an economic analysis due to the costs related to the reservoir
volumes in systems that requires high levels of reliability. However, it is important to emphasize that there is no meaning in ask for high levels of reliability in urban RWHS where
there is a water supply system available to deliver water whenever
the reservoir of the RWHS is empty or at low level. In this paper,
we consider the urban RWHS as an alternative source of water
supply, so we argue for the use of moderate levels of reliability
coupled with an economic evaluation of the urban RWHS when defining the volume of the reservoir in the system.
Despite the increasing number of publications in water conservation and the rising enthusiasm of the society in urban
RWHS there is still a lack of generalized and simplified methodology for the design of RWHS considering the technical, economic and
environmental (climate) aspects of the system (ANDRADE; MAIA; LUCIO, 2017). This gap hinders the use of urban RWHS, once there is not any well known procedure to evaluate the feasibility of these systems.
The present work is a technical and scientific effort to spread the use of RWHS in urban areas in Brazil, through the development of a tool to evaluate the viability of urban RWHS
considering technical (roof area, demand) and economical
(costs, water supply tariff) aspects and allowing the definition of moderate levels of reliability for the urban RWHS. In the
following sections, the proposed method, the decision support system (DSS) and the diagrams are presented showing the results of scenarios for some cities in Brazil. The diagrams may be used
for preliminary design and projects for specific locations.
MATERIAL AND METHODS
Water balance simulation in the RWHS
In order to evaluate the viability of urban RWHS and to
offer a preliminary design of the reservoir, this methodology
developed a water balance simulation using a predefined reservoir
capacity and diary precipitation series. The analysis involved the development of scenarios according to different roof areas and non potable demands. Additionally, the simulation informed the development of economic and performance indicators.
Among other studies related to this subject such as Moruzzi and Oliveira (2010), Cordova and Ghisi (2011), Moruzzi, Carvalho and Oliveira (2012), Murça, Julio and Moruzzi (2014), Moruzzi et al. (2016), Pelak and Porporato (2016) and Rupp, Munarim and Ghisi (2011), the present work adopted the simulation model proposed in Palla, Gnecco and Lanza (2011) and the discard of
the first 1 mm of precipitation in order to improve the quality of
the water. The work of Murça (2011) shows the efficiency of the
first flush discard in the reduction of turbidity levels, color, DBO of RWHS water. Despite the variability of literature indications
about the discard volumes (ABNT, 2007; NASCIMENTO; MORUZZI, 2009; MORUZZI; CARVALHO; OLIVEIRA, 2012), the present work adopted the discard of 1 mm of precipitation after 3 consecutive dry days.
The amount of water discarded from the RWHS into the
urban drainage system is also an important measure of performance
of the RWHS. Usually, the system should minimize the discard and avoid wasting collected water. However, the reservoir capacity is a
limit due to restrictions of costs. The water balance simulation for
RWHS may be based on two commonly exploited supply–spillage
Spillage (YBS), as described in Jenkins et al. (1978) and Fewkes (2000). However, Cordova and Ghisi (2011) showed that results from simulations based on YBS and YAS were very similar. In the present work, the authors adopted the YBS approach because it represents more closely the automatic operation of the pumping system in buildings that is triggered whenever the upper reservoir level reaches a minimum level. In such way, there might be several withdrawals during the day, which is more compatible to the YBS algorithm.
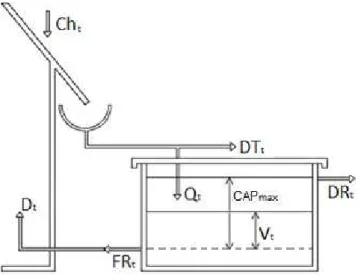
The simulation model is described along the
Equations 1, 2, 3 and 4 and the schematic concept of the RWHS
is presented in Figure 1.
t t
t 1 t D FR min
V− Q
= +
(1)
t 1 t t
t
max
V Q FR
V min CAP − + − = (2) where:
Qt: Rainwater inflow from the roof area on day t, in m3;
CAPmax: reservoir capacity, in m3;
Vt: storage volume in the reservoir, on day t, in m3;
Dt: RWHS water demand, on day t, in m3;
FRt: rainwater withdrawal on day t, in m3.
The daily RWHS rainwater inflow is related to the precipitation and some parameters as stated in Equation 3.
t t t
Q =Ch ⋅ ⋅ −C A DT (3)
where:
Cht: Precipitation on day t, in m;
C: Surface runoff coefficient, adimensional;
A: Roof area, in m2;
DTt: First flush water discart on day t, in m3. DTt is equal to zero
if there is any precipitation during the three days before day t (days t-3, t-2, t-1).
t
t 1 t t max zero DR max
V− Q FR V
= + − −
(4)
where:
DRt: water volume discarted on day t, in m3.
The technical viability of the RWHS was evaluated based on the Eeco performance coefficient defined in Dixon, Butler and
Fewkes (1999) and described in Equation 5 below. It represents the percentage of the demand along the complete simulation that was actually supplied.
T t i 1 T t i 1 FR Eeco D = = =∑ ∑ (5) where:
Eeco: Water saving efficiency coefficient;
FRt: Total rainwater volume supplied by the RWHS on day t, in m3;
DRt: Rainwater demand on day t, in m3.
Decision Support System for RWHS performance evaluation
A Decision Support System (DSS) named SARA was
implemented with the proposed method for evaluation of RWHS
performance. SARA is an object oriented computer system developed in Delphi. It suggests a preliminary reservoir capacity in
a RWHS considering a jointly technical and economic evaluation
and a water balance simulation based in daily precipitation series. Details about SARA are presented in Sampaio (2013).
Other computer systems similar to SARA are already available (GHISI; CORDOVA, 2014; MORUZZI; OLIVEIRA, 2010). However, SARA presents a unique procedure that associates
technical and economic efficiency indicators together with the
possibility to accept moderate levels of reliability given that the
RWHS operates as an alternative source of water supply.
Technical viability depends on design parameters of the system (such as rainwater collected surface area, system water demand, reservoir capacity) and local climate, mainly precipitation regime. On the other hand, the economic analysis is performed
considering a benefit cost analysis of the system.
The total costs of the RWHS include initial construction costs
plus operational and maintenance costs. The SINAPI table (National Research System of Costs and Indices for the Civil Engineering Sector) was the basis for the calculation of the construction costs associated with the lower and upper reservoir and the pumping
system. The SINAPI table results of the cooperation of Caixa
Econômica Federal (CAIXA- Federal Cashier) and the Brazilian
Institute of Geography and Statistics – IBGE. The SINAPI data are monthly updated for the whole country. The RWHS costs
also include contingencies costs that are 30% of the total costs.
While the operational and maintenance costs are 6% of the total
costs according to Tomaz (2003).
The construction cost of the reservoir results from the multiplication of SINAPI´s table unity costs and the standard design of a surface reservoir made of concrete and with constant depth and width. The volume of the reservoir varies according to different lengths as shown in Figures 2 and 3.
Figure 1. Representation of the RWHS and its water balance
Figure 2. Reservoir layout view.
Figure 3. Reservoir layout lateral view.
The total benefit of the RWHS comes from the reductions
of the consumption of water delivered by the water supply
company. The total volume of water supplied by the RWHS was
multiplied by the water tariff charged by the local water supply company. Values of water tariffs used in this work are available in Sampaio (2013).
The decision support system SARA computes indicators
of performance (water saving efficiency) and presents (or exports)
them in plots according to reservoir volumes. The results can also
be exported to eletronic tables.
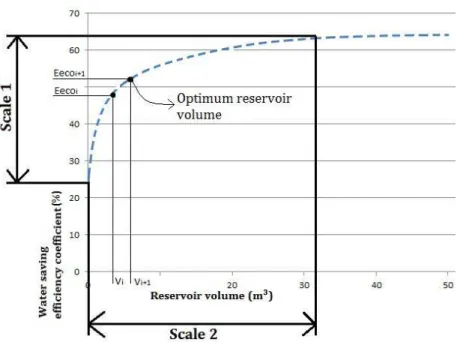
In order to indicate the best reservoir capacity for the RWHS, the SARA uses the Eeco performance indicator. Equation 6 and
Figure 4 shows the procedure to indicate the best alternative of
reservoir volume for each local (city). The best alternative volume is reached when an increase in the reservoir volume do not results
in a proportional increase in the water saving efficiency, Eeco. This point is at the greater slope of the efficiency curve (Figure 4) where it turns into asymptotic behavior. This is a preliminary
definition of optimum reservoir volume for the RWHS.
The second step of the analysis consists of an economic
evaluation of the RWHS considering the preliminary optimum
volume selected by the previous technical analysis. If the
benefit cost ration of the RWHS designed considering the
uprising curve of volume x B/C ration until it finds a B/C
ration greater than 1. Then, that volume is defined as the best
reservoir volume for that configuration of RWHS. If none of the reservoir volumes has B/C ratios greater than 1, then
SARA indicates as the best reservoir volume the one that
has greater B/C ratio.
i 1 i
ot i 1 i 1 i
Eeco Eeco Scale1
When then V V
V V Scale 2
+
+ +
− ≤ =
+ (6)
where:
Eeco: water saving coefficient;
V: reservoir volume, in m3;
Vot: optimum volume, in m3.
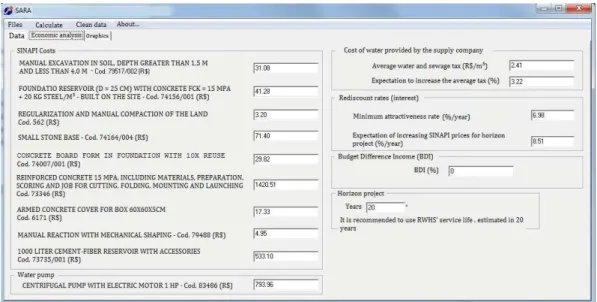
Figures 5, 6 and 7 presents some of the interfaces of the SARA system, the input data interface, the economic analysis
data interface showing the SINAPI table indicators and finally,
the simulation results interface, respectively.
Diagrams for the preliminary design e viability evaluation of urban RWHS
The proposed methodology can be easily applied and
verified upon the use of the system SARA. Additionally, this
paper presents diagrams that can be used as easy tool for the
initial design of RWHS in specific urban locations. The diagrams
are comprised of many simulation results originated in SARA for different urban areas with different precipitation patterns (Manaus, Brasília and Porto Alegre).
In order to build the diagrams, 400 scenarios were simulated in SARA combining non potable water
demands (varying from 0,5 to 20 m3/day) and roof areas
(varying from 100 to 1000 m2) and the results were processed in
the Surfer (GOLDEN SOFTWARE, 2012) to build the diagrams. The krigagem function of Surfer (GOLDEN SOFTWARE, 2012)
generated continuous surfaces where each intersection point of
water demand and roof area defines an optimum reservoir volume
(contour line). The diagrams are tools to indicate preliminarily reservoir volumes according to available roof areas and non potable water demands in certain urban areas.
The manipulation of the diagrams does not require specialized knowledge and allows the definition of accumulation volumes for RWHS in an easy way.
RESULTS AND DISCUSSION
Two diagrams were developed per chosen city, one constructed from simulations that considered only the technical performance criterion to indicate the optimal volume and another one constructed from simulations that considered the combination
Figure 5. Input data interface of SARA.
Figure 4. Simulation results: reservoir volume x water saving efficiency coefficient indicating the preliminary optimum reservoir
of the technical and economic performance criterions to determine the preliminary design of the reservoir.
The reason for creating two diagrams for each city is to offer users a possibility to promote preliminary design of the
reservoirs, having as criterion only the efficiency indicator of
water saving, in cases where the construction method of the
RWHS’ accumulation reservoir is not the same adopted in this
work (underground reservoir made of reinforced concrete). On the other hand, the diagram constructed from the simulations that determined the ideal volumes through the combination of technical and economic indicators can be useful for users who
intend to build a RWHS with accumulation reservoir similar to
the present research.
The diagrams of Manaus/AM, Brasília/DF and Porto Alegre/RS are presented in Figures 8 to 10. The reader is invited to refer to Sampaio (2013) to see other diagrams that were designed
for different urban areas such as Belém/PA, Belo Horizonte/BH, Cuiabá/MT, Curitiba/PR, Fortaleza/CE, Recife/PE and São Paulo/SP.
In all diagrams, hatching areas indicate situations in which the preliminary design returned zero as optimum volume, implying
that the technical and/or economic analysis of the RWHS is not favorable for that specific situation (water demand, roof area and
precipitation pattern).
The diagrams of Manaus/AM, where the precipitation
regime favors the replenishment of the accumulation reservoir
frequently, are very similar, indicating that the economic viability
is not an effective restriction to the ideal size of the reservoir, especially for demands greater than 4 m3/day. On the other hand,
in the region of lower demands (lesser than 4 m3/day), there is
a differentiation in the curves between the two diagrams. It is understood that for minor demands, there is no reason to build very large accumulation reservoirs, since their costs burden the total cost of the alternative of rainwater harvesting and does not
add significantly to the efficiency of the system. The diagram of
Figure 8a indicates a volume reservoir between 14 m3 and 15 m3
for buildings with area of 300 m2 and a demand around 2 m3,
Figure 6. Input data interface of SARA for the economic analysis.
while the diagram of Figure 8b (which includes the economic restriction) indicates an ideal volume between 6 m3 and 8 m3 for
this type of building. That is, in these situations, there is no reason
to build large reservoirs if it is possible to replenish it frequently
due to a precipitation pattern of frequent rain.
The Brasilia diagrams show a very different trajectory when the economic constraint is imposed on the feasibility analysis. In this city, the precipitation pattern presents a very long drought
period (from 3 to 4 months) greatly influencing the efficiency indexes of the system and the ideal reservoir size with economic
restriction. It is observed, for example, that for a building with 500 m2 of catchment area and demand of 2 m3, the reservoirs
with ideal volumes are 20 m3 and 6 m3 without and with economic
restriction, respectively. The same pattern of differentiation between diagrams is found in Porto Alegre, although less pronounced for demands above 4 m3.
The diagram analysis show that, in general, the ideal volumes obtained by the diagrams generated from the combination of technical and economic performance criterions return smaller volumes than those obtained by the diagrams generated
Figure 8. A) RWHS design diagram for the city of Manaus/AM considering only the technical indicator. B) RWHS design diagram
for the city of Manaus/AM considering both the technical and economic indicators.
Figure 9. A) RWHS design diagram for the city of Brasilia/DF considering only the technical indicator. B) RWHS design diagram
based only on the technical performance criterion. This was
expected since, from a certain point, the larger the volumes of
accumulation reservoirs, the more unfavorable would be the
benefit-cost ratio.
Another aspect that can be observed is that the diagrams
return approximately constant values of ideal preliminary volumes
design to low demand levels (generally below 3 m3) associated to
different catchment areas (usually from 200 m2). This observation
is represented by the horizontal insets drawn in the lower region of the diagrams. This is because at low levels of demand, the increase in catchment area may be innocuous, since demand is already met, which will cause an increase in the volume of water to be discarded into the drainage network, disfavoring the
efficiency of the system. It is also observed that the precipitation regime differentiated between the cities exemplified in this work (Manaus, Brasília and Porto Alegre) influences the different layout
of each diagram.
CONCLUSIONS
The major objective of this work the definition of a
methodology for preliminary design of storage reservoirs of
RWHS and evaluation of the feasibility of implantation of these
systems to supply non-potable water in urban centers as an alternative to reduce the demand of drinking water provided by sanitation companies. The proposed methodology incorporates economic analysis into the technical analysis of the system and was implemented in the decision support system SARA in order
to facilitate its application. RWHS performance indicators based on water saving efficiency coupled with a benefit-cost analysis are the main variables defining the selection of the ideal storage reservoir volume, which has been considered the most expensive component of a RWHS with great influence on its viability.
The methodology embedded in SARA was applied to
draw RWHS diagrams to function as design tools for preliminary definition of the best reservoir storage according to pairs of demand
for non-potable water and roof area. The diagrams presented in this paper was drawn using the results of the simulation of 400 combinations of non-potable water demand scenarios and
catchment area in Brasília/DF, Manaus/AM and Porto Alegre/RS. Two diagrams were built for each city. The first diagram promotes the pre-sizing considering only the criterion of efficiency
of water saving (technical performance). The second diagram adds the analysis of economical feasibility to the accumulation reservoir preliminary design. The diagrams are available for buildings whose roof areas are up to 1000 m2 and demand for non-potable water
are up to 20 m3/day.
The diagrams indicate the viability of the RWHS and
perform the preliminary design of its storage reservoirs in a simple
and direct way, without requiring specific knowledge and can be
used directly even by professionals from other areas.
It was possible to observe the influence of the economic criterion and the precipitation regime in the RWHS viability
studies from the analysis of the variety of patterns of the isolines in the diagrams in the cities presented. For a given typology of construction (characterized by catchment area and demand level), the ideal reservoir volumes were different for Manaus, Brasília and Porto Alegre.
Finally, it is important to emphasize that the results suggested in the diagrams or by SARA are preliminaries and should be
applied considering the specific characteristics of each building and rese.voir. However, these results may be very useful to give initial insights related to the RWHS viability. Additional analyses are required to define a final decision.
Figure 10. A) RWHS design diagram for the city of Porto Alegre/RS considering only the technical indicator. B) RWHS design
REFERENCES
ABNT – ASSOCIAÇÃO BRASILEIRA DE NORMAS TÉCNICAS.
NBR 15.527: aproveitamento de água de chuva em áreas urbanas
para fins não potáveis – requisitos. Rio de Janeiro, 2007. 8 p.
ANA – AGÊNCIA NACIONAL DE ÁGUAS. Encarte Especial sobre a Crise Hídrica- Informe 2014. Conjuntura dos Recursos Hídricos no Brasil. Brasília, 2015. 31 p.
ANDRADE, L. R.; MAIA, A. G.; LUCIO, P. S. Relevance of hydrological variables in water-saving efficiency of domestic Rainwater tanks: multivariate statistical analysis. Journal of Hydrology, v. 545, p. 163-171, 2017. http://dx.doi.org/10.1016/j.jhydrol.2016.12.027.
CORDOVA, M. M.; GHISI, E. Analysis of potable water savings
using behavioural models. In: JHA, M. (Ed.). Water conservation.
London: INTECH, 2011. p. 89-97. http://dx.doi.org/10.5772/32647.
DEOREO, W. B.; MAYER, P. W. Residential end uses of water. Denver:
AWWA Research Foundation, 1999.
DIXON, A.; BUTLER, D.; FEWKES, A. Computer simulation of domestic water reuse system: investigating greywater and rainwater in combination. Water Science & Technology, v. 38, n. 4,
p. 25-32, 1999.
DORNELLES, F.; TASSI, R.; GOLDENFUM, J. A. Avaliação de técnicas de dimensionamento de reservatórios para aproveitamento de água de chuva. Revista Brasileira de Recursos Hídricos, v. 15, n. 2,
p. 59-68, 2010. http://dx.doi.org/10.21168/rbrh.v15n2.p59-68.
FEWKES, A. Modelling the performance of rainwater collection systems: towards a generalised approach. Urban Water, v. 1, n. 4, p. 323-333, 2000. https://doi.org/10.1016/S1462-0758(00)00026-1.
GHISI, E.; CORDOVA, M. M. Netuno 4 – Manual do usuário: programa computacional. Florianópolis: Universidade Federal de
Santa Catarina, 2014. Available from: <http://www.labeee.ufsc. br/>. Access on: 25 june 2016.
GHISI, E.; FERREIRA, D. F. Potential for potable water savings by using rainwater and greywater in a multi-storey residential building in Southern Brazil. Building and Environment, v. 42, n. 7, p.
2512-2522, 2006. http://dx.doi.org/10.1016/j.buildenv.2006.07.019.
GHISI, E.; OLIVEIRA, S. M. Potential for potable water savings by combining the use of rainwater and greywater in houses in southern Brazil. Building and Environment, v. 42, n. 4, p. 1731-1742, 2007. http://dx.doi.org/10.1016/j.buildenv.2006.02.001.
GOLDEN SOFTWARE. Surfer versão 11.0.64 Surface Mapping System.
Golden, 2012. Available from: <http://www.goldensoftware. com>. Access on: 25 june 2016.
JENKINS, D.; PEARSON, F.; MOORE, E.; SUN, J. K.; VALENTINE, R. Feasibility of rainwater collection systems in California.
Oakland: California Water Resources Center, 1978.
MORUZZI, R. B.; CARVALHO, G. S.; OLIVEIRA, S. C. Procedimento para dimensionamento de reservatório de água pluvial para residências unifamiliares: viabilidade e aprimoramento metodológico. Teoria e Prática na Engenharia Civil, v. 12, n. 19, p. 89-99. 2012.
MORUZZI, R. B.; OLIVEIRA, S. C. Aplicação de programa computacional no dimensionamento de volume de reservatório para sistema de aproveitamento de água pluvial da cidade de Pontra Grossa, PR. Revista de Engenharia e Tecnologia, v. 2, n. 1, p. 36-48, 2010.
MORUZZI, R. B.; SOUSA JÚNIOR, W. C.; ARDUINO, J.; JULIO, M. Avaliação do aproveitamento de água pluvial para atendimento
de uso não potável no Aeroporto Internacional de São Paulo/
Guarulho. Engenharia Sanitaria e Ambiental, v. 21, n. 1, p. 17-28, 2016. http://dx.doi.org/10.1590/S1413-41520201600100117248.
MURÇA, M. C. R. Aproveitamento de águas pluviais em instalações militares do Comando da Aeronáutica: aplicação ao caso do PAMA-GL.
2011. 138 f. Trabalho de graduação (Engenharia Civil) – Divisão
de Engenharia Civil, Instituto Tecnológico de Aeronáutica, São José dos Campos, 2011.
MURÇA, M. C. R.; JULIO, M.; MORUZZI, R. B. Metodologia de otimização para o dimensionamento de reservatórios de águas pluviais. Revista Brasileira de Recursos Hídricos, v. 19, n. 2, p. 29-40, 2014. http://dx.doi.org/10.21168/rbrh.v19n2.p29-40.
NASCIMENTO, P. H. R.; MORUZZI, R. B. Programa computacional de suporte à decisão para cálculo de reservatórios de armazenamento em sistemas de captação e aproveitamento de água pluvial em áreas urbanas. In: CONGRESSO BRASILEIRO
DE ENGENHARIA SANITÁRIA E AMBIENTAL, 25., 2009,
Recife, PE. Anais... Rio de Janeiro: ABES, 2009. p. 1-9.
PALLA, A.; GNECCO, I.; LANZA, L. G. Non-dimensional design parameters and performance assessment of rainwater harvesting systems. Journal of Hydrology, v. 401, n. 1-2, p. 65-76, 2011. http://
dx.doi.org/10.1016/j.jhydrol.2011.02.009.
PELAK, N.; PORPORATO, A. Sizing a rainwater harvesting cistern by minimizing costs. Journal of Hydrology, v. 541, p. 1340-1347, 2016. http://dx.doi.org/10.1016/j.jhydrol.2016.08.036.
RUPP, R. F.; MUNARIM, U.; GHISI, E. Comparação de métodos para dimensionamento de reservatórios de água pluvial. Ambiente Construído, v. 11, n. 4, p. 47-64, 2011. http://dx.doi.org/10.1590/
S1678-86212011000400005.
SAMPAIO, F. E. O. V. Análise da viabilidade de implantação e pré-dimensionamento de sistemas de aproveitamento de água pluvial em centros urbanos. 2013. 165 f. Dissertação (Mestrado em Tecnologia
Ambiental e Recursos Hídridos) – Departamento de Engenharia
Civil e Ambiental, Faculdade de Tecnologia, Universidade de
THACKRAY, J. E.; COCKER, V.; ARCHIBALD, G. The Malvern and Mansfield studies of domestic water usage. Proceedings of the Institution of Civil Engineers, Pt. 1, v. 64, p. 37-61, 1978. https://
doi.org/10.1680/iicep.1978.2741.
TOMAZ, P. Aproveitamento de água de chuva: aproveitamento de água de chuva para áreas urbanas e fins não potáveis. São Paulo: Navegar, 2003.
WHO – WORLD HEALTH ORGANIZATION. Progress on sanitation and drinking water – 2015 update and MDG assessment.
Geneva, 2015.
Authors contributions
Felipe Eugênio de Oliveira Vaz Sampaio: responsible for the paper conception, the methodology implementation, SARA design and programming, references research, result analysis and conclusions,
design of diagram, figures and tables, writing the paper.
Conceição de Maria Albuquerque Alves: responsible for the paper conception, the methodology definition, research supervision,