M
ASTER OF
S
CIENCE IN
FINANCE
M
ASTERS
F
INAL
W
ORK
PROJECT
EQUITY RESEARCH
:
TOTAL,
SA
P
EDRO
L
OURENÇO
M
ASTER OF
S
CIENCE IN
FINANCE
M
ASTERS
F
INAL
W
ORK
PROJECT
EQUITY RESEARCH
:
TOTAL,
SA
P
EDRO
L
OURENÇO
S
UPERVISOR
:
VICTOR
MAURÍLIO
SILVA
BARROS
i
Abstract
TOTAL S.A. (“TOTAL”) is a major Oil & Gas player, that operates worldwide with an
integrated operating model, including the exploration and production of oil and natural
gas, refining, petrochemicals, and the marketing of fuels and lubricants – TOTAL is the
world’s 4
thbiggest IOC, with a 2018FY
total asset of €224Bn and a market
capitalization of €121.8Bn.
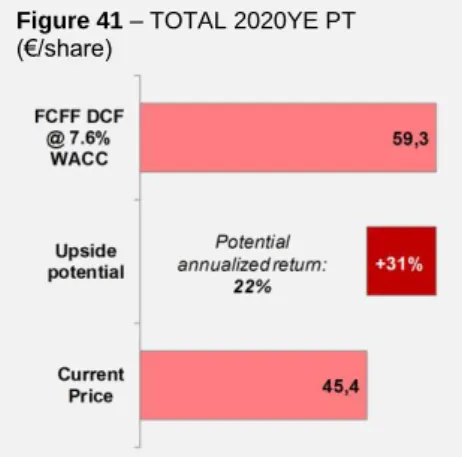
TOTAL has a BUY recommendation, with a 2020YE PT of €59.3/share, meaning an
upside potential of 31%, or a potential annualized return of 22%, against the closing
price of €45.4 at August 30th, 2019, but with high risk.
The current undervaluation of TOTAL shares is mainly explainable due to i) the
pessimist expectations on global economy growth, that directly impacts on the world
energy demand, ii) the exposure to commodities price volatility, iii) geopolitical
instability and iv) uncertainty about the energy transition trend pace.
Regarding the forthcoming industry trends, TOTAL has a focused strategy that
integrates the challenges of climate change. Regarding this, it is expected that the Gas,
Renewables & Power business segment, that includes the low carbon power
generation and energy efficiency business, grow from 7.1% of TOTAL revenues in
2018 to 21.6% in 2023F.
In addition, TOTAL solid financial position and commitment to the current shareholder
return policy, even in lower-earning years, makes credible the dividend increases of
+10% and the buyback program of up to $5Bn over the 2018-2020 period.
JEL classification: G10; G32; G34
Keywords: Total SA; Oil & Gas; Oil; Natural Gas; Renewables; Power; Refining; Equity
Research; Valuation; Mergers & Acquisitions; M&A
ii
Resumo
A TOTAL S.A. (“TOTAL”) é uma das maiores empresas da indústria de exploração de
Petróleo e Gás Natural, com operações à escala mundial e um modelo operativo
integrado, que abrange toda a cadeia de valor da indústria
– a TOTAL é a 4ª maior
empresa cotada desta indústria a nível mundial, com um ativo de €224 biliões e uma
capitalização bolsista de €121,8 biliões.
A TOTAL tem uma recomendação de investimento de “COMPRA”, com um preço alvo
de €59,3/acção no final de 2020, com uma valorização potencial de 31% face ao preço
de fecho de €45.3, em 30 de Agosto de 2019, mas com risco elevado.
A atual subvalorização da TOTAL deve-se essencialmente a i) expectativas
pessimistas do desempenho económico mundial, ii) exposição do preço das
matérias-primas, iii) instabilidade geopolítica e iv) à incerteza associada à tendência de
transição energética.
Relativamente às tendências futuras da indústria, a TOTAL tem o seu foco estratégico
nos desafios da sustentabilidade ambiental e nas alterações climáticas. É disto
exemplo o foco no crescimento do segmento de negócio ligado às energias
renováveis, com um crescimento esperado de 14,5 pontos percentuais no peso das
vendas, entre 2018 e 2023.
Adicionalmente, a sólida posição financeira da TOTAL e o compromisso com a política
de retorno para os accionistas, credibiliza a expectativa de crescimento dos
dividendos de +10% entre 2018 e 2020, bem como o programa de recompra de
acções de $5 biliões no mesmo período.
Classificação JEL: G10; G32; G34
Palavras-Chave: Total SA; Equity Research; Avaliação de Empresas; Fusões e
Aquisições; Petróleo; Gás Natural; Renováveis
iii
Acknowledgements
“It will be as when a man who was going on a journey called in his servants and
entrusted his possessions to them. To one he gave five talents; to another, two; to a
third, one - to each according to his ability. Then he went away. Immediately the one
who received five talents went and traded with them, and made another five. (…)
After a long time the master of those servants came back and settled accounts with
them. The one who had received five talents came forward bringing the additional five.
He said, 'Master, you gave me five talents. See, I have made five more.' His master
said to him, 'Well done, my good and faithful servant. Since you were faithful in small
matters, I will give you great responsibilities. Come, share your master's joy.' ”
Matthew 25:14-30
My deepest thanks,
To the love of my life Vânia, our sweetest daughters Laura and Madalena, and our new
coming baby;
My beloved parents, Rosa and Adriano;
My sister, brother-in-law and goddaughter, Inês, Pedro and Elisabete;
My godsons, Lourenço, Luís and Helena;
iv
Index
1. Research Snapshot
1
2. Business Description
2
The Company
2
The History
2
Financial highlights
2
TOTAL’s business segments
2
Key drivers of profitability
4
Strategy
4
Shareholder structure
5
Dividend policy
5
3. Management and Corporate Governance
6
Governance Model
6
The Board of Directors
6
The Executive Commission
7
Sustainability and ESG metrics
7
4. Industry Overview and Competitive Positioning
8
World Economic Outlook
8
Global Oil & Gas Industry Overview
9
Competitive Positioning
12
5. Investment Summary
15
Valuation methods
15
Investment risks
15
6. Valuation
16
WACC Method – A Sum of the Parts (SoP) Approach
16
WACC Method – The value of an Integrated Operating Model
17
Flow-to-Equity Method
18
Total Payout Model
18
Market-Based Valuation
18
7. Financial Analysis
19
Focus on operational efficiency
19
Reliable solvency and stable capital structure
19
Improving profitability
19
Solid cash generation
19
8. Investment Risks
20
Macroeconomic risks
20
Political and regulatory risks
20
Natural risks
21
Market and financial risks
21
Operational risks
22
v
List of Figures
Figure 1 – 52-week stock price vs. PT
1
Figure 2 – Financial highlights
1
Figure 3 – Shareholder return policy
1
Figure 4 – Oil and Natural Gas primary energy source global demand (mboe/d)
1
Figure 5 – EBITDA per business segment (€Bn)
1
Figure 6 – PT sensitiveness to commodity price (€/share)
1
Figure 7 – TOTAL 2018FY major figures
2
Figure 8 – TOTAL latest major M&A operations
2
Figure 9 – TOTAL Upstream Oil and Gas production
3
Figure 10 – E&P segment Revenues and EBITDA (€Bn)
3
Figure 11 – Gas, Renewables & Power segment Revenues and EBITDA (€Bn)
3
Figure 12 – Refining & Chemicals segment Revenues and EBITDA (€Bn)
4
Figure 13 – Marketing & Services segment Revenues and EBITDA (€Bn)
4
Figure 14 – Oil integrated operating model activities
4
Figure 15 – Shareholding structure by shareholder type (% share of capital)
5
Figure 16 – TOTAL top 10 Shareholders (% share of capital)
5
Figure 17 – Dividend per share (DPS) and Pay-out ratio
5
Figure 18 – Mr. Patrick Pouyanné profile
6
Figure 19 – Independent Directors proportion in the Board
6
Figure 20 – Mr. Patrick Pouyanné compensation (€M)*
7
Figure 21 – Mr. Patrick Pouyanné variable compensation scheme*
7
Figure 22 – ESG metrics
7
Figure 23 – World GDP real growth (Annual percent change)
8
Figure 24 – World population (Millions of people)
8
Figure 25 – Global primary energy demand by region (mboe/d)
8
Figure 26 – Global primary energy demand by fuel type (mboe/d)
8
Figure 27 – Global Oil supply by region (mb/d)
9
Figure 28 – Brent 52-week evolution ($/b)
9
Figure 29 – Brent price forecast (annual average $/b)
9
Figure 30 – Oil & Gas industry business cycle
9
Figure 31 – Upstream global deal count (#) and value ($Bn)
10
Figure 32 – Wind, solar and other renewables weight in primary energy sources
10
Figure 33 – Share of new passenger car sales by powertrain (%)
11
Figure 34 – TOTAL price vs. Brent evolution (Base year analysis)
11
Figure 35 – BICS Integrated Oils ranked by market cap (€M)
12
Figure 36 – SWOT analysis
12
Figure 37 – Porter’s 5 Forces
13
Figure 38 – OPEC supply market share (%, 2017)
13
Figure 39 – IOC peer group Total Assets (€M, 2018YE)
14
vi
Figure 41 – TOTAL 2020YE PT (€/share)
15
Figure 42 – Valuation methods PT comparison vs. current price ($/share)
15
Figure 43 – SoP Equity vs. IOC Equity valuation (€Bn)
15
Figure 44 – Brent annual average price ($/b)
16
Figure 45 – WACC build up
17
Figure 46 – 2020YE Price Target with FCFF on Integrated company (€Bn)
17
Figure 47 – Shareholders total cashflow (€Bn)
18
Figure 48 – Market-Based Valuation (€/share)
18
Figure 49 – Business margins
19
Figure 50 – Solvency indicators
19
Figure 51 – Capital structure ratios
19
Figure 52 – NPM and ROE
19
Figure 53 – Risk Matrix
20
Figure 54 – World real GDP growth (annual percent change)
20
Figure 55 – Upstream production by region (kboe/d; 2018)
20
Figure 56 – Brent monthly prices ($/b)
21
Figure 57 – EUR/USD spot prices
22
Figure 58 – Investment recommendation system – High Risk
22
Figure 59 – Price target sensitivity to a potential production break*
22
Figure 60 – Annual average Brent price vs. Upstream production growth rate
23
Figure 61 – Cost of Capital (WACC) vs. Long-run sustainable growth rate (g)
23
Figure 62 – PT sensitivity to different growth rates of GR&P business segment
23
Figure 63 – Monte Carlo simulation output
24
vii
List of Appendices
Appendix 1: “Rule of thumb” shareholder return policy
25
Appendix 2: Long-term steady oil and gas demand outlook
25
Appendix 3: Strategy set to face the future
26
Appendix 4: TOTAL’s worldwide activities
26
Appendix 5: TOTAL business value chain
27
Appendix 6: Oil & Gas industry key drivers of profitability
28
Appendix 7: Oil price impact on industry profitability
29
Appendix 8: TOTAL quote vs. MSCI ACWI
29
Appendix 9: Oil & Gas industry M&A activity
30
Appendix 10: High level organizational structure
31
Appendix 11: TOTAL’s management strategic objectives
31
Appendix 12: World Economic Outlook
32
Appendix 13: World primary energy demand and Oil peak demand expectation
32
Appendix 14: Brent evolution ($/b)
33
Appendix 15: Brent evolution vs. TOTAL price (Base year analysis)
33
Appendix 16: Brent quote volatility
34
Appendix 17: Income Statement
35
Appendix 18: Statement of Financial Position
36
Appendix 19: Cash Flow Statement
36
Appendix 20: Common-Size Income Statement
37
Appendix 21: Common-Size Statement of Financial Position
38
Appendix 22: Common-Size Cash Flow Statement
38
Appendix 23: Key Financial Ratios
39
Appendix 24: Forecasting Assumptions
40
Appendix 25: Risk Free Rate estimation
41
Appendix 26: Beta estimation
41
Appendix 27: Equity Risk Premium estimation
42
Appendix 28: Cost of Debt estimation
42
Appendix 29: Cost of Equity (CAPM) and Cost of Capital (WACC)
43
Appendix 30: Terminal Value FCF normalization
44
Appendix 31: Long-run sustainable growth rate
45
Appendix 32: WACC Method – Integrated Enterprise Value
45
Appendix 33: WACC Method – Sum of the Parts
46
Appendix 34: Flow-to-Equity Method
47
Appendix 35: Total Payout Model
47
Appendix 36: Industry peers selection
48
Appendix 37: Market-Based Valuation
48
Appendix 38: Upstream production by geographical zone (kboe/d)
49
viii
Abbreviations
B b (/d) Barrel(s) (per day) K kb (/d) Thousand(s) barrels (per day)
BaU Business as Usual kboe (/d) Thousand(s) barrel of oil equivalent (per day)
B2B Business-to-Business L LNG Liquified Natural Gas
B2C Business-to-Consumer LPG Liquified Petroleum Gas
BEV Battery electric vehicles M M Million(s) (as in "€M") Bn Billion(s) (as in "€Bn") M&A Mergers and Aquisitions
boe (/d) Barrel of oil equivalent (per day) M&S Marketing & Services business segment
bps Basis points m b (/d) Million(s) barrels (per day)
C CAGR Compound Annual Grow th Rate m boe (/d) Million(s) barrel of oil equivalent (per day) CAPEX Capital expenditure MBV Market-Based Valuation
CAPM Capital Asset Pricing Model MENA Middle East and North Africa (region)
CCGT Combined-Cycle Gas Turbine N NGL Natural Gas Liquids
CCUS Carbon Capture, Use and Storage NGV Natural gas vehicle
CEO Chief Executive Officer NOC National Oil Company
CFO Cash flow from operating activities NWC Net Working Capital
CFO Chief Financial Officer O OECD Organisation for Economic Co-operation and Development CHP Combined Heat and Pow er OPEC Organization of the Petroleum Exporting Countries
CO2 Carbon dioxide OPEX Operational expenditure
CRP Country Risk Premium P p.a. Per annum
D D Debt PHEV Plug-in hybrid electric vehicle
DCF Discounted Cash Flow POC Public Oil Company
DDM Dividend Discount Model PRC People’s Republic of China
E E Equity PT Price Target
E&P Exploration & Production business segment PV Photovoltaic (panels or cells) EBIT Earnings Before Interest and Taxes R R&C Refining & Chemicals business segment EBITDA Earnings Before Interest, Taxes, Depreciation and Amortization R&D Research and Development
EIA U.S. Energy Information Administration RFR Risk free rate
ERP Equity Risk Premium ROACE Return on Average Capital Employed
ESG Environmental, Social, and Governance ROE Return on Equity
EU The European Union ROIC Return on Invested Capital
EUR Euro S SDG Sustainable Development Goal(s)
EV Entreprise Value SoP Sum of the Parts (valuation approach)
EV Electric vehicle T t Corporate tax rate
F F Forecast (as in F2020) U UK The United Kingdom
FCFE Free Cash Flow to Equity UN United Nations Organization
FCFF Free Cash Flow to the Firm US The United States of America
FCV Fuel cell vehicles W WACC Weighted Average Cost of Capital
FY Fiscal Year (as in FY2018) WC Working Capital
G GDP Gross Domestic Product Y YE Year End (as in 2019YE)
GHG Greenhouse Gas YoY Year-over-year
GR&P Gas, Renew ables & Pow er business segment Z ZEV Zero-emission vehicle GW Gigaw att(s)
H HEV Hybrid electric vehicle I ICE Internal combustion engine
IMF International Monetary Fund IOC Integrated Oil Company ISS Institutional Shareholder Services
1
1. Research Snapshot
TOTAL: Shaping a strategy to lead the energy transition trend
We issue a BUY recommendation for TOTAL S.A. (“TOTAL”) with a 2020YE PT of
€59.3/share, using a DCF model, implying a 31% upside potential from August
30th, 2019 closing price of €45.4, although with high risk (Figure 1).
In a difficult market environment, with high exposure to commodities price, TOTAL
integrated operating model and strategic priorities reinforce its resilience to
remain profitable and consistently delivering value to shareholders. The transition trend towards greener energy should not jeopardize TOTAL’s position in the market, due to World’s oil dependence and TOTAL strategic focusing.
“Rule of thumb” shareholder return policy
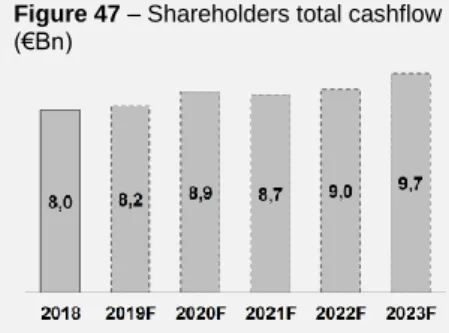
TOTAL management reiterates its shareholder return policy, which was kept even in lower-earning years. Financial projections, with a solid financial position and a sound cash generation – CFO 2018-2023F CAGR +5.7%, from €20.9Bn to €27.7Bn in 2023F (Figure 2) – makes credible the dividend increase of +10% and the
buyback program of up to $5Bn the 2018-2020 period (Figure 3) (Appendix 1).
Steady oil and gas demand outlook
Although the short-term pronunciation of a global economy slowdown and uncertainty about energy transition rhythm, it is expected that oil and gas demand grow steadily in the long run. Natural Gas has the higher expected growth as
primary energy source of 32 mboe/d between 2015 and 2040, a +1.7%
2015-2040F CAGR. Long-term Oil demand is expected to increase by 15 mb/d in the same period, a +0.6% 2015-2040F CAGR (Figure 4) (Appendix 2).
Despite relatively low demand growth rates, fossil fuels are projected to remain
the dominant component in the global energy mix, with primary energy
source mix (Appendix 13).
With a strong and disciplined E&P segment, TOTAL is expected to leverage this trend with a EBITDA +3.0% 2018-2023F CAGR from Upstream activities (Figure 5).
Strategy set to face the future
Beyond the Upstream segment core, TOTAL sees the energy transition trend as an opportunity, integrating climate challenges into its strategy. TOTAL set the
expansion of low carbon power generation and energy efficiency business as
a strategic priority. Thus, it is expected to see a GRP segment EBITDA growth
from €0.4Bn in 2018 to €6.2Bn in 2023F (Appendix 3).
…But in the end, it’s all about commodities price
Although management resilience and track record of consistently delivering
the targeted strategic objectives over the years, TOTAL exposure to commodities price, the major key driver of profitability, impacts directly on
company earnings and valuation (Figure 6).
Equity Research – TOTAL, SA
| Euronext Paris
August 2019 |
BUY
Price Target €59.3
Current Price (Aug.30th) €45.4
Upside potential 31%
Annualized return 22%
High risk Bloomberg/ Reuters code
FP FP / TOTF.PA
Market cap (€M) 121,846
Free float (%) 100%
No. shares outstanding (#M) 2,641 YTD performance (%) -0.2% 52-week range (€) €43.2 - €54.2
Figure 3 – Shareholder return policy 2018 2019F 2023F Dividend (€/sh.) 2.56 2.64 3.02 Payout ratio (%) 70% 75% 57% Div. yield (%) 5.5% 4.6% 4.6% Sh.buyback($Bn) 1.5 1.5 2.0
Figure 5 – EBITDA per business segment (€Bn)
Source: Author analysis
Figure 6 – PT sensitiveness to commodity price (€/share)
Source: Author analysis
Figure 4 – Oil and Natural Gas primary energy source global demand (mboe/d)
Source: World Oil Outlook 2040,
Figure 2 – Financial highlights
2018 2019F 2023F Revenues (€Bn) 156.0 147.6 194.7 EBITDA (€Bn) 25.9 26.0 36.2 EBITDA Mg. (%) 14.6% 15.4% 16.7% Net Profit (€Bn) 9.7 9.2 14.1 NPM (%) 5.5% 5.5% 6.5% CFO (€Bn) 20.9 19.8 27.7 CAPEX (€Bn) 13.2 13.1 15.3 Debt Ratio (%) 54% 54% 53% Debt/EBITDA (x) 4.7 4.6 3.6 Int. Coverage (x) 7.8 9.6 13.7 ROIC (%) 8.5% 8.1% 11.5% ROCE (%) 8.3% 7.9% 11.4% ROE (%) 9.4% 8.9% 12.2%
Figure 1 – 52-week stock price vs. PT
2
2. Business Description
The Company
TOTAL S.A. (“TOTAL”) is a major Oil & Gas player, that operates worldwide with
an integrated operating model (Appendix 4), including the exploration and
production of oil and natural gas, refining, petrochemicals, and the marketing of fuels and lubricants – TOTAL is the world’s 4th biggest IOC, with a total asset of
€224Bn and a market capitalization of €121.8Bn.
It also operates in the energy value chain (gas and renewables), namely in the low-carbon electricity production, distribution and retail activities – TOTAL is the world’s
2nd LNG player (Appendix 5).
TOTAL has the ambition of becoming a responsible energy major, with over 100,000 employees committed to supplying a more affordable, cleaner and accessible energy to as many people as possible (Figure 7).
The History
The Company history starts in 1924 with the creation of the Compagnie Française des Pétroles (CFP). Its international profile is present right since the beginning, with the initial discovery of the Kirkuk field in Iraq in 1927.
TOTAL is launched as a brand in 1954 and the Company formally adopted this designation for the first time in 1991.
After a long process of international expansion, TOTAL became the world's 4th
largest Oil & Gas publicly-traded company with the incorporation of Fina and Elf Aquitaine, in 2000, and changes its designation to TotalFinaElf. The Company changes again its designation to TOTAL in 2003.
Besides the organic growth in the following years, TOTAL made some major M&A
operations, such as 60% of SunPower (solar energy business in a cash transaction
of €1,058M) in 2011, Saft Groupe (battery manufacturer in a cash transaction of €986M) and Lamparis (green energy supplier – non disclosed agreement) in 2016, Maersk Olie og Gas A/S (Maersk Oil&Gas business segment in a paid in stock transaction of €6,304M) and Direct Énergie (electricity producer and distributor in a cash transaction of €2,563M) in 2018. Still in 2018, TOTAL concludes the acquisition of Engie's LNG business (non-disclosed agreement), announced in the previous year, becoming the world's 2nd largest NGL publicly-traded player (Figure 8).
Financial highlights
TOTAL reached in 2018FY €156.0Bn1 of revenues and an EBITDA value of
€25.9Bn2. The net profit reached €9.7Bn3 (Appendix 8 and Appendix 17).
TOTAL’s business segments
In order to manage the volatility of oil and gas commodities, TOTAL evolved as an
integrated operating model over the energy value chain. Thus, TOTAL activities
are structured in four business segments4, that enables the company to benefit from complementary activities synergies and to capture margin within the Group when commodities prices changes.
1 Includes €-58.9Bn of Corporate segment and Intercompany sales adjustment. 2 Includes €-0.1Bn of Corporate segment and Intercompany sales adjustment. 3 Group share, after Minority Interests.
4 Excluding Corporate division (headquarter fees to subsidiaries). Revenues include intersegment and
non-group sales, before intercompany adjustment (Figure 10, Figure 11, Figure 12, Figure 13).
Figure 7 – TOTAL 2018FY major figures
Source: TOTAL’s Registration Document 2018; Bloomberg
Figure 8 – TOTAL latest major M&A operations
Value Paymnt. Type 2000 - Elf Aquitaine €53,506M Stock 2011 - SunPower €1,058M Cash 2016 - Saft Group €986M Cash 2016 - Lamparis n/d n/d 2018 - Maersk Oil €6,304M Stock 2018 - DirectÉnergie €2,563M Cash 2018 - Engie LNG n/d n/d Source: Bloomberg
Exploration & Production (E&P)
The E&P segment encompasses the Group’s oil and gas upstream activities, such as discovery, exploration, development and production of oil and gas fields, and the interests in pipelines.
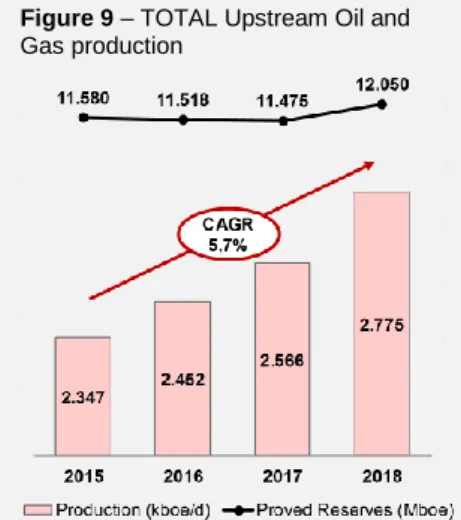
This segment output includes both Liquids (crude oil, Natural Gas Liquids (NGL), bitumen and condensates) and Natural Gas, with the 2018YE production settled
in 2,755 kboe/d and the proved reserves level at 12,050 Mboe (Figure 9).
Considering the current portfolio of reserves5, TOTAL has approximately 20 years
of reserve life based on the 2018 average production rate.
E&P segment contributed to the Group’s 2018YE results with €35,731M in revenues (+18% CAGR 2015-18) and an EBITDA of €21,648M (Figure 10).
Gas, Renewables & Power
Gas, Renewables & Power exists as an individual business segment since 20176
and operates along the full gas (production, shipping, regasification and trading)
and power value chain (from low carbon electricity production to marketing
activities), as well the energy efficiency business (e.g. batteries and energy storage solutions, Carbon Capture, Use and Storage (CCUS) solutions).
After the acquisition of Engie’s LNG business, finalized on July 2018, TOTAL became the world's 2nd largest LNG publicly-traded player. The activities in the gas business also comprise the trading and marketing of natural gas, both Liquified Natural Gas (LNG) and Liquified Petroleum Gas (LPG), with the primary objective of enhancing the value of the Group’s gas resources and ensuring the market placement of upstream production.
In addition, TOTAL also trades Petcoke and Sulfur, and is present in the water desalination business.
TOTAL also aims to pursue the development of expertise in the low carbon power
generation, primarily through cogeneration and combined-cycle power plants, in
addition to the sources of intermittent renewable electricity (wind and solar). At 2018YE, TOTAL had an installed capacity of 2.7 GW, selling the produced electricity to both industrial, commercial and domestic customers.
The Gas, Renewables & Power segment contributed to the Group’s 2018YE results with €15,276M in revenues (+18% CAGR 2015-18) and an EBITDA €379M (Figure 11).
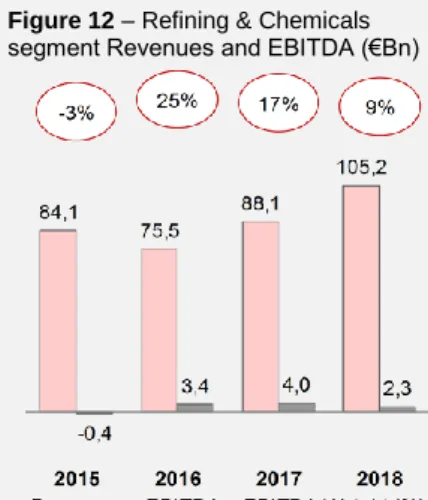
Refining & Chemicals
Refining & Chemicals is a large industrial segment whose outputs include refined
products (gasoline, aviation fuel, diesel and heating oil, heavy fuels and others), base petrochemicals (olefins and aromatics), polymer derivatives (polyethylene,
polypropylene, polystyrene and hydrocarbon resins), biomass transformation and
elastomers transformation.
With a 2018YE crude oil refining capacity of 2,021 kb/d, and a utilization rate of
92%, TOTAL is among the world’s 10th largest integrated producers.
5 Considering proved and probable reserves covered by Exploration & Production contracts on fields
that have been drilled and for which technical studies have demonstrated economic development in the price scenario retained by the Group.
6 Company figures of 2015 and 2016 restated for analysis purposes.
Figure 11 – Gas, Renewables & Power segment Revenues and EBITDA (€Bn)
Source: Bloomberg
Figure 9 – TOTAL Upstream Oil and Gas production
Source: TOTAL’s Registration Document 2018
Figure 10 – E&P segment Revenues and EBITDA (€Bn)
4
It is also included in this segment the Trading & Shipping activities, that are responsible for selling and marketing the Group’s crude oil production, provide a supply of crude oil for the Group’s refineries, charter appropriate ships for these activities and trade on derivatives markets.
This segment contributed to the Group’s 2018YE results with €105,195M in
revenues (+8% CAGR 2015-18) and an EBITDA of €2,322M (Figure 12).
Marketing & Services
The Marketing & Services segment regards to the worldwide supply and
marketing activities of oil products and related services.
TOTAL sells a wide range of products to B2C and B2B clients, namely fuel and services, lubricants, bulk fuels, aviation fuel, special fluids, Liquified Petroleum Gas (LPG), bitumen, heavy fuels and marine bunkers, through a retail network of 14,311
service stations around the world, as of December 31, 2018. At 2018YE sales
reached 1.801 kb/d of petroleum products (+1,2% YoY).
This segment contributed to the Group’s 2018YE results with €58,719M in revenues (+2% CAGR 2015-18) and an EBITDA of €1,694M (Figure 13).
Key drivers of profitability
The main factor that affect TOTAL’s profitability is commodities price. This exposure to market volatility has been the main factor of TOTAL current depressed stock price and the remaining uncertainty around commodities price will continue to pose a substantial risk to the company going forward (Appendix 15).
One action to mitigate commodities price volatility, among others, is the rig portfolio
management through an asset rotation strategy, that consists in the selling of
mature production sites and buy new undeveloped fields with lower break-evens. (e.g. TOTAL sales of upstream assets in the UK North Sea and buy of african assets of Anadarko Petroleum).
Additionally, TOTAL builds value through an integrated operating model that enables synergy capture over the value chain (Figure 14).
Strategy
TOTAL’s ambition is to become the responsible energy major by contributing to
a more affordable, available and cleaner energy, to as many people as possible. TOTAL implements a clear strategy based on four main strategic priorities, that
integrates the challenges of climate change, considering the United Nations
(“UN”) Sustainable Development Goals (“SGD”) in its operations:
• Driver profitable and sustainable growth in Exploration & Production activities, focusing on the production of Natural Gas, the fossil fuel that
emits the least amount of carbon dioxide. Maintain a strict investment discipline, with the concern of producing at a competitive cost and
decreasing the portfolio breakeven (target pre-dividend breakeven below 30$/b and target gearing ratio below 20%), to remain profitable across a broader range of environments;
• Further develop the competitiveness of the large integrated refining and
petrochemicals platforms (e.g. launch of new projects in the US, Saudi
Arabia, South Korea and Algeria) and expand sustainable biofuels and
recycling activities; Ensure units availability and portfolio diversity;
Figure 12 – Refining & Chemicals segment Revenues and EBITDA (€Bn)
Source: Bloomberg
Figure 13 – Marketing & Services segment Revenues and EBITDA (€Bn)
Source: Bloomberg
Figure 14 – Oil integrated operating model activities
Source: TOTAL’s Registration Document 2018
• Increase the distribution of petroleum products, particularly in
high-growing region – focusing on Americas and Asia, with strong growth
opportunities (e.g. 2016 acquisition in Dominican Republic and persecuting new opportunities in Brazil and Mexico, 2016 acquisitions in Philippines and Vietnam, signature of a major partnership with an Indian conglomerate in 2018 to build a retail network of 1.500 service stations, signature of a joint venture with Saudi Aramco to develop a network of fuel and retail in Saudi Arabia), and Russia with the implementation of major industrial projects – and offer innovative solutions and services that meet the needs of customers above and beyond the supply of petroleum products; and • Expand along the full gas value chain by unlocking access to new
markets (e.g. acquisition of Engie’s LNG assets and start-up of Cameron LNG project) and boost profitable growth in the low carbon electricity
business (e.g. acquisition of Direct Énergie), from production based on gas
and renewable energies to electricity and gas distribution to end customers.
Shareholder structure
With a free float of 100%7, TOTAL has a shareholder base of approximately 450,000 investors, being 87.6% of the share of capital detained by institutional
shareholders (Figure 15 and Figure 16).
TOTAL shares, in a total of 2,640,602,007 ordinary shares issued, as of December 31, 2018, are traded in Paris (Euronext Paris), Brussels (Euronext Brussels),
London (London Stock Exchange) and New York (New York Stock Exchange).
The shares held by the Board of Directors and the Executive Commission count for less than 0.5% of share capital, in a total of 701,535 shares.
There is a single category of shares, but double voting right is granted to fully paid shares held continuously by the same shareholder for at least two years.
No privilege is attached to a specific class of shares or to a specific class of shareholders, besides double voting right mentioned before.
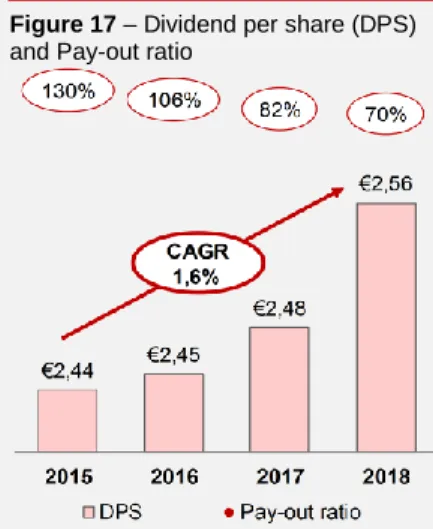
Dividend policy
TOTAL paid a dividend of 2.56€ per share for 2018FY, divided into quarterly payments, according to the dividend payment policy adopted since 2011.
This represents an increase of +3.2% YoY or a +1.6% CAGR 2015-18 (Figure 17). The pay-out ratio for 2018FY was 70%, having this percentage registered a notable decrease since the yearly maximum of 130% in 2015FY. To notice that even in lower-earning years, TOTAL kept their commitment to the dividend policy.
The current shareholder return policy promises a dividend increase by +10% and a buyback program of up to $5 billion8, over the 2018-20 period.
7 Stoxx determined a free float of 100%, for calculating TOTAL’s weight in the Euro Stoxx 50 purposes.
Euronext Paris determined a free float of 95%, as of December 31, 2018, for calculating TOTAL’s weight in the CAC40 purposes.
8 €4.2 billion at FY2018 avg. exchange rate of 1.18 EUR/USD. Buyback program considering a $60/b
Brent scenario, being the total amount of the program possible of be adjusted in function of this variable.
Figure 17 – Dividend per share (DPS) and Pay-out ratio
Source: TOTAL’s Registration Document 2018
Figure 16 – TOTAL top 10 Shareholders (% share of capital)
Source: Bloomberg (as of Sep. 2019)
Figure 15 – Shareholding structure by shareholder type (% share of capital)
Source: TOTAL’s Registration Document 2018
6
3. Management and Corporate Governance
Governance Model
TOTAL follows a Unified Management Form, where Mr. Patrick Pouyanné
assumes both positions of CEO and Chairman of the Board of Directors
(“Chairman”), since 2015, following common industry practice (Figure 18).
The Board of Directors
The Board of Directors (“the Board”) is the collegial body with the responsibility
to state the strategic orientation of the company and to supervise its implementation. It approves investment and divestment decisions when they
concern amounts that exceed 3% of the Group’s equity and is informed of investments and divestments in amounts exceeding 1% of equity. It monitors the management of both financial and extra-financial matters and ensures the quality of the information provided to shareholders and to financial markets.
The Board is composed by 12 members, including the Chairman, 1 Director
representing employees, 1 Director representing employee shareholders and
the remaining 9 independent directors (Figure 19).
Attentive to the concerns of investors and stakeholders, the Board promotes the
balance of power within the Group. Every year the composition of the Board is
appraised to identify desirable changes, to ensure a high level of independence and commitment to the Company.
Another measure related to this concern is the nomination of a Lead Independent
Director, when the same person assumes the position of CEO and Chairman
simultaneously. Among other responsibilities described in Rules and Procedures of the Board, the Lead Independent Director performs periodic due diligences to identify potential conflicts of interest and bring it to the attention of the CEO and Chairman. Following this task, for 2018FY it was concluded that there are no
identified potential conflicts of interest between the Director’s private interests
and their duties to the Company. There is also no knowledge of family
relationships among Board members, or agreement with major stakeholders,
customers or suppliers, and there is no service agreement that binds a Director to TOTAL or any of its subsidiaries.
The Board relies on the work of four Committees: the Audit Committee, the
Governance and Ethics Committee, the Compensation Committee and the Strategic & CSR Committee (Appendix 10).
Each Director is appointed for a three-year period, being the terms of office staggered to space more evenly the renewal of appointments and to ensure the business continuity, in accordance with the recommendations made in the
AFEP-MEDEF Code.
The balance of power within the Group is thereby ensured by stable and structured governance, with a high proportion of independent directors, the nomination of a Lead Independent Director to the Board of Directors and its Committees.
Figure 19 – Independent Directors proportion in the Board
*excluding the director representing employee shareholders and the director representing employees, in accordance with the recommendation of the AFEP-MEDEF Code.
Source: TOTAL’s Registration Document 2018
Figure 18 –
Mr. Patrick Pouyanné profile Board 1st appointment: 2015 Term of office: 2021
• Graduate at École Polytechnique; • Between 1989 and 1996, held
administrative positions in the Ministry of Industry, the Ministry for Information and Aerospace Technologies and other cabinet positions (e.g. technical advisory to the Prime Minister); • Joined TOTAL in 1997, as Chief
Administrative Office of Angola’s E&P division. In 1999 became President of Qatar’s E&P subsidiary. In 2002, was appointed President of Finance, Economy and IT for Exploration & Production. In 2006, became Senior Vice President, Strategy, Business Development and R&D in Exploration & Production, and was appointed as a member of the Group’s Management Committee. In 2011, was appointed Deputy General Manager, Chemicals, and Deputy General Manager, Petrochemicals. In 2012, became President, Refining & Chemicals and a member of the Group’s Executive Committee;
• Became CEO of TOTAL in 2014, and was appointed as Chairman of the Board of Directors in 2015; • Member of the Strategy and
Investments Committee, since 2017. Source: TOTAL’s Registration Document 2018
The Executive Commission
The Executive Committee, under the responsibility of the CEO, Mr. Patrick Pouyanné as referred above, is the decision-making body of the Group.
It implements the strategy formulated by the Board of Directors and authorizes related investments, subject to the approval of the Board of Directors for investments exceeding 3% of the Group’s equity or notification of the Board for investments exceeding 1% of equity.
As of August 2019, the members of TOTAL’s Executive Committee were as follows: • Patrick Pouyanné, Chairman and CEO;
• Jean-Pierre Sbraire, CFO;
• Arnaud Breuillac, President, Exploration & Production; • Philippe Sauquet, President, Gas, Renewables & Power; • Bernard Pinatel, President, Refining & Chemicals; • Momar Nguer, President, Marketing & Services;
• Namita Shah, President, People & Social Responsibility; • Helle Kristoffersen, President, Strategy & Innovation.
Besides the Executive Committee members large experience in the industry,
the executive compensation scheme is a strong tool to encourage the strategy implementation success and the value delivery.
For instance, the CEO and Chairman compensation results from a fixed component plus a variable component and in-kind benefits. The long-term commitment is addressed by granting an additional package of stock options and performance shares (Figure 20).
The variable component from the compensation scheme is set to a theoretical maximum of 180% the fixed component, contingent to a set of qualitative criteria and quantitative targets (Figure 21)
TOTAL’s management has a track record of consistently delivering the targeted
strategic objectives over the years (Appendix 11).
Sustainability and ESG metrics
TOTAL management is committed to contributing to the United Nations (“UN”)
Sustainable Development Goals (“SGDs”), by adopting UN’s recommendations for
a set of business-related SGDs where it can have a more active contribution, such as decent work, human rights, climate change and access to energy.
As recognition of TOTAL’s active role in the sustainability matters, its shares are included in the FTSE4Good Index since 2001 and in the Dow Jones Sustainability
World Index since 2004.
Regarding standard ESG metrics and comparing to its peers9, TOTAL practices are
aligned with the industry, with a median ISS Governance Quality Score, of 410 out
of 10, and a slightly above the industry median of Bloomberg's ESG Disclosure
Score, of 6011 out of 100 (Figure 22).
9 Industries peers: ExxonMobil, Royal Dutch Shell, BP and Chevron (Appendix 36). 10 A score of 1 indicates lower governance risk, while a 10 indicates higher governance risk. 11 Measure of information transparency. The more information disclosed, the higher the score.
Figure 20 – Mr. Patrick Pouyanné compensation (€M)*
*Amounts due for 2018FY for fixed, variable and in-kind benefits (variable compensation to be paid in 2019). Accounting valuation of the performance shares granted during 2018FY. Source: TOTAL’s Registration Document 2018
Figure 21 – Mr. Patrick Pouyanné variable compensation scheme*
*As a percentage of the FY2018 fixed compensation.
Source: TOTAL’s Registration Document 2018
Figure 22 – ESG metrics
8
4. Industry Overview and Competitive Positioning
World Economic Outlook
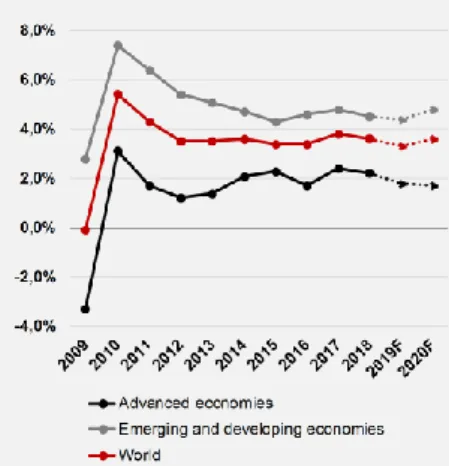
World GDP Growth
Global economy is currently pronouncing a slowdown. After a sustainable recovery from 2009’s crises, with an annual average growth of 3.8% from 2010 to 2018, the latest IMF forecast for 2019 stays at 3.3% growth. This inversion is driven by the mutual imposition of tariffs between US and PRC commercial trades, the uncertainty related to Brexit development and the rising of geopolitical tensions. The projected growth pickup in 2020 and following years, at 3.6% flat, is precarious, presuming stabilization in currently stressed emerging market and developing economies and progress toward resolving trade policy differences, including those between the UK and the EU and the free trade area encompassing Canada, Mexico, and the US (Figure 23) (Appendix 12).
World Population
World population rose at a 1.15% CAGR for the last 10 years, from 6,732 million in 2009 to 7,462 million in 2018. It is expected that population growth keeps stable in
the following years, at a 1.1% annual growth rate, reaching the 7,545 million in
2019F and 7,627 million people in 2020F (Figure 24) (Appendix 12).
World Energy Demand
Global energy demand is expected to reach 365 mboe/d in 2040, meaning an
increase of 91 mboe/d from 2015, when it counts 274 mboe/d. This figures a global
average annual growth of 1.2% p.a. Different growth rates are expected for different world regions due to different population and economic growth (Figure 25).
In terms of energy mix, it is expected that Natural Gas has the largest estimated
demand growth, increasing by almost 32 mboe/d between 2015 and 2040, an
annual average growth rate of 1.7%. Consequently, the share of Natural Gas in the global energy mix is expected to rise 3.3 percentage points, from 21.7% in 2015 to 25% in 2040.
‘Other renewables’, mainly wind and solar, are projected to have the highest average growth rate of around 7.4% p.a. during the forecast period. Nevertheless,
due to the current low starting point, the increase in absolute terms is estimated at around 19 mboe/d between 2015 and 2040.
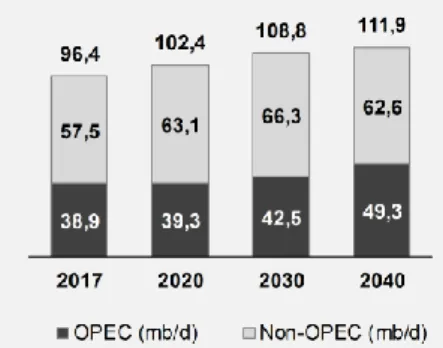
Oil is expected to remain the largest contributor to the energy mix throughout the forecast period, with a share of nearly 28% in 2040. Long-term oil demand is
expected to increase by 15 mb/d, rising from 97.2 mb/d in 2017 to 111.7 mb/d in
2040, but growth decelerates over time (Figure 26).
Despite relatively low demand growth rates, fossil fuels are projected to remain
the dominant component in the global energy mix, with a share of 75% in 2040,
despite a 6 percentage points decreasing from 2015 (Appendix 13).
Global Oil Supply
Total non-OPEC liquids supply is expected to rise from 57.5 mb/d in 2017 to
66.1 mb/d in 2023, of which 5.6 mb/d or 65% is in the US due to tight oil’s production
increasing. In addition to the US, only a handful of other countries are forecast to drive non-OPEC medium-term supply growth, including Brazil (+1.4 mb/d), Canada (+0.8 mb/d) and Kazakhstan (+0.3 mb/d). Non-OPEC liquids supply is projected
to peak in the late 2020s, as US tight oil supply peaks.
Figure 23 – World GDP real growth (Annual percent change)
Source: IMF (2019)
Figure 24 – World population (Millions of people)
Source: IMF (2019)
Figure 25 – Global primary energy demand by region (mboe/d)
Source: World Oil Outlook 2040, OPEC 2018
Figure 26 – Global primary energy demand by fuel type (mboe/d)
Source: World Oil Outlook 2040, OPEC 2018
OPEC crude supply is expected to decline from 32.6 mb/d in 2017 to 31.6 mb/d in 2023. Thereafter, after the decline in non-OPEC liquids supply, coupled with moderate, but sustained global demand growth, leads to a steady increase in
OPEC crude supply, which rises to almost 50 mb/d by 2040 (Figure 27).
Crude Oil Price
Crude oil price is a source of uncertainty around the Oil & Gas industry. Its volatility is due to many factors, such as World economic growth expectations and geopolitical tensions.
The crude oil prices recovery from 2008 World financial crises, when Brent went from a maximum $133.9/b in 07M2008 to $41.6/b in 12M2008, until the mid-2014, driven by growing demand of emerging economies (e.g. China, Brazil, India and Russia) and supply instability due to the Arab Spring.
In 2014, a new collapse was felt, when Brent went from a maximum $111.9/b in 06M2014 to $62.3/b in 12M2014, due to the economic slowdown of the same economies and the Saudi Arabia geopolitical agenda – Saudi Arabia expected that letting crude oil prices fall would be more benefit in the long-term, by forcing countries such as the U.S. and Canada to abandon their more costly production methods due to lack of profitability.
In response to the prices fall, OPEC decided to cut its production, what supported the crude oil price uprising until 2018Q4 (Appendix 14).
In the latter 2018, crude oil prices dropped again. After a registered a 33 months
maximum with Brent quoting at $80.5/b in 10M2018, prices fall to a 15 months
minimum of $56.5/b in 2018YE. Already in 2019, Brent quotation registered a
recovery until April, with a price of $71.2/b, and then turn back to the downward trend, quoting at $63.0/b in 06M2019. This downward trend since 4Q2018 is due to a weaker economic sentiment about global growth, and uncertainty about
ongoing trade disputes between major economic powers and a disorderly Brexit, that could lead to a reduction in the rate of growth of international trade and oil demand (Figure 28).
Recent crude oil price forecasts12 put Brent at annual average of $64/b for 2019 and
$65/b to 2020 (Figure 29).
Global Oil & Gas Industry Overview
Industry Structure
Oil & Gas industry includes the global processes of exploration and extraction –
Upstream activities – transportation and trading – Midstream activities – as well as refining and marketing of finished products – Downstream activities (Appendix 5). The market is structured in an Oligopoly, composed by a small set of large players (e.g. Integrated Oil Companies) that influence the direction of the market and by a group of small companies conditioned by them (e.g. Independent operators). Oil & Gas industry is at a mature stage on its life cycle, with business cycles
ranging between 7 and 9 years (Figure 30).
12 Source: EIA Short-Term Energy Outlook (August 2019)
Figure 28 – Brent 52-week evolution ($/b)
Source: Bloomberg
Figure 27 – Global Oil supply by region (mb/d)
Source: World Oil Outlook 2040, OPEC 2018
Figure 29 – Brent price forecast (annual average $/b)
Source: EIA Short-Term Energy Outlook (August 2019)
Figure 30 – Oil & Gas industry business cycle
10
M&A Activity
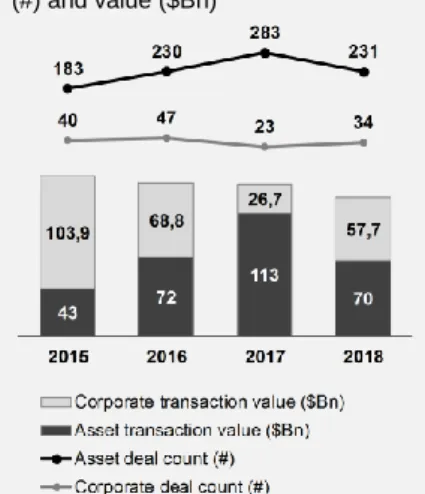
Consolidation through M&A remains a key strategy for competitive advantage,
being a route to scale, focus, and cost control, strengthening companies across economic and commodity cycles. In addition to enterprise M&A operations, the major IOC also perform asset rotation13 and strategic divestures to rebalance their
portfolio, with lower break-even assets, and create value while recycling capital. Typically, these sells are made to large private equity-backed independents, such as TOTAL’s sale of operated and non-operated upstream assets in the UK North Sea to Petrogas (the E&P arm of the Oman-based conglomerate MB Holding) and its private equity partner HitecVision, in as transaction of $635M on July 2019. Nevertheless, global upstream deal count decreased 14% in 2018, to a
three-year low, with the decline exacerbated by oil price downfall during the 4Q2018, and
the global upstream M&A transaction value correspondingly fell by 9% to $128Bn (Figure 31). These numbers also represent a six-year minimum, since the 20-year peak of 2012 (Appendix 9).
Industry Trends
Technological advancements around the industry will continue to evolve and provide a broader future energy landscape, i) expanding the frontiers of Upstream exploration and ii) focusing in the concerns around global warming, accelerating the development of energy paths toward lower emissions.
Upstream exploration
Recent technological developments, mainly related to the tight oil exploration allowed the exploration of previously inaccessible or economic unviable reserves, namely seismic survey, hydraulic fracturing and directional drilling.
Additionally, to further explore already developed reserves, enhanced oil recovery
(EOR) technology allow to increase exploration sites lifespan of mature oil and gas
fields.
Power generation and power storage
Natural Gas, the far least CO2-emitting fossil-fuel source, has an increasing role in
power generation, being able to replace coal in some regions, contributing to CO2 emissions reduction. This offset, more than ecological motivations, is due to financial reasons, i.e. i) cheap and abundant resources provided mainly by US shale gas
boom and ii) Combined-Cycle Gas Turbine (CCGT) is the most efficient
technology used in for large power plants reaching 62.2% net efficiency (the current world best).
Nevertheless, renewables sources14 will increase their role in the strategy to
reduce Greenhouse Gas (GHG) emissions (Figure 32). In fact, substantial advances have been achieved, mainly in wind and solar generation, allowing these technologies to be competitive by driving down the power generation costs faster than expected. Wind turbines, for example, have expanded the range of wind speeds that can be accommodated, both for low-speed and high-speed wind. In appropriate areas – mainly near-coastal or offshore – a capacity factor of nearly 50% can be achieved. In the case of solar, the efficiency of photovoltaic (PV) cells is constantly increasing while their production costs have undergone a steep decline over the past 10–15 years. It can be expected that the costs of wind and solar power will decline
13 Typically, these transactions involve the company selling minority or majority stakes from assets or
projects that tend to be mature and operationally efficient. These assets are, therefore, very attractive to investors due to their low risk profile and stable cash-flows.
14 Wind, solar and others (not including hydro and biomass).
Figure 31 – Upstream global deal count (#) and value ($Bn)
Source: IHS Markit M&A Database 2019
Figure 32 – Wind, solar and other renewables weight in primary energy sources
Source: World Oil Outlook 2040, OPEC 2018
further in the foreseeable future. However, the most serious drawback for these technologies is the disadvantage of a limited (in the case of wind) or non-existent baseload capability (in the case of solar).
This disadvantage of renewable is somehow offset by power storage technological development, which may capture and later reproduce power at the required cost and capacity level. However, given current and near-future battery technology – mainly lithium-ion – competitive large-scale power storage seems to be very unlikely when compared to fossil-fuel back-up plants.
Energy Transition and Electrification
The Energy Transition pathway toward the transformation of the global energy sector from fossil-based energy to low/zero-carbon technologies is unstoppable, with companies evolving and adapting their business models to meet this trend.
The ongoing, and at least already partially successful, introduction of electric
vehicles (EV) as a complement to the internal combustion engine (ICE) is an
important development for the energy market, although in many aspects ICE still have substantial potential for further developments. In this field, it is expected that EV, including battery electric and plug-in hybrid electric vehicles (PHEV), experience a significant growth to achieve a 36% of passenger fleet share in 2040. Both natural gas passenger cars and fuel cell vehicles (FCV) are not expected to witness the same growth and tend to maintain as a niche market (Figure 33).
Carbon Capture, Use and Storage
Even with a considerable up-scaling of the use of renewables for power generation fossil fuels will remain essential to satisfy the world’s energy demand in a reliable and secure way. To reduce GHG emissions, and to comply with the Paris Agreement, carbon capture and storage (CCS), as well as carbon capture and
utilization (CCU), has garnered more space in public discussion as a mean to avoid
the direct release of CO2.
Some oil and gas producers have had positive experiences with re-injecting CO2 into oil wells, which suggests that CCS is a safe and technically viable strategy. However, for geological and political reasons, CCS is likely to remain applicable only in certain locations.
Oil & Gas Key Drivers of Profitability
Commodities price is the Oil & Gas industry most relevant profitability driver,
impacting directly the company’s profitability (Figure 34 and Appendix 15). Additionally, this is also the most difficult driver to manage, because it results from the match of supply and demand formed in the market, where no individual player has the direct ability to affect. Given this, companies can only act over it by taking long-term contracts or developing a hedging strategy with derivatives. In addition, commodities price dictates which rigs are profitable, conditioning CAPEX and production volume and stating the importance of rig portfolio management.
Nevertheless, to be profitable and create value, companies can lever other value drivers along the value chain, such as refinery yield, refining flexibility and
margin, among others.
Major players in the Oil & Gas industry also add enterprise value through synergies
capture over the value chain (Appendix 6 and Appendix 7), through vertical
integration, and focused M&A strategy (Appendix 9).
Figure 34 – TOTAL price vs. Brent evolution (Base year analysis)
Source: Author analysis
Figure 33 – Share of new passenger car sales by powertrain (%)
Source: World Oil Outlook 2040, OPEC 2018
12
Competitive Positioning
Peers identification
Several financial agencies have industry classification systems that can be used to identify industry peers.
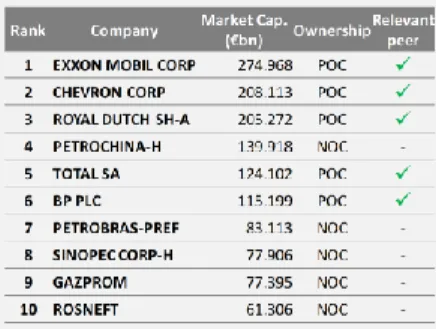
The BICS classification from Bloomberg cluster companies according to their business and value chain activities. The major Oil & Gas companies, that operate along the value chain, are classified as “Integrated Oils”.
Beyond the industry classification and operating model, the peer group should consider companies with the same characteristics. Considering the market
capitalization and the ownership type, it is possible to select the most similar peer group that include 5 companies: Exxon Mobil, Chevron, Royal Dutch Shell, TOTAL and BP (Figure 35 and Appendix 36).
Peers strategy
Given the short-term uncertainty around global economy, companies tend to maintain capital discipline, focus on productivity improvements and applying
new technology. In the long term, they need to apply a critical portfolio management, to make them profitable against low commodities prices environements and adapt to a low carbon world.
SWOT Analysis
Figure 36 – SWOT analysis
Source: Author analysis
Figure 35 – BICS Integrated Oils ranked by market cap (€M)
Source: Bloomberg (August 2019) and Author analysis
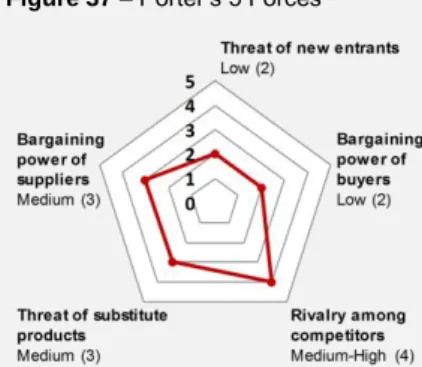
Porter’s 5 Forces
Considering the Porter’s 5 Forces Framework, the highest threat in the industry is the rivalry among existing competitors (Figure 37).
Threat of new entrants | LOW (2)
The threat of newcomers into the industry is relatively low, given the following factors: • Restrictive government policies and competitive processes to obtain
production licensing, which stands for long term and protect the current
players;
• Need of high capital requirements (WC and CAPEX), in all stages of the value chain, from Exploration (where investments do not have a guaranteed success) to Refining (with large scale facilities) and R&D (for new technology e new products);
• Need of large economies of scale, being necessary a high level of production to reach the break-even and dilute the infrastructure fixed costs; • Difficult access to distribution channels, dominated by major companies
that are vertically integrated, operating in almost every stage of the value chain; and,
• Expected retaliation from actual players, with substantial financial resources to overcome almost any strategy from newcomers, and with a track record of M&A processes over smaller players.
Bargaining power of suppliers | MEDIUM (3)
Given that the major players in the industry are vertically integrated throughout the value chain, the most relevant suppliers are oil producer countries, because of the following factors:
• States detain the power to allocate the exploration and production
licensing;
• There are no alternative substitute products;
• Oil producer countries cartelization, with OPEC having a major market
share (Figure 38); and,
• Oil producer countries might integrate forward in the value chain, creating a NOC to explore their own national resources.
Although this is the powerful side of the negotiation, some factors might offset this power, such as:
• Disruption in cartel organization (e.g. Qatar terminated its membership on January 2019, due to a political divergence with Saudi Arabia);
• Political tension and economic sanctions (e.g. Syria and Iran); and • Many countries heavily depend on oil exportation for financial stability.
Bargaining power of buyers | LOW (2)
Bargaining power of buyers is relatively small, by the following factors:
• Vertical integration over the value chain and cartelization within the industry gives companies a higher bargaining power than its customers;
Figure 37 – Porter’s 5 Forces
Source: Michael E. Porter framework; Author analysis
Figure 38 – OPEC supply market share (%, 2017)
Source: World Oil Outlook 2040, OPEC 2018
14
• Massive group of different kinds of buyers, comprising since single customers (e.g. refined products), to industries (e.g. petrochemical) and state companies/incumbents (e.g. gas contracts);
• Price determined in the market (match of supply and demand), being the three main quotations the Brent Blend, the West Texas Intermediate, and the Dubai/Oman;
• Buyers are not price sensitive, given that there is no viable solution to massive alternative product substitution; and,
• High costumer switching costs, because changing from oil or gas, and other petrochemical or derivatives, to another source of energy is expansive and only possible in the long run.
Threat of substitute products or services | MEDIUM (3)
The actual threat of substitute products is relatively low, given that:
• No viable solution to massive substitution of plastic and most of
petrochemicals;
• Other current sources of energy tend to lose importance in global
energy mix, for environmental (e.g. coal is the dirtiest source of energy in
CO2 emissions) and political reasons (e.g. reduction of nuclear mix in France, to 50% in 2035); and,
• Alternative sources only offset the rising demand for energy, doesn’t being expected to substitute hydrocarbons in the short and mid-term. Despite this, the threat of substitute products tends to rise in the mid-term and long-term, with the search and development of alternative fuels (e.g. ethanol from Brazil) and expansion of renewable energy production (e.g. wind and solar).
Rivalry among existing competitors | MEDIUM-HIGH (4)
Being this industry a mature oligopoly, there is a medium-high intensity of rivalry, given that:
• There are many players, and some of them are roughly equal in size and
power (e.g. top 5 POC) (Figure 39);
• Industry is slightly growing (Figure 40), so players must fight for
additional market share;
• NOC might not act based on economic rationality and instead pursue a political agenda;
• Final products have minor or no differentiation; and,
• High exit barriers due to decommissioning costs of production stoppage (e.g. costs of shut down a well or to abandon a refinery).
Although the previous factors, some characteristics of the industry partially offset the competition level, such as:
• Players do not compete on price, which is formed in the market by supply and demand match; and,
• Players try to differentiate on brand and services delivered.
Figure 39 – IOC peer group Total Assets (€M, 2018YE)
Source: Bloomberg
Figure 40 – Long-term Oil demand growth rates (% p.a.)
Source: World Oil Outlook 2040, OPEC 2018