R E S E A R C H A R T I C L E
Open Access
CRABP1, C1QL1 and LCN2 are biomarkers of
differentiated thyroid carcinoma, and
predict extrathyroidal extension
Ricardo Celestino
1,2,3,4, Torfinn Nome
3,5, Ana Pestana
1,2,6, Andreas M. Hoff
3,5, A. Pedro Gonçalves
1,6,7,
Luísa Pereira
1,2, Bruno Cavadas
1,2, Catarina Eloy
1,2, Trine Bjøro
8,9, Manuel Sobrinho-Simões
1,2,10,11,
Rolf I. Skotheim
3,5*and Paula Soares
1,2,10*Abstract
Background: The prognostic variability of thyroid carcinomas has led to the search for accurate biomarkers at the molecular level. Follicular thyroid carcinoma (FTC) is a typical example of differentiated thyroid carcinomas (DTC) in which challenges are faced in the differential diagnosis.
Methods: We used high-throughput paired-end RNA sequencing technology to study four cases of FTC with different degree of capsular invasion: two minimally invasive (mFTC) and two widely invasive FTC (wFTC). We searched by genes differentially expressed between mFTC and wFTC, in an attempt to find biomarkers of thyroid cancer diagnosis and/or progression. Selected biomarkers were validated by real-time quantitative PCR in 137 frozen thyroid samples and in an independent dataset (TCGA), evaluating the diagnostic and the prognostic performance of the candidate biomarkers. Results: We identified 17 genes significantly differentially expressed between mFTC and wFTC. C1QL1, LCN2, CRABP1 and CILP were differentially expressed in DTC in comparison with normal thyroid tissues. LCN2 and CRABP1 were also differentially expressed in DTC when compared with follicular thyroid adenoma. Additionally, overexpression of LCN2 and C1QL1 were found to be independent predictors of extrathyroidal extension in DTC.
Conclusions: We conclude that the underexpression of CRABP1 and the overexpression of LCN2 may be useful diagnostic biomarkers in thyroid tumours with questionable malignity, and the overexpression of LCN2 and C1QL1 may be useful for prognostic purposes.
Keywords: CRABP1, CILP, C1QL1, LCN2, Cancer, Thyroid, Biomarker, TCGA, RNA sequencing, Gene expression
Background
Thyroid cancer is the most frequent type of endocrine cancer with an incidence of 12 cases per 100,000 indi-viduals [1, 2]. More than 95% of thyroid cancer cases originate from follicular epithelial cells [3]. Papillary thy-roid carcinoma (PTC) and follicular thythy-roid carcinoma (FTC) are the most common histotypes. Despite the overall good prognosis of these two main histotypes of differentiated thyroid carcinoma (DTC) [1], some cases
progress, develop distant metastases and acquire an un-predictable response to treatment.
The increasing incidence of thyroid cancer has led to the search for good biomarkers that can help in the diagnosis of malignancy and/or predict the clinical behaviour of the tumours. Until now, clinical and histopathological prog-nostic factors remain the only robust elements to be used for diagnosis and prognosis of patients with thyroid tu-mours [4], although new markers are revealing some diag-nostic or progdiag-nostic value per se. As an example, BRAF mutations have been shown to be useful for predicting re-currence and/or disease persistence [5], but mostly when associated with other clinicopathological features. Recently, TERT promoter mutations revealed an independent
* Correspondence:[email protected];[email protected] 3Department of Molecular Oncology, Institute for Cancer Research, Norwegian Radium Hospital, Oslo University Hospital, P.O.Box 4953 Nydalen, 0424 Oslo, Norway
1i3S - Instituto de Investigação e Inovação em Saúde, Universidade do Porto, Rua Alfredo Allen, 208, 4200-135 Porto, Portugal
Full list of author information is available at the end of the article
© The Author(s). 2018 Open Access This article is distributed under the terms of the Creative Commons Attribution 4.0 International License (http://creativecommons.org/licenses/by/4.0/), which permits unrestricted use, distribution, and reproduction in any medium, provided you give appropriate credit to the original author(s) and the source, provide a link to the Creative Commons license, and indicate if changes were made. The Creative Commons Public Domain Dedication waiver (http://creativecommons.org/publicdomain/zero/1.0/) applies to the data made available in this article, unless otherwise stated.
prognostic value regarding distant metastasis and survival of patients with thyroid cancer [5].
The classification of benign and malignant thyroid tu-mours at the histological level still has limitations. Many follicular patterned tumours are typical examples of this difficulty. The classical histological criterion to distin-guish FTC from follicular thyroid adenoma (FTA) is the presence of any image of capsular or vascular invasion [6]. This circumstance limits the diagnostic accuracy of fine needle aspiration biopsy (FNAB) in pre-surgical grounds. FTC is subclassified into minimally invasive FTC (mFTC) and widely invasive FTC (wFTC) [3], with the latter having a worse prognosis than mFTC [3, 7, 8]. The molecular mechanisms that orchestrate the inva-siveness of FTC cancer cells are poorly understood.
In order to identify molecular alterations associated to thyroid cancer invasion, we used FTC as a model of an encapsulated tumour, studying tumours with different degrees of invasion: two mFTC and two wFTC, using high-throughput paired-end RNA sequencing (RNA-seq) technology. The biomarkers proposed here were vali-dated in a series of DTC, in thyroid cancer cell lines and in the gene expression data from DTC available in The Cancer Genome Atlas (TCGA) [9].
Methods
Thyroid cancer samples and cell lines
Two wFTC (cases 1 and 2) and two mFTC (cases 3 and 4) were collected from tumour tissue biobank (Porto). These four tumours from patients with 55–82 years of age were subjected to high-throughput paired-end RNA-seq analyses. Briefly, the patient/case 1 had a tumour measuring 2 cm in diameter and presenting a predomin-ant follicular growth pattern and oncocytic features; pa-tient/case 2 had a tumour measuring 5 cm in diameter and presenting a predominant solid/trabecular growth pattern; patient/case 3 had a tumour measuring 3.7 cm in diameter and presenting a follicular growth pattern; and patient/case 4 had a tumour measuring 4 cm in diameter and presenting a follicular growth pattern.
For comparative and validation purposes, 137 frozen thyroid samples were collected from tumour tissue bio-bank (Porto): 98 DTC [15 FTC (including the four used in RNAseq), 23 follicular variant of PTC (FVPTC) and 60 PTC], 20 FTA, and 19 normal samples of adjacent/ contralateral thyroid tissues from patients with DTC from this series. The histology of all DTC was revised by two pathologists (CE and MSS) and the final classifica-tion was made according to the WHO criteria [3]. The clinicopathological features and genetic alterations of the DTC are presented in Table 1, and a briefly description of the series is available in the Additional file 1. Further-more, ten thyroid cancer cell lines were also used in this study including one cell line derived from one FTC with
oncocytic pattern (XTC1), three derived from PTC (BCPAP, K1 and TPC1), and six derived from undiffer-entiated thyroid carcinoma (C643, HTH74, KAT4, T238, T241, 8505C).
High-throughput paired-end RNA-seq
Library construction was performed using the TruSeq RNA Sample Prep Kit v2 according to protocol (Illumina Inc., San Diego, CA, USA), including poly-A mRNA isola-tion, fragmentaisola-tion, and gel-based size selection. Shearing to about 250 bp fragments was achieved using the Covaris S2 focused-ultrasonicator (Covaris Inc., Woburn, MA, USA). Sequencing was performed according to the paired-end RNA-seq protocols from Illumina for Solexa sequen-cing on a Genome Analyzer IIx with paired-end module (Illumina Inc). Seventy-six bps were sequenced, from each side of a fragment of about 250 bp long.
A particular attention was paid to genes differentially expressed between mFTC and wFTC. Reads marked by the Illumina pipeline (Bustard.py, OLB 1.6.0 and 1.8.0) as passed filtering were used in the analysis.
Gene expression levels in FTCs were computed by using Cufflinks v1.1.0 [10] with the Illumina iGenomes Ensembl GRCh37 data set (2011–06-20) as reference, on reads aligned with TopHat v1.3.3 [11]. Gene expression levels were compared between the two wFTC (case 1 and 2) and two mFTC (case 3 and 4). Results were rep-resented as fold change of gene expression in wFTC comparing with mFTC. Values of fold change in gene expression were at logarithmic scale (log2). Genes and transcripts were considered differentially expressed be-tween mFTC and wFTC whenever Q value <0.05.
Isolation of nucleic acids, reverse-transcription PCR and cDNA sanger sequencing
Frozen tissue samples available from thyroid tumours (n = 118) and adjacent/collateral normal thyroid tissues (n = 19) were crushed and homogenized. Total RNA from tissues and thyroid cancer derived cell lines was ex-tracted using TRIzol® Reagent (Ambion®, Life Technolo-gies™, CA, USA), according to the manufacturer’s protocol. Genomic DNA was extracted using the Gen-omic DNA Purification Kit (Citomed, Lisbon, Portugal) according to the manufacturer’s protocol.
cDNA was synthesized from 1μg of RNA at 42 °C for 60 min, using oligo (dT) primers and M-MuLV reverse transcriptase (Fermentas, Thermo Scientific, St. Leon-Rot, Germany). The reverse-transcription PCR (RT-PCR) prod-ucts were analysed by cDNA Sanger sequencing using the Big Dye terminator version 3.1 cycle (Applied Biosystems, Foster City, CA, USA). The samples were analysed in an automated sequencing machine (ABI Prism 3100 Genetic Analyser, Applied Biosystems, Foster City, CA, USA).
Screening forPAX8/PPARG, RET/PTC1 and RET/PTC3 rearrangements,BRAF and NRAS mutations, and TERT promoter mutations in thyroid cancer series
The 98 DTC were further characterized for selected mo-lecular alterations known to be common in thyroid
tumours. PCR followed by Sanger sequencing was used on genomic DNA for detecting mutations in the most frequent hotspot regions of BRAF (exon 15), NRAS (exon 2), and promoter region of TERT, according to previously described procedures [12, 13]. In our previous
Table 1 Clinicopathological and molecular data of patients with differentiated thyroid cancer (DTC) included in the study
Total FTC FVPTC PTC Total (%) 98 (100) 15 (15.3) 23 (23.5) 60 (61.2) Age (n) 98 15 23 60 Mean (years) 43 ± 1.6 53 ± 3.9 43 ± 3.1 40 ± 2.1 Tumour size (n) 93 15 22 56 Mean (cm) 2.8 ± 0.18 3.9 ± 0.46 2.4 ± 0.30 2.7 ± 0.24 Gender (n) 98 15 23 60 Female (%) 84 (85.7) 12 (80) 19 (82.6) 53 (88.3) Male (%) 14 (14.3) 3 (20) 4 (17.4) 7 (11.7) Capsule (n) 88 15 21 52 Positive (%) 45 (51.1) 15 (100) 9 (42.9) 21 (40.4) Capsular invasion (n) 42 15 8 19 Positive (%) 27 (64.3) 15 (100) 2 (25.0) 10 (52.6) Vascular invasion (n) 89 15 21 53 Positive (%) 48 (53.9) 11 (73) 5 (23.8) 32 (60.4)
Lymph node metastasis (n) 93 15 21 57
Positive (%) 24 (25.8) – 4 (19.0) 20 (35.1) Extrathyroidal extension (n) 88 15 21 52 Positive (%) 27 (30.7) 1 (6.67) 2 (9.52) 24 (46.2) Distant metastasis (n) 93 15 21 57 Positive (%) 5 (5.38) 1 (6.67) – 4 (7.02) Lymphocytic thyroiditis (n) 91 15 22 54 Positive (%) 40 (44.0) 4 (26.7) 8 (36.4) 28 (51.9) Oncocytic (n) 89 15 21 53 Positive (%) 17 (19.1) 6 (40.0) – 11 (20.8) PAX8-PPARG rearrangements (n) 98 15 23 60 Positive (%) 2 (2.04) 1 (6.67) 1 (4.35) – RET/PTC rearrangements (n) 98 15 23 60 Positive (%) 17 (17.3) 1 (6.67) 3 (13.0) 13 (21.7) RET/PTC1 rearrangement (n) 98 15 23 60 Positive (%) 12 (12.2) 1 (6.67) 1 (4.35) 10 (16.7) RET/PTC3 rearrangement (n) 98 15 23 60 Positive (%) 2 (2.04) – 1 (4.35) 1 (1.67) BRAF mutation (n) 98 15 23 60 Positive (%) 21 (21.4) – 2 (8.70) 19 (31.7) NRAS mutation (n) 98 15 23 60 Positive (%) 16 (16.3) 5 (33.3) 5 (21.7) 6 (10.0)
TERT promoter mutation (n) 98 15 23 60
Positive (%) 3 (3.06) 2 (13.3) 1 (4.35) –
n, number of cases with available data
works we verified that HRAS and KRAS mutations were very rare (or absent) events. For that reason, we only screened mutations for NRAS gene.
The presence of PAX8-PPARG and RET/PTC rearrange-ments were determined by RT-PCR followed by Sanger sequencing of PCR products. Some positive cases were confirmed by fluorescence in situ hybridisation (FISH), following the procedures described previously [12].
Real-time quantitative reverse transcription PCR
Real-time quantitative PCR (qPCR) for C1QL1, LCN2, IL22RA1, MAMDC2, CILP, ASXL3, CRABP1, and SCUBE3genes was performed in the two wFTC (cases 1 and 2) and two mFTC (cases 3 and 4) used in paired-end RNA-seq, and their corresponding normal thyroid tissue. qPCR for C1QL1, LCN2, CILP, and CRABP1 were also performed in the remaining series of DTC, in FTA and in normal thyroid tissues, as well as in thyroid can-cer cell lines.
cDNA was amplified for the C1QL1, LCN2, IL22RA1, MAMDC2, CILP, ASXL3, CRABP1, and SCUBE3 by qPCR using SYBR® Green PCR Master Mix (Applied Biosystems, Foster City, CA, USA). A qPCR assay target-ing Hypoxanthine phosphoribosyltransferase 1 (HPRT) was used as the housekeeping control. Primer sequences are available on request. Expression levels were obtained as the average cycle threshold (CT) of at least two rep-licas. A CT = 35 was assigned for target genes that were not expressed in samples with positive expression of the housekeeping control gene (HPRT).
The relative quantification of target genes was deter-mined using the comparative CT method (2-ΔΔCT) which was previously validated by Livak’s Linear Regression Method (Sequence Detector User Bulletin 2; Applied Bio-systems) [14]. This provided the fold changes (2-ΔΔCT) in gene expression normalized to an internal control gene (HPRT), and relative to one pool of normal thyroid tissues (calibrator). Expression values (2-ΔΔCT) were normalized at logarithmic scale (log2). For C1QL1 and LCN2 genes, fold change [log2 (2-ΔΔCT)] > 1 was considered as gain of expression, and fold change [log2 (2-ΔΔCT)]≤ 1 was estab-lished as normal gene expression. For CRABP1 and CILP genes, fold change [log2 (2-ΔΔCT)] <−1 was considered as loss of expression, and fold change [log2 (2-ΔΔCT)]≥ −1 was established as normal gene expression. The diagnostic performance (sensitivity and specificity) of those cut-off values are presented in Table 2.
Data from the cancer genomic atlas (TCGA)
RNASeq (version v2) information were extracted from TCGA [15] for 393 DTC and 59 thyroid normal samples, for C1QL1, LCN2, CRABP1 and CILP genes. Gene ex-pression values for each sample are normalized read counts, estimated by using RSEM software [16].
Statistical analysis
Statistical analysis was conducted with SPSS version 22.0 (SPSS Inc., Chicago, IL, USA). The results are expressed as percentage or mean ± SE. Statistical analysis was per-formed both on the whole DTC series and on the differ-ent subgroups: FTC, FVPTC and PTC. Receiver Operating Characteristics (ROC) curves for individual biomarkers were generated using log2 (2-ΔΔCT) gene ex-pression values and thyroid tissue type (DTC against normal or FTA) as input. For evaluation of the com-bined biomarker panel, the sum of log2 (2-ΔΔCT) expres-sion values from genes with gain (C1QL1 and LCN2) and loss (CRABP1 and CILP) in DTC were used. Spear-man’s rho test (non-parametric) was used for evaluating the correlation of the expressions between different genes. Fisher’s exact test, t-test (unpaired, two-tailed), Mann–Whitney U test, and ANOVA were used when appropriate. The predictive value of C1QL1, LCN2, CRABP1 and CILP expression as a prognostic factor in thyroid cancer and their correlation with clinicopatho-logical factors– age, tumour size, and extrathyroidal ex-tension were assessed using univariate and multivariate logistic regression models. Test results with P-values <0.05 were considered statistically significant.
Results
Differential gene expression in mFTC and wFTC
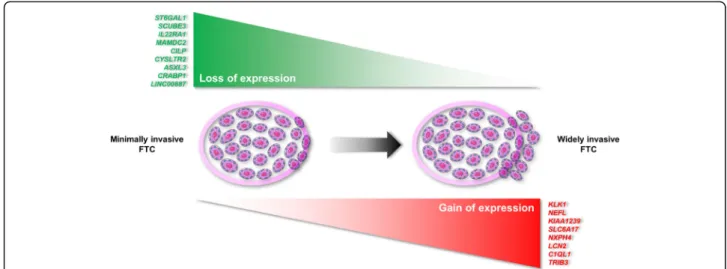
Differential expression analysis of the paired-end RNA-seq data identified 17 genes with significantly differ-ential expression between mFTC and wFTC (Fig. 1, Additional file 2: Table S1 and Additional file 3: Table S2). Increased gene expression of KLK1, NEFL, KIAA1239, SLC6A17, NXPH4, LCN2, C1QL1 and TRIB3, and de-creased gene expression of ST6GAL1, SCUBE3, IL22RA1, MAMDC2, CILP, CYSLTR2, ASXL3, CRABP1 and LINC00887 were observed in wFTC in comparison with mFTC. C1QL1, LCN2, IL22RA1, MAMDC2, CILP, ASXL3, CRABP1, and SCUBE3 genes were selected for validation through a customized filtering based on gene expression in thyroid tumours and normal thyroid tissues datasets [17–19], assessed from Oncomine™ and in the literature available. Validation of expression levels was done in the four FTCs from paired-end RNA-seq and in their matched normal tissue by qPCR. Gain of C1QL1 and LCN2 expres-sion, and loss of IL22RA1, MAMDC2, CILP, ASXL3, CRABP1, and SCUBE3 expression were confirmed in wFTC compared with mFTC and between the four FTC and their respective corresponding normal thyroid tissue (Additional file 4: figure S1). Based on the accuracy of gene expression levels obtained from paired-end RNA-seq and qPCR in the FTC and in the gene expression levels in their normal thyroid tissues by qPCR, C1QL1, LCN2, CRABP1and CILP genes were selected to be tested as bio-markers in a well-characterized series of DTC (Table 1).
Additionally, we identified and experimentally verified a set of 21 fusion transcripts expressed by DTC (Additional file 5: figure S2; Additional file 6: Table S3; Additional file 7: Table S4). However, the fusion tran-scripts are not likely to be biomarkers because they were also detected in normal thyroid tissues. Further details can be found in the Additional file 8.
C1QL1, LCN2, CRABP1, and CILP as biomarkers in DTC
A series of 98 DTC (15 FTC, 23 FVPTC and 60 PTC) and a pool of 19 normal thyroid tissues and 20 FTA were used to evaluate the performance of C1QL1, LCN2, CRABP1, and CILP as biomarkers of DTC. Measure-ments of the expression levels of those genes were done by qPCR. C1QL1, LCN2, CRABP1 and CILP were differ-entially expressed in DTC in comparison with normal thyroid tissues (Additional file 9: figure S3), with statis-tical significance (P = 0.002, P = 0.005, P < 0.001 and P = 0.018, respectively). Notably, such significant differences were also observed for LCN2 and CRABP1 expression when comparing DTC against FTA (P < 0.001 and P =
0.002, respectively), and FTA against normal thyroid tis-sues (P = 0.013 and P = 0.022, respectively).
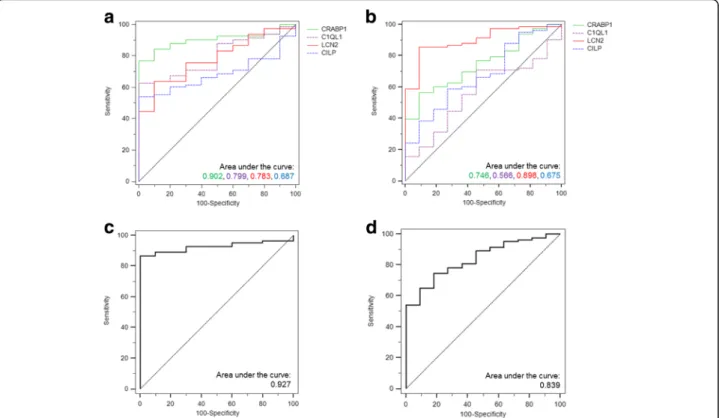
In order to test the aforementioned biomarkers as pu-tative diagnostic tools for thyroid cancer, ROC curves were performed (Fig. 2, Additional file 10: Table S5). In the ROC analysis, comparing DTC versus normal thy-roid (Fig. 2a), the areas under of the ROC curve (AUC) for C1QL1, LCN2, CRABP1 and CILP were 0.799 (P = 2.1E-3), 0.783 (P = 3.6E-3), 0.902 (P = 3.4E-5), and 0.687 (P = 5.5E-2), respectively. When these potential bio-markers were combined in a panel of gene expression, the AUC value was 0.927 (P = 1.1E-5) in DTC versus normal thyroid (Fig. 2c), providing a slight improvement over the AUC results obtained in each individual gene. Comparing DTC with FTA, the AUC values for C1QL1, LCN2, CRABP1 and CILP were 0.566 (P = 4.8E-1), 0.898 (P = 1.9E-5), 0.746 (P = 8.3E-3), and 0.675 (P = 6.1E-2), re-spectively (Fig. 2b). When these potential biomarkers were combined in a panel of gene expression, the AUC value was 0.839 (P = 2.7E-4) in DTC versus FTA (Fig. 2d), not improving the result in comparison with those of the AUC of LCN2 gene. CRABP1 was the best biomarker for
Fig. 1 Differentially expressed genes found between minimally and widely invasive follicular thyroid carcinoma (FTC). Gene expression was measured by high-throughput paired-end RNA sequencing and using statistically significant values (Q < 0.05). Genes with lower expression in widely invasive FTC as compared with minimally invasive FTC are listed at the top of the figure (green). Genes with higher expression in widely invasive FTC as compared with minimally invasive FTC are listed at the bottom of the figure (red). Details of genes, expression levels, statistical values, and molecular function of the genes are found in Additional file 2: Table S1 for differentially expressed genes and in Additional file 3: Table S2 for differentially expressed transcripts
Table 2 Diagnostic performance of potential biomarkers for differentiated thyroid cancer (DTC)
Biomarker Cut-off Sensitivity (%) Specificity (%)
DTC DTC vs normal thyroid DTC vs FTA
C1QL1 >1 62.9 (52.0–72.9) 82.4 (56.6–96.0) 58.8 (33.0–81.5)
LCN2 >1 64.0 (52.9–74.0) 73.3 (44.9–92.1) 83.3 (58.6–96.2)
CRABP1 <−1 84.3 (75.0–91.1) 88.9 (65.3–98.3) 35.7 (12.9–64.8)
CILP <−1 61.4 (50.4–71.6) 66.7 (35.0–89.9) 53.0 (27.9–77.0)
the detection of DTC when tested against normal thyroid. On the other hand, LCN2 was the best biomarker for the detection of DTC when tested against FTA.
We also tested gene expression levels from an add-itional series of 393 DTC and 59 normal thyroid tissues available in TCGA [15]. C1QL1, LCN2 and CRABP1 were differentially expressed in DTC in comparison with normal thyroid tissues (Additional file 11: figure S4), with statistical significance (P < 0.001).
Clinical and molecular associations with gain ofC1QL1 expression
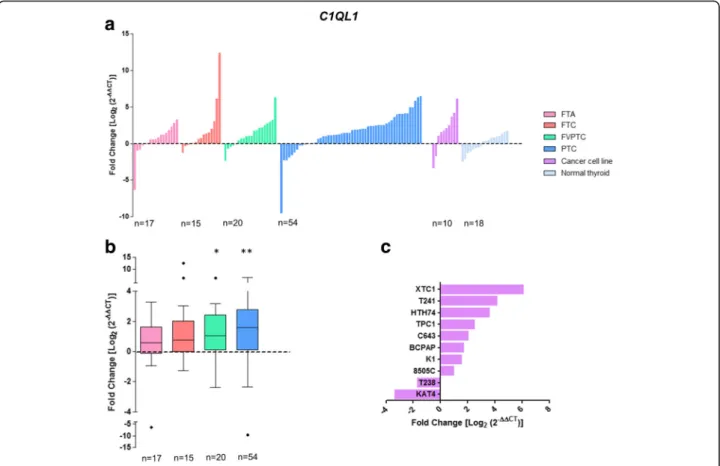
C1QL1 expression levels were successful measured by qPCR in 89 DTC (15 FTC, 20 FVPTC and 54 PTC), 10 thyroid cancer cell lines, 17 FTA, and 18 matched thy-roid normal tissues (Fig. 3a). Gain of C1QL1 expression in relation to thyroid normal tissues was found in FTC, FVPTC and PTC (Fig. 3b), but the differences only achieved the threshold of statistical significance in FVPTC (P = 0.015) and PTC (P = 0.001). Additionally, eight out of ten (80%) thyroid cancer cell lines showed gain of C1QL1 expression (Fig. 3c). Gain of C1QL1 ex-pression was significantly associated with extrathyroidal
extension (P = 0.003) and lymphocytic thyroiditis (P = 0.003) in the DTC samples (Table 3). All the cases with BRAF mutations present gain of C1QL1 expression (P < 0.001). In FTC, gain of C1QL1 expression was present in 71% of wFTC and absent in mFTC (P = 0.007; Additional file 12: Table S6), and lymphocytic thyroiditis was only present in FTC with gain of C1QL1 expression (P = 0.026). In FVPTC, absence of NRAS mutations was significantly associated to the gain of C1QL1 expression (P = 0.014; Additional file 13: Table S7). PTC with C1QL1 gain were significantly lar-ger (2.96 ± 0.33 cm) than PTC without gain of expres-sion (1.78 ± 0.25 cm; P = 0.021; Additional file 14: Table S8). Gain of C1QL1 expression in PTC was also sig-nificantly associated with the presence of extrathyroidal extension (P = 0.006), and BRAF mutations (P = 0.001).
Clinical and molecular associations with gain ofLCN2 expression
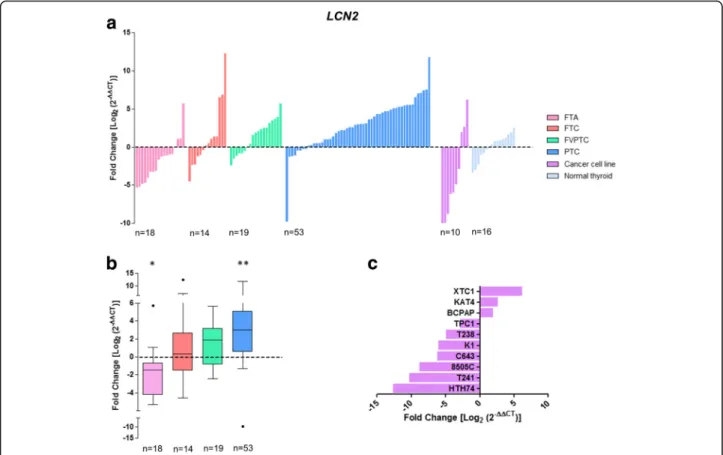
LCN2 expression levels were successful measured by qPCR in 86 DTC (14 FTC, 19 FVPTC and 53 PTC), 10 thyroid cancer cell lines, 18 FTA, and 16 matched thy-roid normal tissues (Fig. 4a). Gain of LCN2 expression
Fig. 2 Receiver Operating Characteristics (ROC) curves for gene expression of potential biomarkers in thyroid cancers. ROC curves for gene expression of individual and combined potential biomarkers in differentiated thyroid cancers (DTC) versus normal thyroid tissues and DTC versus FTA. The area under the ROC curve (AUC) represents the accuracy of the individual and combined potential biomarkers for distinguishing differentiated thyroid cancers (DTC) from normal thyroid tissue samples or follicular thyroid adenoma (FTA) (a-d). DTC versus normal thyroid for individual (a) and combined (c) potential biomarkers with gain (C1QL1and LCN2) and loss (CRABP1 and CILP) of gene expression in cancer. DTC versus FTA for individual (b) and combined (d) potential biomarkers with gain (C1QL1 and LCN2) and loss (CRABP1 and CILP) of gene expression in cancer. Asymptotic significance, standard error and 95% confidence interval measurements for all values can be found in Additional file 10: Table S5
was found in FTC, FVPTC and PTC (Fig. 4b), but the differences only achieved the threshold of statistical sig-nificance in PTC (P < 0.001). Three out of ten (30%) of the thyroid cancer cell lines showed gain of LCN2 (Fig. 4c). At variance with DTC, significant loss of LCN2 expression was found in FTA (P = 0.013; Fig. 4b). Gain of LCN2 expression in DTC samples was signifi-cantly associated with the presence of extrathyroidal ex-tension (P = 0.020), oncocytic features (P = 0.018), and the presence of BRAF mutations (P = 0.031; Table 3). Oncocy-tic pattern of the FTC was significantly associated with the gain of LCN2 expression (P = 0.016; Additional file 12: Table S6). PTC with gain of LCN2 expression were signifi-cantly larger (2.72 ± 0.30 cm) than PTC without gain of expression (1.76 ± 0.34 cm; P = 0.023; Additional file 14: Table S8). Although not statistically significant (P = 0.130), extrathyroidal extension was more frequent in PTC with gain (54%) than without gain (31%) of LCN2 expression. No significant associations that could be related with gain of LCN2 expression were observed in FVPTC.
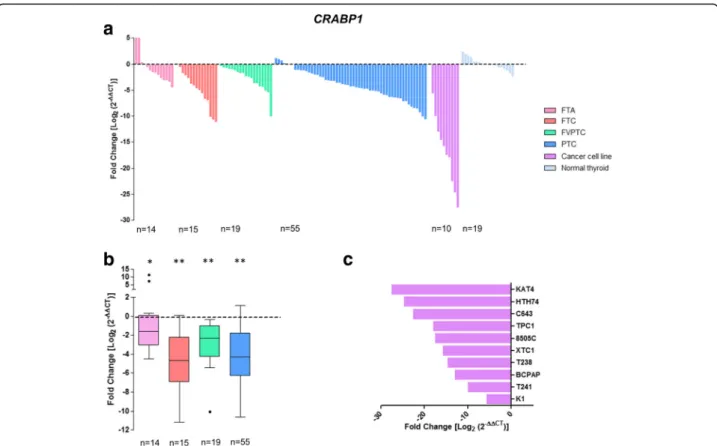
Clinical and molecular associations with loss ofCRABP1 expression
CRABP1 expression levels were successful measured by qPCR in 89 DTC (15 FTC, 19 FVPTC and 55 PTC), 10 thyroid cancer cell lines, 14 FTA, and 19 matched thy-roid normal tissues (Fig. 5a). Significant loss of CRABP1 expression was detected in FTC, FVPTC and PTC (P < 0.001), and in FTA (P = 0.023; Fig. 5b). Notably, all the 10 thyroid cancer cell lines tested showed loss of CRABP1 expression (Fig. 5c). Loss of CRABP1 expres-sion was associated with encapsulated DTC (P = 0.037). BRAF mutations (P = 0.025; Table 3) were only present in DTC with loss of CRABP1 expression. No significant associations were found in FTC, FVPTC and PTC with loss of CRABP1 expression.
Clinical and molecular associations with loss ofCILP expression
CILP expression levels were successfully measured by qPCR in 88 DTC (14 FTC, 20 FVPTC and 54 PTC), 10 thyroid cancer cell lines, 17 FTA, and twelve matched
Fig. 3 Differential gene expression of C1QL1 in thyroid tumours and normal tissues. Gene expression was measured in follicular thyroid adenoma (FTA), follicular thyroid cancer (FTC), follicular variant of papillary thyroid carcinoma (FVPTC), papillary thyroid carcinoma (PTC), normal thyroid tissues and thyroid cancer cell lines by real-time quantitative PCR. Histogram showing the gene expression of each sample ordered by expression levels (a). Box plot representation (median and Tukey whiskers) showing gene expression of each subgroup of thyroid tumours– FTA, FTC, FVPTC and PTC (b). Gene expression of the thyroid cancer cell lines (c). Gene expression was calibrated by the pool of normal thyroid tissues. Statistically significant values: *P = 0.015, **P = 0.001
Table 3 Clinicopathological and genetic data of differentiated thyroid cancers classified by classes ba sed on gene expression C1QL1 fol d chang e LCN2 fol d chang e CRAB P1 fol d chang e CILP fold chang e Normal ≤ 1 Gain > 1 P valu e Norm al ≤ 1 Gain > 1 P valu e Lo ss < − 1 Normal ≥− 1 P valu e Loss < − 1 Normal ≥− 1 P value DTC (n =9 8 ) Age (n) 33 56 NS (0.31 8) 31 55 NS (0.6 14) 75 14 NS (0.82 6) 54 34 NS (0.47 4) Mean (ye ars) 40.9 ± 2.4 44.2 ± 2.4 42.0 ± 2.2 44.0 ± 2.4 43.4 ± 1. 9 41.64 ± 3.7 42.9 ± 2.3 44.0 ± 2.7 Tumou r size (n) 31 54 NS (0.06 3) 29 53 NS (0.6 80) 71 14 NS (0.22 0) 51 33 NS (0.58 2) Mean (cm ) 2.20 ± 0.22 3.10 ± 0.27 2.59 ± 0.32 2.67 ± 0.24 2.86 ± 0. 22 2.29 ± 0.43 2.87 ± 0.28 2.49 ± 0.23 Gende r (n) 33 56 NS (0.14 8) 31 55 NS (0.2 32) 75 14 NS (0.35 0) 54 34 NS (0.17 5) Fema le (%) 26 (78.8) 50 (89.3) 28 (90.3 ) 45 (81.8 ) 63 (84.0 ) 13 (92.9) 44 (81.5 ) 31 (91. 2) Male (%) 7 (21.2 ) 6 (10.7 ) 3 (9.7) 10 (18.2 ) 12 (16.0 ) 1 (7.1) 10 (18.5 ) 3 (8.8) Cap sule (n) 30 50 NS (0.26 3) 26 51 NS (0.0 99) 66 14 0.0 37 49 30 NS (0.12 8) Posi tive (%) 18 (60.0) 25 (50.0) 17 (65.4 ) 24 (47.1 ) 39 (59.1 ) 4 (28.6 ) 29 (59.2 ) 13 (43. 3) Cap sular invas ion (n) 17 23 NS (0.49 6) 15 23 NS (0.3 32) 37 3 NS (0.70 4) 28 11 NS (0.19 1) Posi tive (%) 12 (70.6) 15 (65.2) 11 (73.3 ) 14 (60.9 ) 25 (67.6 ) 2 (66.7 ) 17 (60.7 ) 9 (81.8 ) Vascular invasion (n) 30 51 NS (0.51 6) 28 51 NS (0.2 45) 67 14 NS (0.06 0) 50 30 NS (0.26 1) Posi tive (%) 17 (56.7) 30 (58.8) 14 (50.0 ) 31 (60.8 ) 42 (62.7 ) 5 (35.7 ) 30 (60.0 ) 15 (50. 0) Lymph node me tastasis (n) 31 54 NS (0.39 8) 30 53 NS (0.0 73) 71 14 NS (0.39 7) 51 33 NS (0.07 4) Posi tive (%) 7 (22.6 ) 15 (27.8) 5 (16.7 ) 18 (34.0 ) 21 (29.6 ) 3 (21.4 ) 10 (19.6 ) 12 (36. 4) Extrath yroidal exte nsion (n) 30 51 0.0 03 29 50 0.020 67 13 NS (0.32 8) 48 32 NS (0.33 2) Posi tive (%) 4 (13.3 ) 23 (45.1) 5 (17.2 ) 21 (42.0 ) 23 (34.3 ) 3 (23.1 ) 17 (35.4 ) 9 (28.1 ) Distant me tastasis (n) 31 54 NS (0.09 6) 30 53 NS (0.4 01) 71 14 NS (0.39 7) 51 33 NS (0.65 7) Posi tive (%) – 5 (9.3) 1 (3.33 ) 4 (7.55 ) 5 (7.04)) – 2 (3.92 ) 2 (6.06 ) Lymphocyt ic thyroid itis (n) 32 51 0.0 03 30 51 NS (0.4 16) 69 14 NS (0.56 3) 49 33 NS (0.35 4) Posi tive (%) 7 (21.9 ) 28 (54.9) 12 (40.0 ) 23 (45.1 ) 31 (44.9 ) 6 (42.9 ) 19 (38.8 ) 15 (45. 5) Oncoc ytic (n) 31 50 NS (0.29 0) 28 51 0.018 67 14 NS (0.32 9) 48 32 NS (0.47 3) Posi tive (%) 5 (16.1 ) 12 (24.0) 2 (7.14 ) 15 (29.4 ) 13 (19.4 ) 4 (28.6 ) 9 (18.8 ) 7 (21.9 ) PAX8-PP ARG rear rangements (n) 33 56 NS (0.37 1) 31 55 NS (0.3 60) 75 14 NS (0.84 3) 54 34 NS (0.38 6) Posi tive (%) 1 (3.03 ) – 1 (3.23 ) – 1 (1.33) –– 1 (2.94 ) RET/PT C rearran gemen ts (n) 33 56 NS (0.49 3) 31 55 NS (0.1 74) 75 14 NS (0.61 7) 54 34 NS (0.16 0) Posi tive (%) 5 (15.1 ) 10 (17.9) 3 (9.68 ) 11 (20.0 ) 12 (16.0 ) 2 (14.3 ) 7 (13.0 ) 8 (23.5 ) RET /PT C1 rearran gemen t (n) 33 56 NS (0.61 8) 31 55 NS (0.1 63) 75 14 NS (0.42 5) 54 34 NS (0.07 0) Posi tive (%) 4 (12.1 ) 7 (12.5 ) 2 (6.45 ) 9 (16.4 ) 10 (13.3 ) 1 (7.14 ) 4 (7.41 ) 7 (20.6 )
Table 3 Clinicopathological and genetic data of differentiated thyroid cancers classified by classes ba sed on gene expression (Co ntinued) C1QL1 fol d chang e LCN2 fol d chang e CRAB P1 fol d chang e CILP fold chang e Normal ≤ 1 Gain > 1 P valu e Norm al ≤ 1 Gain > 1 P valu e Lo ss < − 1 Normal ≥− 1 P valu e Loss < − 1 Normal ≥− 1 P value RET /PT C3 rearran gemen t (n) 33 56 NS (0.62 9) 31 55 1 75 14 1 54 34 NS (0.61 4) Posi tive (%) – 1 (1.79 ) –– – – 1 (1.85 ) – BRAF mutation (n) 33 56 <0. 001 31 55 0.031 75 14 0.0 25 54 34 NS (0.33 1) Posi tive (%) – 18 (32.1) 3 (9.68 ) 16 (29.1 ) 19 (25.3 ) – 13 (24.1 ) 6 (17.6 ) NRAS mutation (n) 33 56 NS (0.21 3) 31 55 NS (0.3 00) 75 14 NS (0.09 0) 54 34 0.00 1 Posi tive (%) 7 (21.2 ) 7 (12.5 ) 6 (19.4 ) 7 (12.7 ) 13 (17.3 ) – 14 (25.9 ) – TERT promo ter mu tation (n) 33 56 NS (0.24 4) 31 55 NS (0.7 06) 75 14 NS (0.59 5) 54 34 NS (0.66 9) Posi tive (%) – 3 (5.36 ) 1 (3.23 ) 2 (3.64 ) 3 (4.00) – 2 (3.70 ) 1 (2.94 ) n, number of cases with available data; 1, no statistics were computed due to constant numbers of one feature Bold values indicate the result was statistically significant
thyroid normal tissues (Fig. 6a). Loss of CILP was detected in FTC, FVPTC and PTC (Fig. 6b), but differences only attained the threshold of statistical significance in PTC (P = 0.013). All the ten thyroid cancer cell lines tested showed loss of CILP expression (Fig. 6c). NRAS mutations (P = 0.001; Table 3) were only present in DTC with loss of CILPexpression. The same association was also found in FVPTC with loss of CILP expression (P = 0.043). No sig-nificant associations were found in FTC and PTC with loss of CILP expression.
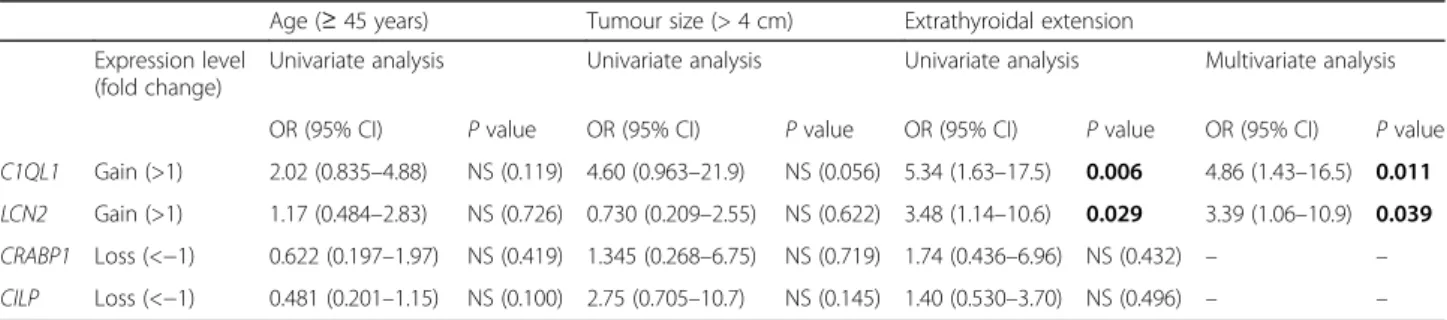
Association of thyroid cancer risk factors and gene expression
A regression model was performed with C1QL1, LCN2, CRABP1 and CILP expression values for thyroid cancer prognostic factors: age of patients (> 45 years), tumour size (> 4 cm), and presence of extrathyroidal extension of the tumour (Table 4). Distant metastasis as prognostic factor was not considered for the computation in the re-gression models due to the reduced number of thyroid cancers with distant metastasis in the present series.
In the univariate analysis, gain of the C1QL1 [odds ra-tio (OR) = 5.34; P = 0.006] and LCN2 (OR = 3.48; P = 0.029) expression were significantly associated with the extrathyroidal extension of the tumour. In the multivari-ate model, gain of C1QL1 (OR = 4.86; P = 0.011) and LCN2 (OR = 3.39; P = 0.039) expression were independ-ent predictive factors for extrathyroidal extension in DTC. Additionally, gain of C1QL1 expression was ob-served in the larger (> 4 cm) DTC (OR = 4.60), but the difference was only borderline in terms of statistical sig-nificance (P = 0.056). No associations were found be-tween CRABP1 and CILP expression and prognostic factors of thyroid cancer.
Discussion
The clinical behaviour of thyroid cancer is still difficult to predict and clinical and histopathological prognostic factors remain the key elements for diagnosis and prog-nosis of the patients [4]. Due to the scarcity of molecular biomarkers that can predict the clinical behaviour of thyroid tumours, we used the high-throughput paired-end RNA-seq technology to progress in this subject.
Fig. 4 Differential gene expression of LCN2 in thyroid tumours and normal tissues. Gene expression was measured in follicular thyroid adenoma (FTA), follicular thyroid cancer (FTC), follicular variant of papillary thyroid carcinoma (FVPTC), papillary thyroid carcinoma (PTC), normal thyroid tissues and thyroid cancer cell lines by real-time quantitative PCR. Histogram showing the gene expression of each sample ordered by expression levels (a). Box plot representation (median and Tukey whiskers) showing gene expression of each subgroup of thyroid tumours– FTA, FTC, FVPTC and PTC (b). Gene expression of the thyroid cancer cell lines (c). Gene expression was calibrated by the pool of normal thyroid tissues. Statistically significant values: *P = 0.013 **P < 0.001
Until now, few RNA-seq studies on thyroid cancer have been published [9, 20–23], but none in FTC. In this pio-neering study using FTC as a model, we gave a particu-lar attention towards the identification of genes differentially expressed in mFTC and wFTC.
In total, 17 genes were found to be differentially expressed in mFTC and wFTC. After customized filter-ing and validation of expression values by qPCR, C1QL1, LCN2, CRABP1 and CILP genes were selected for fur-ther validations in a larger series of DTC, using FTAs and a pool of normal thyroid tissues for comparison.
Remarkably, CRABP1 was differentially expressed be-tween DTC, FTA and normal thyroid tissue. Expression of CRABP1 was significantly lower in FTC, FVPTC and PTC and in all ten thyroid cancer cell lines than in nor-mal thyroid and FTA. In the ROC analysis, AUC for the CRABP1 had the highest value (0.902), in the compari-son of DTC versus normal thyroid. Gene expression from thyroid samples in TCGA reinforced CRABP1 as biomarker in DTC.
CRABP1 (cellular retinoic acid binding protein1) en-codes a specific binding protein for a vitamin A family
member and is thought to play an important role in ret-inoic acid-mediated differentiation and proliferation pro-cesses. Loss of CRABP1 expression in thyroid cancer was shown in previous studies [24, 25], and hypermethy-lation of CRABP1 promoter CpG islands has been shown as a possible explanation for its reduced expres-sion in thyroid cancer [26] and in other human cancers [27–29]. Our results confirm the potential of CRABP1 as a biomarker of DTC, based in a large number of DTC (n = 89) encompassing several subtypes – FTC, FVPTC and PTC, and controlled by a pool of normal thyroid tis-sues and of benign tumours – FTA. Our results suggest that CRABP1 should be tested in order to see if it may be used in FNAB, for the differential diagnosis of the thyroid nodules displaying morphological features suspicious of malignancy. In contrast to results obtained in other hu-man cancers [30, 31], we did not find any significant asso-ciation between CRABP1 expression and several well established prognostic factor in thyroid cancer.
CILP was found differentially expressed between DTC and normal thyroid tissue. Loss of CILP expression was observed in FTC, FVPTC and PTC, but the difference was
Fig. 5 Differential gene expression of CRABP1 in thyroid tumours and normal tissues. Gene expression was measured in follicular thyroid adenoma (FTA), follicular thyroid cancer (FTC), follicular variant of papillary thyroid carcinoma (FVPTC), papillary thyroid carcinoma (PTC), normal thyroid tissues and thyroid cancer cell lines by real-time quantitative PCR. Histogram showing the gene expression of each sample ordered by expression levels (a). Box plot representation (median and Tukey whiskers) showing gene expression of each subgroup of thyroid tumours– FTA, FTC, FVPTC and PTC (b). Gene expression of the thyroid cancer cell lines (c). Gene expression was calibrated by the pool of normal thyroid tissues. Statistically significant values: *P = 0.023 **P < 0.001
only significant for the PTC. Notably, all thyroid cancer cell lines had loss of CILP expression. NRAS mutations were only present in DTC with loss of CILP expression. No associations were observed between CILP expression and other prognostic factors of thyroid cancer.
CILP(cartilage intermediate layer protein) can act as a negative regulator of TGFβ and inhibitory effect of CILP on TGFβ signalling increases with cartilage degeneration [32]. To the best of our knowledge there are no reports on record evidencing a possible relationship between
CILPexpression and cancer. Based on the data obtained in our study, it is not clear that CILP may be used as a good biomarker for DTC in spite of the aforementioned differentiated expression between PTC and normal thy-roid tissue. The study of a larger series is required to clarify this issue.
Similar to the CRABP1, LCN2 was found differentially expressed between DTC, FTA and normal thyroid tissue. Gain of LCN2 expression was detected in FTC, FVPTC and PTC, but this gain only obtained the threshold of
Fig. 6 Differential gene expression of CILP in thyroid tumours and normal tissues. Gene expression was measured in follicular thyroid adenoma (FTA), follicular thyroid cancer (FTC), follicular variant of papillary thyroid carcinoma (FVPTC), papillary thyroid carcinoma (PTC), normal thyroid tissues and thyroid cancer cell lines by real-time quantitative PCR. Histogram showing the gene expression of each sample ordered by expression levels (a). Box plot representation (median and Tukey whiskers) showing gene expression of each subgroup of thyroid tumours– FTA, FTC, FVPTC and PTC (b). Gene expression of the thyroid cancer cell lines (c). Gene expression was calibrated by the pool of normal thyroid tissues. Statistically significant values: *P = 0.013
Table 4 Associations of fold change in gene expression with prognostic factors in differentiated thyroid cancer
Age (≥ 45 years) Tumour size (> 4 cm) Extrathyroidal extension
Expression level (fold change)
Univariate analysis Univariate analysis Univariate analysis Multivariate analysis
OR (95% CI) P value OR (95% CI) P value OR (95% CI) P value OR (95% CI) P value
C1QL1 Gain (>1) 2.02 (0.835–4.88) NS (0.119) 4.60 (0.963–21.9) NS (0.056) 5.34 (1.63–17.5) 0.006 4.86 (1.43–16.5) 0.011 LCN2 Gain (>1) 1.17 (0.484–2.83) NS (0.726) 0.730 (0.209–2.55) NS (0.622) 3.48 (1.14–10.6) 0.029 3.39 (1.06–10.9) 0.039 CRABP1 Loss (<−1) 0.622 (0.197–1.97) NS (0.419) 1.345 (0.268–6.75) NS (0.719) 1.74 (0.436–6.96) NS (0.432) – – CILP Loss (<−1) 0.481 (0.201–1.15) NS (0.100) 2.75 (0.705–10.7) NS (0.145) 1.40 (0.530–3.70) NS (0.496) – – Bold values indicate the result was statistically significant
statistical significant in PTC. In the ROC analysis, AUC for the LCN2 had the highest value (0.898), in the com-parison of DTC versus FTA. This finding suggests that LCN2 overexpression may be an interesting biomarker of DTC. Gain of LCN2 expression in DTC was signifi-cantly associated with the presence of extrathyroidal extension, oncocytic features and presence of BRAF mutation. In addition, gain of LCN2 expression in PTC was significantly associated with larger tumour size. Gene expression found in thyroid samples from TCGA confirmed LCN2 as biomarker in DTC.
LCN2is a small secreted glycoprotein from the lipoca-lins family proteins that is important in the protection against bacterial infection and in the modulation of oxidative stress [33]. Consistent with our findings, LCN2 protein overexpression has previously been found in a small series of thyroid cancers [34]. Our data show that higher LCN2 expression (OR = 3.48; P = 0.029) is significantly associated with extrathyroidal extension, a prognostic factor that is strongly associate with progression of thyroid cancer. Functional studies in thyroid cancer cell lines also support this assumption; ectopic expression of LCN2 in thyroid cancer cell line leads to an increase of its metastatic behaviour [35]. LCN2 has been indicated as a potential diagnostic and prognos-tic cancer biomarker in other cancer models [reviewed in [33]]. Our results indicate that LCN2 expression may also serve as a useful biomarker in DTC, namely for the FNAB diagnosis of thyroid nodules.
C1QL1 was found differentially expressed between DTC and normal thyroid tissue. We observed a clear cut gain of C1QL1 expression in FTC, FVPTC and PTC. The relative low number of FTC of the present series can justify the lack of statistical significance verified in the comparison of FTC with normal thyroid tissue re-garding C1QL1 expression. Gain of C1QL1 expression was significantly associated with the presence of extra-thyroidal extension in DTC. In PTC, tumours with gain of C1QL1 expression were significantly larger than tu-mours without C1QL1 overexpression. Since extrathyroi-dal extension and tumour size are major prognostic factors of thyroid cancer it may be advance that gain of expression of C1QL1 will probably be a good indicator of clinical evolution. Notably, gain of C1QL1 expression was significantly higher in wFTC than in mFTC, reinfor-cing the assumption that gain of C1QL1 expression is re-lated with thyroid cancer progression. Although we found an association of C1QL1 overexpression and lymphocytic thyroiditis in DTC, further statistical ana-lyses revealed no significant differences of C1QL1 ex-pression between the subtypes of DTC with lymphocytic thyroiditis and without lymphocytic thyroiditis (P = 0.316). Gene expression from thyroid samples in TCGA reinforced C1QL1 as biomarker in DTC.
C1QL1is member of a subfamily of small secreted pro-teins of unknown function -C1q-like that are expressed al-most exclusively in brain, and produced in differential patterns by specific types of neurons [36]. There are no current reports establishing a possible relation between C1QL1 expression and cancer. Despite this, our study showed a significant association between higher C1QL1 expression (OR = 5.34; P = 0.006) and extrathyroidal ex-tension. Additionally, gain of C1QL1 expression was ob-served in the larger (> 4 cm) thyroid cancers (OR = 4.60; P= 0.056), thus reinforcing the importance of C1QL1 ex-pression as predictor of thyroid cancer progression. Fur-ther studies in larger patient-series are necessary to confirm the statistical significance of our finding with re-gard to C1QL1 expression.
Afirma™ Gene Expression Classifier (GEC) and Thyro-Seq® v.2 are diagnostic tools commercially available and provide accurate classification of most thyroid nodules into benign or malignant in FNAB with undetermined diagnostic [37–41]. Both assays have high negative (NPV) and/or positive predictive values (PPV) in indicat-ing malignancy of thyroid nodules [39]. These diagnostic tools avoid unnecessary surgeries reducing costs and risks for the patients. Although very useful, these tech-nologies are based in a panel of numerous biomarkers, with high costs and not used broadly. Additionally, the use of molecular data for predict the prognostic of thy-roid cancer patients remains controversial [42] and the identification of biomarkers with prognostic potential (as we describe here for C1QL1 and LCN2) can further improve the design of this kind of assays. Curiously, the Afirma™ GEC and ThyroSeq® v.2 panels do not include any gene validated in our data, reinforcing the relevance and novelty of the biomarkers described here. A possible limitation of the present study was the relatively small discovery set used in the RNA-seq analysis, however, to obviate that, the results were validated by RT-PCR in a series of 118 thyroid tumours and 19 normal thyroid samples and by bioinformatics expression analysis in 393 PTC and 59 thyroid normal samples using the TCGA dataset [9].
Conclusions
In conclusion, we found that expression of the individ-ual genes CRABP1 and LCN2 may be useful bio-markers in DTC, able to improve FNAB differential diagnosis of benign versus malignant tumours. We also found that LCN2 and C1QL1 are independent predic-tors of extrathyroidal extension in DTC. The utility of these biomarkers should be evaluated in larger patient series and, in case our findings are confirmed, it will be very interesting to witness the development of tools for the diagnosis and/or prognostic of thyroid cancer using them.
Additional files
Additional file 1: Clinicopathological features and genetic alterations of the differentiated thyroid carcinoma (DTC) series. (DOCX 12 kb) Additional file 2: Table S1. Genes differentially expressed between minimally (mFTC) and widely invasive follicular thyroid carcinoma (wFTC). (DOCX 14 kb)
Additional file 3: Table S2. Transcripts differentially expressed between minimally (mFTC) and widely invasive follicular thyroid carcinoma (wFTC). (DOCX 14 kb)
Additional file 4: Figure S1. Ratio of cancer/normal tissue gene expression levels of the FTC cases used in RNA-seq. Gene expression was measured by real-time quantitative PCR in the FTC (cases 1–4) used in high-throughput paired-end RNA-seq. FTC, follicular thyroid carcinoma; mFTC, minimally invasive FTC; wFTC, widely invasive FTC. (JPEG 355 kb) Additional file 5: Figure S2. Number of fusion genes identified in FTC cases using stringent requirements in RNA-seq data. The identified fused sequences were filtered in a customized manner for nomination of fusion genes for further experimental validation by reverse transcription-PCR and Sanger sequencing. Case 1 and 2 are widely invasive FTC, and case 3 and 4 are minimally invasive FTC. FTC, follicular thyroid carcinoma. (JPEG 351 kb) Additional file 6: Table S3. Fusion genes selected by customized filtering steps and experimentally validated by RT-PCR and Sanger sequencing. FTC, follicular thyroid carcinoma; ORF, open reading frame. (DOCX 15 kb) Additional file 7: Table S4. Oligonucleotide primers used in RT-PCR to detect the fusion genes. (DOCX 13 kb)
Additional file 8: Prediction and experimental validation of the fusion genes expressed in follicular thyroid carcinomas used in RNA-sequencing. (DOCX 17 kb)
Additional file 9: Figure S3. Differential gene expression of C1QL1, LCN2, CRABP1 and CILP in thyroid tumours and normal tissues. Gene expression of C1QL1 (a), LCN2 (b), CRABP1 (c) and CILP (d) genes was measured by real-time quantitative PCR in normal thyroid (NT) tissues, follicular thyroid adenoma (FTA) and differentiated thyroid cancer (DTC). Each dot represents the mean of gene expression of each sample. The lines represent the averages. Statistical significance values: *, P = 0.002; **, P = 0.005; ***, P = 0.013; ****, P < 0.001; *****, P = 0.022; ******, P = 0.018. (JPEG 417 kb)
Additional file 10: Table S5. Receiver Operating Characteristics (ROC) curve analysis. ROC curves for individual biomarkers were generated using log2 (2-ΔΔCT) gene expression values and thyroid tissue type [differentiated thyroid carcinoma (DTC) and normal or DTC and follicular thyroid adenoma (FTA)] as input. For evaluation of the combined biomarker panel the sum of log2 (2-ΔΔCT) expression values from genes with gain (C1QL1 and LCN2) and loss (CRABP1 and CILP) in DTC were used. AUC, area under the curve; CI, confidence interval. (DOCX 14 kb) Additional file 11: Figure S4. Gene expression of C1QL1, LCN2, CRABP1 and CILP in thyroid cancers available in TCGA. Gene expression values (normalized read counts) of C1QL1 (a), LCN2 (b), CRABP1 (c) and CILP (d) in differentiated thyroid cancer (DTC) and normal thyroid (NT) tissues available in The Cancer Genome Atlas (TCGA). Each dot represents the gene expression value of each sample. The lines represent the averages. Statistical significance values: *, P < 0.001. (JPEG 518 kb)
Additional file 12: Table S6. Clinicopathological and genetic data of the FTC classified by classes based on gene expression. (DOCX 18 kb) Additional file 13: Table S7. Clinicopathological and genetic data of the FVPTC classified by classes based on gene expression. (DOCX 17 kb) Additional file 14: Table S8. Clinicopathological and genetic data of the PTC classified by classes based on gene expression. (DOCX 17 kb)
Abbreviations
CT:Cycle threshold; DTC: Differentiated thyroid carcinoma;
FISH: Fluorescence in situ hybridization; FNAB: Fine needle aspiration biopsy; FTA: Follicular thyroid adenoma; FTC: Follicular thyroid carcinoma; HPRT: Hypoxanthine phosphoribosyltransferase; mFTC: Minimally invasive FTC; PTC: Papillary thyroid carcinoma; RNA-seq: RNA sequencing;
ROC: Receiver Operating Characteristics; RT-PCR: Reverse-transcription PCR; TCGA: The Cancer Genome Atlas;; wFTC: Widely invasive FTC
Acknowledgements Not applicable. Funding
This work was financed by FEDER - Fundo Europeu de Desenvolvimento Regional funds through the COMPETE 2020 - Operacional Programme for Competitiveness and Internationalisation (POCI), Portugal 2020, and by Portuguese funds through FCT - Fundação para a Ciência e a Tecnologia/ Ministério da Ciência, Tecnologia e Inovação in the framework of the project "Institute for Research and Innovation in Health Sciences" (POCI-01-0145-FEDER-007274). Further funding from the project "Advancing cancer research: from basic knowledgment to application";NORTE-01-0145-FEDER-000029; “Projetos Estruturados de I&D&I”, funded by Norte 2020 – Programa Operacional Regional do Norte;
The study was funded by grants from the Research Council of Norway through its Centers of Excellence funding scheme (project number 179571). The funding organizations do not have any interference in the design of the study and collection, analysis, and interpretation of data and in writing the manuscript.
Availability of data and materials
The datasets used and/or analysed during the current study are available from the corresponding author on reasonable request.
Authors’ contributions
RC, TN, APG, LP, BC, TB, RIS and PS conceived the experiments and analysed data. RC, AP and AMH carried out experiments. CE and MSS provided the histopathological data. RC, MSS, RIS, PS were involved in writing the paper. All authors contributed with suggestions and approved the final version of the manuscript.
Ethics approval and consent to participate
This work was approved by the Ethic Committee for Health (CES) of the Hospital Center of São João (CHSJ) / Faculty of Medicine of the University of Porto (FMUP) (CES 137284–13). All the procedures described in this study were in accordance with national ethical standards (Law n° 12/2005) and Helsinki declaration. All samples from the Biobank were obtained with informed consent from the patients.
Consent for publication Not applicable. Competing interests
The authors declare that they have no competing interests.
Publisher’s Note
Springer Nature remains neutral with regard to jurisdictional claims in published maps and institutional affiliations.
Author details
1i3S - Instituto de Investigação e Inovação em Saúde, Universidade do Porto, Rua Alfredo Allen, 208, 4200-135 Porto, Portugal.2IPATIMUP - Institute of Molecular Pathology and Immunology of the University of Porto, Rua Alfredo Allen, 208, 4200-135 Porto, Portugal.3Department of Molecular Oncology, Institute for Cancer Research, Norwegian Radium Hospital, Oslo University Hospital, P.O.Box 4953 Nydalen, 0424 Oslo, Norway.4School of Allied Health Technologies, Polytechnic of Porto, Rua Dr. António Bernardino de Almeida, 400, 4200-072 Porto, Portugal.5Centre for Cancer Biomedicine, Faculty of Medicine, University of Oslo, 0424 Oslo, Norway.6ICBAS - Abel Salazar Biomedical Sciences Institute of the University of Porto, 4050-313 Porto, Portugal.7IBMC - Instituto de Biologia Molecular e Celular, Universidade do Porto, Rua Alfredo Allen, 208, 4200-135 Porto, Portugal.8Department of Medical Biochemistry, Norwegian Radium Hospital, Oslo University Hospital, 0424 Oslo, Norway.9Institute of Clinical Medicine, University of Oslo, 0318 Oslo, Norway.10Department of Pathology, Medical Faculty, University of Porto, 4200-319 Porto, Portugal.11Department of Pathology, Centro Hospitalar de São João, 4200-319 Porto, Portugal.
Received: 1 January 2017 Accepted: 20 December 2017
References
1. Howlader N, Noone AM, Krapcho M, Neyman N, Aminou R, Waldron W, Altekruse SF, Kosary CL, Ruhl J, Tatalovich Z, Cho H, Mariotto A, Eisner MP, Lewis DR, Chen HS, Feuer EJ, Cronin KA (eds). SEER Cancer Statistics Review, 1975-2009 (Vintage 2009 Populations), National Cancer Institute. Bethesda, MD, http://seer.cancer.gov/csr/1975_2009_pops09/, based on November 2011 SEER data submission, posted to the SEER web site, April 2012. 2. Kondo T, Ezzat S, Asa SL. Pathogenetic mechanisms in thyroid follicular-cell
neoplasia. Nat Rev Cancer. 2006;6:292–306.
3. DeLellis RA, Lloyd RV, Heitz PU, Eng C. WHO classification of Tumours. Pathology and Genetics of Tumours of Endocrine Organs. Lyon: IARC Press; 2004. 4. Soares P, Celestino R, Melo M, Fonseca E, Sobrinho-Simoes M. Prognostic
biomarkers in thyroid cancer. Virchows Arch. 2014;464:333–46.
5. Melo M, da Rocha AG, Vinagre J, Batista R, Peixoto J, Tavares C, Celestino R, Almeida A, Salgado C, Eloy C, et al. TERT promoter mutations are a major indicator of poor outcome in differentiated thyroid carcinomas. J Clin Endocrinol Metab. 2014;99:E754–765.
6. Qureshi AA, Collins VP, Jani P. Genomic differences in benign and malignant follicular thyroid tumours using 1-Mb array-comparative genomic hybridisation. Eur Arch Otorhinolaryngol. 2013;270:325–35.
7. Sobrinho-Simoes M, Eloy C, Magalhaes J, Lobo C, Amaro T. Follicular thyroid carcinoma. Mod Pathol. 2011;24(Suppl 2):S10–8.
8. Collini P, Sampietro G, Rosai J, Pilotti S. Minimally invasive (encapsulated) follicular carcinoma of the thyroid gland is the low-risk counterpart of widely invasive follicular carcinoma but not of insular carcinoma. Virchows Arch. 2003;442:71–6.
9. Cancer Genome Atlas Research. N. Integrated genomic characterization of papillary thyroid carcinoma. Cell. 2014;159:676–90.
10. Trapnell C, Williams BA, Pertea G, Mortazavi A, Kwan G, van Baren MJ, Salzberg SL, Wold BJ, Pachter L. Transcript assembly and quantification by RNA-Seq reveals unannotated transcripts and isoform switching during cell differentiation. Nat Biotechnol. 2010;28:511–5.
11. Trapnell C, Pachter L, Salzberg SL. TopHat: discovering splice junctions with RNA-Seq. Bioinformatics. 2009;25:1105–11.
12. Celestino R, Sigstad E, Lovf M, Thomassen GO, Groholt KK, Jorgensen LH, Berner A, Castro P, Lothe RA, Bjoro T, et al. Survey of 548 oncogenic fusion transcripts in thyroid tumors supports the importance of the already established thyroid fusions genes. Genes Chromosomes Cancer. 2012;51(12): 1154–64.
13. Vinagre J, Almeida A, Populo H, Batista R, Lyra J, Pinto V, Coelho R, Celestino R, Prazeres H, Lima L, et al. Frequency of TERT promoter mutations in human cancers. Nat Commun. 2013;4:2185.
14. Livak KJ, Schmittgen TD. Analysis of relative gene expression data using real-time quantitative PCR and the 2(−Delta Delta C(T)) method. Methods. 2001;25:402–8.
15. Cancer Genome Atlas Research Network. Integrated genomic characterization of papillary thyroid carcinoma. Cell. 2014;159(3):676–90.
16. Li B, Dewey CNRSEM. Accurate transcript quantification from RNA-Seq data with or without a reference genome. BMC Bioinformatics. 2011;12:323. 17. Giordano TJ, Au AY, Kuick R, Thomas DG, Rhodes DR, Wilhelm KG Jr, Vinco
M, Misek DE, Sanders D, Zhu Z, et al. Delineation, functional validation, and bioinformatic evaluation of gene expression in thyroid follicular carcinomas with the PAX8-PPARG translocation. Clin Cancer Res. 2006;12:1983–93. 18. He H, Jazdzewski K, Li W, Liyanarachchi S, Nagy R, Volinia S, Calin GA, Liu
CG, Franssila K, Suster S, et al. The role of microRNA genes in papillary thyroid carcinoma. Proc Natl Acad Sci U S A. 2005;102:19075–80. 19. Vasko V, Espinosa AV, Scouten W, He H, Auer H, Liyanarachchi S, Larin A,
Savchenko V, Francis GL, de la Chapelle A, et al. Gene expression and functional evidence of epithelial-to-mesenchymal transition in papillary thyroid carcinoma invasion. Proc Natl Acad Sci U S A. 2007;104:2803–8. 20. Leeman-Neill RJ, Kelly LM, Liu P, Brenner AV, Little MP, Bogdanova TI,
Evdokimova VN, Hatch M, Zurnadzy LY, Nikiforova MN, et al. ETV6-NTRK3 is a common chromosomal rearrangement in radiation-associated thyroid cancer. Cancer. 2014;120:799–807.
21. Ricarte-Filho JC, Li S, Garcia-Rendueles ME, Montero-Conde C, Voza F, Knauf JA, Heguy A, Viale A, Bogdanova T, Thomas GA, et al. Identification of kinase fusion oncogenes in post-Chernobyl radiation-induced thyroid cancers. J Clin Invest. 2013;123:4935–44.
22. Zhang Y, Yu J, Lee C, Xu B, Sartor MA, Koenig RJ. Genomic binding and regulation of gene expression by the thyroid carcinoma-associated PAX8-PPARG fusion protein. Oncotarget. 2015;6:40418–32.
23. Smallridge RC, Chindris AM, Asmann YW, Casler JD, Serie DJ, Reddi HV, Cradic KW, Rivera M, Grebe SK, Necela BM, et al. RNA sequencing identifies multiple fusion transcripts, differentially expressed genes, and reduced expression of immune function genes in BRAF (V600E) mutant vs BRAF wild-type papillary thyroid carcinoma. J Clin Endocrinol Metab. 2014;99: E338–47.
24. Hawthorn L, Stein L, Varma R, Wiseman S, Loree T, Tan D. TIMP1 and SERPIN-A overexpression and TFF3 and CRABP1 underexpression as biomarkers for papillary thyroid carcinoma. Head Neck. 2004;26:1069–83. 25. Fontaine JF, Mirebeau-Prunier D, Raharijaona M, Franc B, Triau S, Rodien P,
Goeau-Brissonniere O, Karayan-Tapon L, Mello M, Houlgatte R, et al. Increasing the number of thyroid lesions classes in microarray analysis improves the relevance of diagnostic markers. PLoS One. 2009;4:e7632. 26. Huang Y, de la Chapelle A, Pellegata NS. Hypermethylation, but not LOH, is
associated with the low expression of MT1G and CRABP1 in papillary thyroid carcinoma. Int J Cancer. 2003;104:735–44.
27. Berg M, Hagland HR, Soreide K. Comparison of CpG island methylator phenotype (CIMP) frequency in colon cancer using different probe- and gene-specific scoring alternatives on recommended multi-gene panels. PLoS One. 2014;9:e86657.
28. Wang F, Yang Y, Fu Z, Xu N, Chen F, Yin H, Lu X, Shen R, Differential LC. DNA methylation status between breast carcinomatous and normal tissues. Biomed Pharmacother. 2014;
29. Tanaka K, Imoto I, Inoue J, Kozaki K, Tsuda H, Shimada Y, Aiko S, Yoshizumi Y, Iwai T, Kawano T, Inazawa J. Frequent methylation-associated silencing of a candidate tumor-suppressor, CRABP1, in esophageal squamous-cell carcinoma. Oncogene. 2007;26:6456–68.
30. Kainov Y, Favorskaya I, Delektorskaya V, Chemeris G, Komelkov A, Zhuravskaya A, Trukhanova L, Zueva E, Tavitian B, Dyakova N, et al. CRABP1 provides high malignancy of transformed mesenchymal cells and contributes to the pathogenesis of mesenchymal and neuroendocrine tumors. Cell Cycle. 2014;13:1530–9.
31. Miyake T, Ueda Y, Matsuzaki S, Miyatake T, Yoshino K, Fujita M, Nomura T, Enomoto T, Kimura T. CRABP1-reduced expression is associated with poorer prognosis in serous and clear cell ovarian adenocarcinoma. J Cancer Res Clin Oncol. 2011;137:715–22.
32. Seki S, Kawaguchi Y, Chiba K, Mikami Y, Kizawa H, Oya T, Mio F, Mori M, Miyamoto Y, Masuda I, et al. A functional SNP in CILP, encoding cartilage intermediate layer protein, is associated with susceptibility to lumbar disc disease. Nat Genet. 2005;37:607–12.
33. Chakraborty S, Kaur S, Guha S, Batra SK. The multifaceted roles of neutrophil gelatinase associated lipocalin (NGAL) in inflammation and cancer. Biochim Biophys Acta. 1826;2012:129–69.
34. Iannetti A, Pacifico F, Acquaviva R, Lavorgna A, Crescenzi E, Vascotto C, Tell G, Salzano AM, Scaloni A, Vuttariello E, et al. The neutrophil gelatinase-associated lipocalin (NGAL), a NF-kappaB-regulated gene, is a survival factor for thyroid neoplastic cells. Proc Natl Acad Sci U S A. 2008;105:14058–63. 35. Volpe V, Raia Z, Sanguigno L, Somma D, Mastrovito P, Moscato F, Mellone S,
Leonardi A, Pacifico FNGAL. Controls the metastatic potential of anaplastic thyroid carcinoma cells. J Clin Endocrinol Metab. 2013;98:228–35. 36. Iijima T, Miura E, Watanabe M, Yuzaki M. Distinct expression of C1q-like
family mRNAs in mouse brain and biochemical characterization of their encoded proteins. Eur J Neurosci. 2010;31:1606–15.
37. Alexander EK, Kennedy GC, Baloch ZW, Cibas ES, Chudova D, Diggans J, Friedman L, Kloos RT, LiVolsi VA, Mandel SJ, et al. Preoperative diagnosis of benign thyroid nodules with indeterminate cytology. N Engl J Med. 2012; 367:705–15.
38. Alexander EK, Schorr M, Klopper J, Kim C, Sipos J, Nabhan F, Parker C, Steward DL, Mandel SJ, Haugen BR. Multicenter clinical experience with the Afirma gene expression classifier. J Clin Endocrinol Metab. 2014;99:119–25. 39. Nikiforov YE, Carty SE, Chiosea SI, Coyne C, Duvvuri U, Ferris RL, Gooding
WE, LeBeau SO, Ohori NP, Seethala RR, et al. Impact of the multi-gene ThyroSeq next-generation sequencing assay on cancer diagnosis in thyroid nodules with atypia of undetermined significance/follicular lesion of undetermined significance cytology. Thyroid. 2015;25:1217–23. 40. Nikiforov YE, Carty SE, Chiosea SI, Coyne C, Duvvuri U, Ferris RL, Gooding
WE, Hodak SP, LeBeau SO, Ohori NP, et al. Highly accurate diagnosis of cancer in thyroid nodules with follicular neoplasm/suspicious for a follicular
neoplasm cytology by ThyroSeq v2 next-generation sequencing assay. Cancer. 2014;120:3627–34.
41. McIver B, Castro MR, Morris JC, Bernet V, Smallridge R, Henry M, Kosok L, Reddi H. An independent study of a gene expression classifier (Afirma) in the evaluation of cytologically indeterminate thyroid nodules. J Clin Endocrinol Metab. 2014;99:4069–77.
42. Kargi AY, Bustamante MP, Gulec S. Genomic profiling of thyroid nodules: current role for ThyroSeq next-generation sequencing on clinical decision-making. Mol Imaging Radionucl Ther. 2017;26:24–35.
• We accept pre-submission inquiries
• Our selector tool helps you to find the most relevant journal • We provide round the clock customer support
• Convenient online submission • Thorough peer review
• Inclusion in PubMed and all major indexing services • Maximum visibility for your research
Submit your manuscript at www.biomedcentral.com/submit