Printed version ISSN 0001-3765 / Online version ISSN 1678-2690 http://dx.doi.org/10.1590/0001-3765201820170590
www.scielo.br/aabc | www.fb.com/aabcjournal
Achieving the Sustainable Development Goal 06 in Brazil:
the universal access to sanitation as a possible mission
CINTIA M.M. DIAS1
, LUIZ P. ROSA1
, JOSE M.A. GOMEZ2
and ALEXANDRE D’AVIGNON3
1
Instituto Alberto Luiz Coimbra de Pós-Graduação e Pesquisa de Engenharia, Centro de Tecnologia, Departamento do Programa de Planejamento Energético e Ambiental (COPPE/PPE), Universidade Federal do Rio de Janeiro, Avenida Horácio Macedo, 2030, Bloco C, Sala 211, Cidade Universitária, Ilha do Fundão, 21941-450 Rio de Janeiro, RJ, Brazil
2Petrobras - Petróleo Brasileiro S.A., Diretoria de Refino e Gás Natural, Avenida Henrique Valadares, 28, Torre A, 10º andar, 20231-030 Rio de Janeiro, RJ, Brazil
3
Programa de Pós-Graduação em Políticas Públicas, Estratégias e Desenvolvimento (PPED), Instituto de Economia, Universidade Federal do Rio de Janeiro, Avenida Pasteur, 250, Palácio
Universitário Campus da Praia Vermelha, Urca, 22290-902 Rio de Janeiro, RJ, Brazil
Manuscript received on August 2, 2017; accepted for publication on December 20, 2017
ABSTRACT
Sanitation (which includes national public policies for drinking water, sewage services and waste management) is precarious in Brazil and therefore poses a challenge to a range of actors. Poor sanitation impacts public health, education, the environment, and daily life. Globally, it emits increasing greenhouse gases. Universalization of any major public service appears difficult, if not impossible; however, Brazil’s program to universalize access to electricity proves the opposite, as will be shown in this paper. By describing the successful implementation of electricity for everyone, we show that planned public efforts, coordinated with private initiatives and local communities, have worked, and the same can be achieved for the sanitation sector. An overview of all sectors that touch on sanitation and emissions is also provided, highlighting the challenges and possibilities for infrastructure projects.
Key words: Solid Waste (SW), water, sewage, sanitation, greenhouse gases, Sustainable Development Goals (SDGs).
Correspondence to: Cintia Mara Miranda Dias E-mail: [email protected]
INTRODUCTION
In Brazil, sanitation - water, sewage and waste - and electricity are provided by public bodies directly or indirectly through public concessions. Regarding sanitation, the North and Northeast regions and all
rural areas significantly lack access to this basic
service in the 21st century; Brazil is still far from
experiencing universal access, mainly for sewage (Albuquerque 2011, Heller and Castro 2013). In contrast, electricity has had some successful public programs for access and for universalization and presented positive results measured by the 2010 Demographic Census conducted by the Brazilian Institute of Geography and Statistics (IBGE). In 1999, the government launched the National Rural
Electrification Program with access targets, called
replaced, in 2003, by “Electricity for Everyone”, with universalization goals, both aimed at poor rural populations.
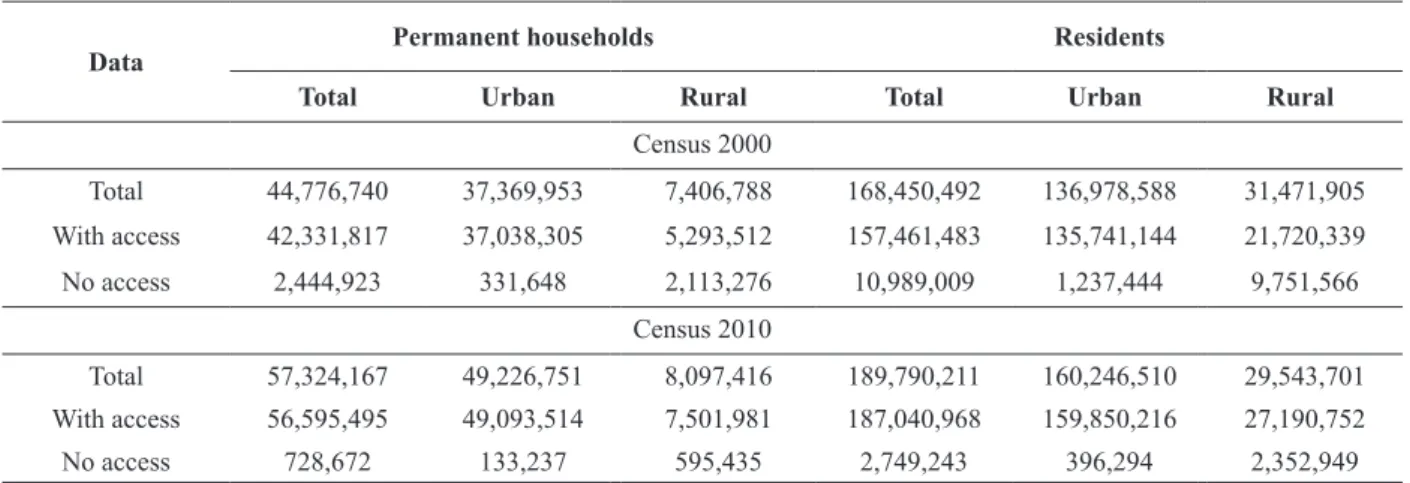
According to official Brazilian figures, presented by the 2000 Census (IBGE 2000, MME-LpT 2011, 2015), more than 9 million Brazilians in the rural area, or more than 2 million families, and more than 1 million Brazilians in the urban area
were living then without electricity; that is, more
than 10 million people had no access to electricity (Table I).
According to the 2010 Census (IBGE 2010a), these numbers had significantly improved and dropped to just over 2 million people in the rural area and less than 400,000 in the urban area (Table I). Moreover, by 2015, the rural electrification program had reached more than 15 million families. On the other hand, the 2010 census pointed out that more than 27 million households were not connected to a drainage or sewer system, meaning that more than 100 million Brazilians and more than 7 million households do not have adequate
waste collection (IBGE 2010). While the efforts towards electricity universalization were effective,
there were no significant results for sanitation (Table I). According to data presented in this paper, there is a true black-out for this latter case.
T h e 2 0 3 0 A g e n d a f o r S u s t a i n a b l e Development, launched in 2015 by the United Nations Organization (UN), aims to transform the world through measurable, and therefore monitorable, goals, targets and indicators for the pursuit of sustainable development. The 17 Sustainable Development Goals (SDG), subdivided into 169 goals, “seek to build on the Millennium Development Goals (MDG) and complete what they did not achieve. They seek to realize the human rights of all and to achieve gender equality and the empowerment of all women and girls. They are integrated and indivisible and balance the three dimensions of sustainable development: the economic, social and environmental” (United
Nations 2015). In fact, differently from the MDGs,
the SDGs are a “network of targets”, meaning that each goal is extended through targets that are related to numerous goals and sectors (Blanc 2015). Planning for development tends to be more integrated and coherent.
Access to drinking water and sanitation, as well as appropriate waste management, addresses primarily SDG 06 (clean water and sanitation), but it is extended to SDG 01 (no poverty), SDG 02 (zero hunger), SDG 03 (good health and well-being), SDG 04 (inclusive and equitable quality
TABLE I Access to electricity.
Data
Permanent households Residents
Total Urban Rural Total Urban Rural
Census 2000
Total 44,776,740 37,369,953 7,406,788 168,450,492 136,978,588 31,471,905 With access 42,331,817 37,038,305 5,293,512 157,461,483 135,741,144 21,720,339
No access 2,444,923 331,648 2,113,276 10,989,009 1,237,444 9,751,566
Census 2010
Total 57,324,167 49,226,751 8,097,416 189,790,211 160,246,510 29,543,701 With access 56,595,495 49,093,514 7,501,981 187,040,968 159,850,216 27,190,752
No access 728,672 133,237 595,435 2,749,243 396,294 2,352,949
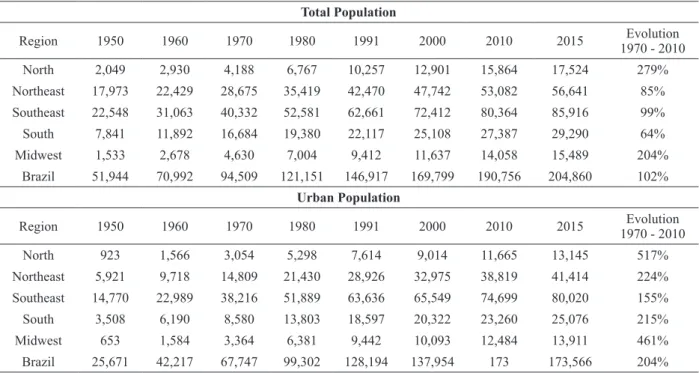
high levels of urbanization in the late 1950s and early 1970s, which was a period of growth of large metropolises, including São Paulo. The North showed the highest population growth for the period from 1970 to 2010, followed by the Midwest, and both regions showed almost the same population in 2010. The Northeast is the third most populated region in Brazil: its cities are located mainly on the coast, with large population densities and crowded urban centres. While Brazil increased its urban population by 204% overall from 1970 to 2010, the North grew by 517% and the Midwest by 461%. Rapid urban growth in the North and Northeast outstripped public capacity to provide basic services, as will be seen in the indices presented below.
Analyzing the evolution of the urban and rural population in the country is an important factor in the analysis of the provision of basic services (Table II). In fact, according to Costa and Ribeiro (2013), even if unsteady, the sanitation service was considered an urban service until the middle of education), SDG 10 (reduced inequalities), SDG
11 (sustainable cities and communities), SDG 12 (responsible consumption and production), SDG 13 (climate action), and SDG 15 (life on land). Finally, of course, SDG 17 (partnership for the goals) is addressed, as it includes the means to implement all goals (Blanc 2015). To achieve these objectives,
Brazil will have to make significant efforts for some
decades to come. In summary, achieving the targets
of the SDG 06 will have immediate spillover effects on other goals. These influences could be a theme
of other paper as it will not be dealt in the present article. Indeed, the focus on this work is solely on the possible achievement of the SDG 06.
AN OVERVIEW OF SANITATION IN BRAZIL
Brazil is divided into five regions: North, Northeast,
Southeast, South and Midwest. As shown in Table II, there was a significant increase in the urbanization of the South and Midwest from the 1970s to 2010. The Southeast already presented
TABLE II
Resident population in Brazil (in thousands). Total Population
Region 1950 1960 1970 1980 1991 2000 2010 2015 Evolution
1970 - 2010
North 2,049 2,930 4,188 6,767 10,257 12,901 15,864 17,524 279%
Northeast 17,973 22,429 28,675 35,419 42,470 47,742 53,082 56,641 85%
Southeast 22,548 31,063 40,332 52,581 62,661 72,412 80,364 85,916 99%
South 7,841 11,892 16,684 19,380 22,117 25,108 27,387 29,290 64%
Midwest 1,533 2,678 4,630 7,004 9,412 11,637 14,058 15,489 204%
Brazil 51,944 70,992 94,509 121,151 146,917 169,799 190,756 204,860 102%
Urban Population
Region 1950 1960 1970 1980 1991 2000 2010 2015 1970 - 2010Evolution
North 923 1,566 3,054 5,298 7,614 9,014 11,665 13,145 517%
Northeast 5,921 9,718 14,809 21,430 28,926 32,975 38,819 41,414 224%
Southeast 14,770 22,989 38,216 51,889 63,636 65,549 74,699 80,020 155%
South 3,508 6,190 8,580 13,803 18,597 20,322 23,260 25,076 215%
Midwest 653 1,584 3,364 6,381 9,442 10,093 12,484 13,911 461%
Brazil 25,671 42,217 67,747 99,302 128,194 137,954 173 173,566 204%
the 20th century. In consonance with the authors,
there was an evolution regarding the provision of the service when the federal government began to interfere directly in the provision of these services in 1942, with the Special Public Health Service
(SESP); later, in 1960, the SESP Foundation, within
the Ministry of Health, also started implementing sanitation actions. In the 1940s, the execution of sanitation works passed to the scope of the Ministry of Works and Transport, with the National Department of Sanitation Works. Subsequently, after the creation of the Superintendence of the Development of the Northeast (SUDENE) in 1959, the creation of state bodies for the provision of these services was strengthened, especially after the formation of the National Fund for Sanitation Works (FNOS) in 1962.
The authors emphasize that in the history of public policies for basic sanitation, there was always “a movement to modify subsidy policies to financing policies” and there were changes in partnerships. Initially, these were via federal
government with municipalities until the 1940s;
then they became federal government partnerships with state companies during the military government.
It was precisely during the military government, with the National Sanitation Plan (PLANASA), operationalized through the National Housing Bank (BNH), that there was the largest federal effort and the most extensive coverage of water supply and sewage services. This, however, favored the richer regions of the South and Southeast, where there was the greatest possibility of amortization
of investments through tariffs (Costa and Ribeiro
2013). With the abolition of the BNH in 1986, and with the Federal Constitution of 1988, stemming from the re-democratization of the country, there was an institutional vacuum that followed until Law 11,445/2007 (Brasil 2007), the National Basic
Sanitation Law of 2007. The LNSB modified the
concept of basic sanitation as follows:
“The public services of basic sanitation involve not only the public services of drinking water supply and sanitary sewage, but also the public services of public cleaning, management of solid waste and also those of urban storm water management… being a duty of the Union…instituting a Federal Basic Sanitation Policy” (Costa and Ribeiro 2013). In addition, the municipality became the central point of sanitation policy, and it has been the focus of resistance from previously created state-owned enterprises. This fact resulted in major challenges, as listed by Costa and Ribeiro
(2013): the difficulty of making the municipality
really do the planning, and of ensuring that the local regulation is independent and that social control is indeed a transparent and integrated policy. The creation of the Ministry of Cities in 2003 was fundamental to integrating existing policies and to providing the centrality of the Federal Basic Sanitation Policy within its National Secretariat of Environmental Sanitation (SNSA) (Costa and Ribeiro 2013).
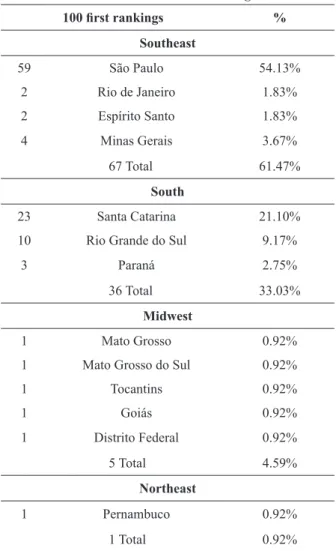
The results of these decades-old centralized policies in the richest and most urban areas of the country can be glimpsed by analyzing the 2013 Municipal Human Development Index (MHDI) published by the United Nations Development Program (UNDP) for 5,565 cities (Table III), of which 109 cities are counted in the first 100
rankings. The first place with a MHDI of 0.882 is
the city of São Caetano do Sul, in São Paulo, and 10
cities are tied in the first 100 places with a MHDI of 0.784 (five in São Paulo, two in Rio Grande do Sul,
two in Santa Catarina and one in in Mato Grosso
do Sul). The only city in the Northeast in these first
100 places is Fernando de Noronha, in 76th place, a
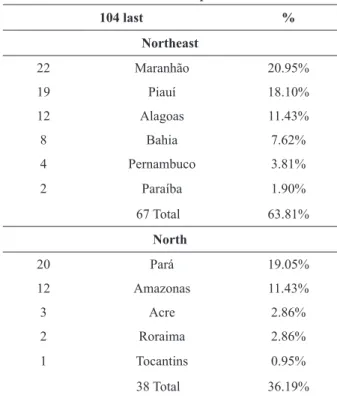
touristic town with a high level of access control. According to the same data for 2010, 105
cities were classified in the last 104 places, with
Table IV. The Northeast has more cities in the lower positions, with 63.81% of the municipalities
in the sample; followed by the North, with 35.24%
represented in these placements. The worst MHDIs are from Maranhão (22 cities), Pará (20 cities) and Piauí (19 cities). The Northeast has a total of nine states, and six are represented in the last positions of the MHDI. The North has seven states and
five are represented. It can be noted that there is
a lack of essential services, and abundant poverty and vulnerability, evidenced in this worst index. It
should be noted that the lowest MHDI figures do
not include states in the Southeast, the South or the Midwest, while among the top places only one state in the Northeast is represented.
This is the Brazilian situation in the 21st
century, a country with severe regional imbalances and socioeconomic inequalities, a national MHDI of 0.755 ( PNUD, Ipea and FJP 2013), a population of approximately 205 million inhabitants, and a GDP of approximately US $ 1,845 trillion (Banco Central 2017). It is predominantly an urban country (Table II and V).
This paper aims to describe the evolution of the sanitation indices in Brazil over a ten-year period and to provide suggestions for its universal access, that is to say, recommendations to implementing the SDG 06. The main hypothesis is that universal access to sanitation is only possible via the power of the state, by means of investing, catalysing or obliging investments in this sector, as will be shown by using the successful example of rural
electrification. First, the overview and the profile of
sanitation, as well as its emissions, will be detailed. Next, the program “Electricity for Everyone” will be described, to show how it achieved the universalization of rural electrification. In conclusion, despite being a challenging task, there is, in fact, the possibility of universal access to sanitation.
MATERIALS AND METHODS
The paper consists of qualitative and quantitative analyses of indicators of access to energy and sanitation, in order to provide an overview of the provision of these services, and a qualitative investigation of manuals, laws, reports and governmental releases.
The main sources of data were the National
Institute of Geography and Statistics (IBGE);
the Brazilian Association of Public Cleaning and
Special Waste Companies (Abrelpe); the Ministry of Cities (MCID); and the Ministry of Science,
Technology, Innovation and Communications (MCTIC). Data were collected focusing mainly on a 10-year evolution of statistics, when possible.
TABLE III
MDHI 2013 - first 100 rankings.
100 first rankings %
Southeast
59 São Paulo 54.13%
2 Rio de Janeiro 1.83%
2 Espírito Santo 1.83%
4 Minas Gerais 3.67%
67 Total 61.47%
South
23 Santa Catarina 21.10%
10 Rio Grande do Sul 9.17%
3 Paraná 2.75%
36 Total 33.03%
Midwest
1 Mato Grosso 0.92%
1 Mato Grosso do Sul 0.92%
1 Tocantins 0.92%
1 Goiás 0.92%
1 Distrito Federal 0.92%
5 Total 4.59%
Northeast
1 Pernambuco 0.92%
1 Total 0.92%
Some indicators did not present any historical series and were collected in a manner that came as close as possible to a 10-year historical series, as will be detailed. The Brazilian Association of Public Cleaning and Special Waste Companies (Abrelpe) has an annual assessment of solid waste (SW) statistics, so, the authors chose to analyze the ten-year evolution of data (2005 - 2015), but also considered the most up-to-date numbers of Abrelpe (2016).
Sanitation and population data were extracted from IBGE, which holds its main indicators in the database Bank of Statistical Tables (SIDRA). The Population Censuses of 2000 and 2010, and the National Sample Survey of Households (PNAD) were collected from SIDRA. A profile of the Brazilian population (urban and rural) and Access to Energy were retrieved from both Censuses and PNAD. From PNAD the subject categories collected were Water Supply, Sewage Treatment, and Solid Waste Destination.
The National Secretariat of Environmental Sanitation (SNSA), which is an institution under the auspices of the MCID, gathers the National Sanitation Information System (SNIS).The SNIS is a national database that presents aggregated data, disaggregated data and municipal data. Categories explored under this database were access to Water and Sewage Treatment as well as Level of Investments.
GHG emissions were extracted from the SIRENE system, under the MCTIC. Categories explored under this database were the national GHG
emission profile for Energy; Industrial Process; Agriculture; Waste; and Land Use, Land-Use
Change and Forestry (LULUCF). For the Waste category (IPCCC 1996), the data were extracted for
Effluents and Solid Waste.
The records were exported from each database into a MS Excel File and subsequently placed into single workbooks according to categories of public services provided. Each workbook contained a macro level of aggregation, and the main analyses were provisions of service to the population in absolute and relative terms, which were divided into the following categories: home location (rural or urban), and national region (North, Northeast, South Southeast, and Midwest).
These data were analyzed through two types of
comparison: the first one was through the analysis
of the factors that impacted each of the indicators developed in this work over time, in a technique
known as time series analysis; and the second one
occurred through the analysis of various indicators,
in a simultaneous comparison of different regions
and of housing location (urban/rural), in a technique known as cross-section.
The combination of both techniques allows a holistic and at the same time detailed understanding of all the qualitative factors that have a relevant impact on the indicators in quantitative terms.
Finally, the National Program for Universal Access and Use of Electric Power, known as the
TABLE IV
MHDI 2013 - last 104 placements.
104 last %
Northeast
22 Maranhão 20.95%
19 Piauí 18.10%
12 Alagoas 11.43%
8 Bahia 7.62%
4 Pernambuco 3.81%
2 Paraíba 1.90%
67 Total 63.81%
North
20 Pará 19.05%
12 Amazonas 11.43%
3 Acre 2.86%
2 Roraima 2.86%
1 Tocantins 0.95%
38 Total 36.19%
“Electricity for All” program, was analyzed in order to extract the possible drivers of its success by means of an in-depth investigation of its special project and operational manuals (MME - LpT
2009, 2011, 2015), official reports (MME - LpT 2007, 2008), governmental data, laws, and official
releases.
The purpose of using the “Electricity for All” program as an example is based on a technique choice known as benchmark, where a policy or an activity already implemented serves as a parameter or guide to the development of actions in other segments that have similarities between them. Then the authors suggested possible directions for the universal access to sanitation.
RESULTS
The current section shows data analyses for water and sewage, solid waste, and greenhouse gas emissions. Each subsection will present a quantitative and a qualitative analysis. In considering the following data, it is important to introduce the following population overview.
WATER AND SEWAGE
Sanitation in Brazil is regulated by Law 11,445/07 (Brasil 2007), which, by article 52, establishes the need to prepare a National Plan for Sanitation (Plansab), covering “water supply, sewage, solid
waste and rainwater management, with cleaning and inspection of the drainage systems, as well as other sanitation actions of interest for the improvement of environmental health, including the provision of toilets and hydro sanitary units for low-income populations”. Plansab was approved in 2013, establishing guidelines, targets and actions for the years 2014 to 2033 (MCID 2013), with its latest update performed in 2015 (SNIS 2015).
As detailed below, the plan is far from being
fulfilled. According to Plansab, it would be expected
to achieve “99% coverage rates in drinking-water supply in 20 years, with 100% coverage rates in the urban area, and 92% in sewerage services, with 93% coverage levels in the urban area. In solid waste, Plansab provides for the universalization of urban collection and the absence of open dumps or dumps in the whole country. For rainwater, another goal is to reduce the number of municipalities
where flooding or waterlogging occur, in the urban
area of 11%”.
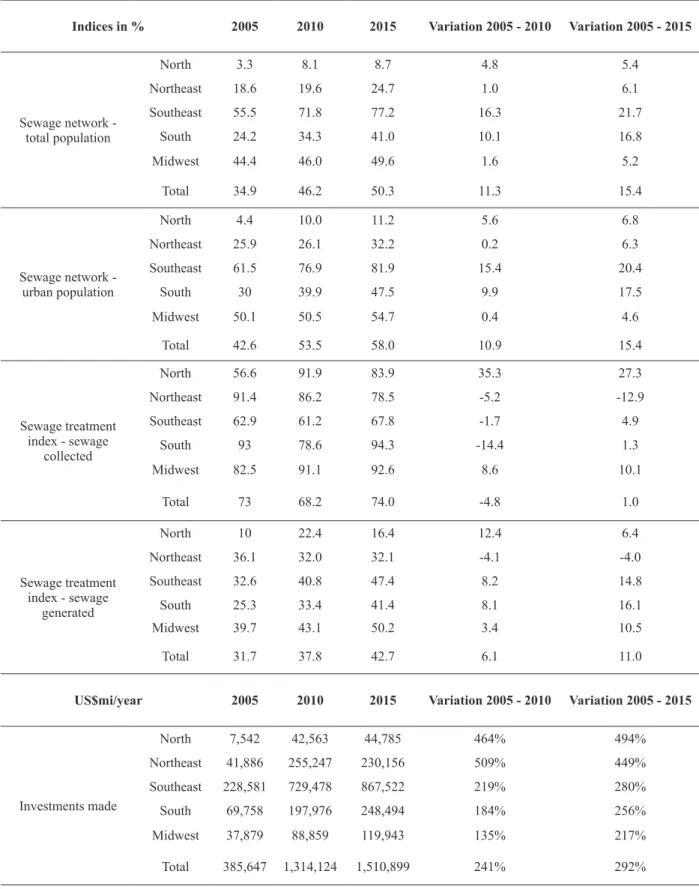
The evolution of the national sanitation
situation can be verified by the indices of coverage
rates for sewerage and water services according to SIDRA and SNIS. According to Table VI, the evolution of access rates to the sewage network shows that its universalization is still very distant for the North region and, to a lesser extent, for the Northeast. Although the North increased the
TABLE V
Total households (in thousands), % of urban households, total residents (in thousands), and % of urban residents.
Region
2005 2010 2015
Households % Residents % Households % Residents % Households % Residents %
service index for the ten-year period for the total and urban population, the attendance rate in 2015 was still 8.7% for the total population and 11.2% for the urban. Considering that in the North there was the greatest total and urban population increase in recent years, the services did not follow the growth of the number of inhabitants or the expansion of the urban spot (Table II). The volume of sewage treatment generated in the region is low (16.4%), but presents a high percentage of treatment of sewage collected (83.9%).
The North presents the lowest investment values when compared to the values of the other regions for the three-historical series (Table VI). It also presents the lowest numbers of sewage connections nationally (Table VII). The Northeast presented a low increase in coverage rates of the total (6.1%) and urban population (6.3%) in the last ten years, as well as the investment volumes
and the number of sewage connections; and, there
was a decrease in the treatment volume of the sewage collected (-12.9%) and generated (-4%). Nationally, in 2015, only the Southeast presented more than 50% of the properties with access to the sewage network for the total population (77.2%) and, for the urban population, only the Southeast (81.9%) and the Midwest (54.7%) presented more than 50% of coverage level in 2015 (Table VI).
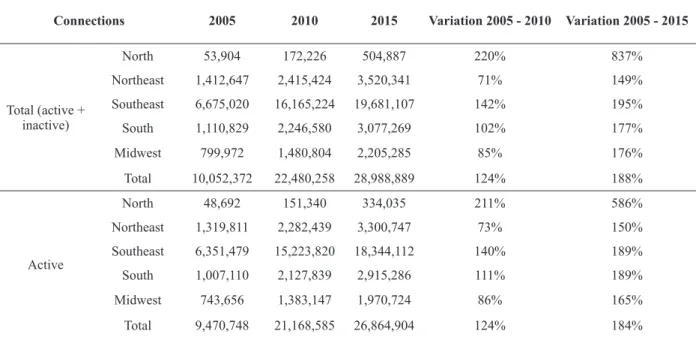
Table VII shows the evolution of extensions connected to the main sewage distribution network. Numbers show more than 2 million inactive connections in 2015. According to SNIS (2015), those inactive connections are the ones that “although registered as users of the services, are not fully operational”. More investments are possibly needed for the maintenance of these facilities.
As shown in Table VIII, the worst coverage rates for water supply are again in the North. In 2015, it was the region with the lowest service attendance rate of the total population (56.9%) and the urban population (69.2%). The amounts invested in this region are the lowest nationally
as well as the number of connections to the water supply network (Table IX). The largest losses in distribution are also in this region (46.3%), followed by the Northeast in losses (45.7%).
The South has the best rate of service for the urban population (98.1%) followed by the Midwest (97.4%), both regions of more recent urbanization than the Southeast, which presents a lower urban service, of 96.1%, a lesser index probably because there are areas within the urban area that do not receive basic services, especially in the subnormal clusters scattered around the city (favelas).
Except for the Midwest, all other regions showed a decrease in water loss in the distribution in 10 years (Table VIII). Despite this, all regions
present significant losses in distribution, exceeding
30%. This index is important for analyzing the quality of water distribution by indicating quality of management and infrastructure (SNIS 2015).
The regions with the greatest financial investment
in the water supply network are the Northeast and Southeast regions, which are the regions with the highest number of active water connections (Table IX). Apart from the Southeast, all regions
experienced a decrease in the urban population’s
service attendance rate in the last ten years, even though they increased the attendance of the total
population, probably due to a significant increase in
the urban population in all regions and a decrease in the rural population.
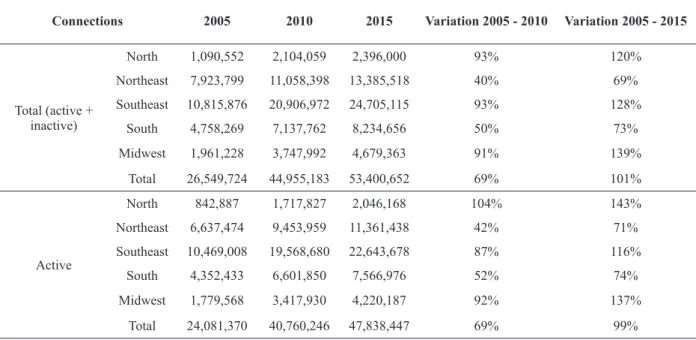
Table IX shows the evolution of extensions connected to the main water pipeline. Numbers show more than 5.5 million inactive connections in 2015. As seen in the sewage data, more investments are possibly needed for the maintenance of these facilities.
TABLE VI
Evolution of service levels – coverage rates for sewage.
Indices in % 2005 2010 2015 Variation 2005 - 2010 Variation 2005 - 2015
Sewage network - total population
North 3.3 8.1 8.7 4.8 5.4
Northeast 18.6 19.6 24.7 1.0 6.1
Southeast 55.5 71.8 77.2 16.3 21.7
South 24.2 34.3 41.0 10.1 16.8
Midwest 44.4 46.0 49.6 1.6 5.2
Total 34.9 46.2 50.3 11.3 15.4
Sewage network - urban population
North 4.4 10.0 11.2 5.6 6.8
Northeast 25.9 26.1 32.2 0.2 6.3
Southeast 61.5 76.9 81.9 15.4 20.4
South 30 39.9 47.5 9.9 17.5
Midwest 50.1 50.5 54.7 0.4 4.6
Total 42.6 53.5 58.0 10.9 15.4
Sewage treatment index - sewage
collected
North 56.6 91.9 83.9 35.3 27.3
Northeast 91.4 86.2 78.5 -5.2 -12.9
Southeast 62.9 61.2 67.8 -1.7 4.9
South 93 78.6 94.3 -14.4 1.3
Midwest 82.5 91.1 92.6 8.6 10.1
Total 73 68.2 74.0 -4.8 1.0
Sewage treatment index - sewage
generated
North 10 22.4 16.4 12.4 6.4
Northeast 36.1 32.0 32.1 -4.1 -4.0
Southeast 32.6 40.8 47.4 8.2 14.8
South 25.3 33.4 41.4 8.1 16.1
Midwest 39.7 43.1 50.2 3.4 10.5
Total 31.7 37.8 42.7 6.1 11.0
US$mi/year 2005 2010 2015 Variation 2005 - 2010 Variation 2005 - 2015
Investments made
North 7,542 42,563 44,785 464% 494%
Northeast 41,886 255,247 230,156 509% 449%
Southeast 228,581 729,478 867,522 219% 280%
South 69,758 197,976 248,494 184% 256%
Midwest 37,879 88,859 119,943 135% 217%
Total 385,647 1,314,124 1,510,899 241% 292%
TABLE VII
Evolution of service levels – sewage main connections.
Connections 2005 2010 2015 Variation 2005 - 2010 Variation 2005 - 2015
Total (active + inactive)
North 53,904 172,226 504,887 220% 837%
Northeast 1,412,647 2,415,424 3,520,341 71% 149%
Southeast 6,675,020 16,165,224 19,681,107 142% 195%
South 1,110,829 2,246,580 3,077,269 102% 177%
Midwest 799,972 1,480,804 2,205,285 85% 176%
Total 10,052,372 22,480,258 28,988,889 124% 188%
Active
North 48,692 151,340 334,035 211% 586%
Northeast 1,319,811 2,282,439 3,300,747 73% 150%
Southeast 6,351,479 15,223,820 18,344,112 140% 189%
South 1,007,110 2,127,839 2,915,286 111% 189%
Midwest 743,656 1,383,147 1,970,724 86% 165%
Total 9,470,748 21,168,585 26,864,904 124% 184%
Source: Authors, based on data from SNIS.
TABLE VIII
Evolution of service levels – coverage rates for drinking-water.
Indices in % 2005 2010 2015 Variation 2005 - 2010 Variation 2005 - 2015
Water service – Total population
North 54.5 57.5 56.9 3.0 2.4
Northeast 71 68.1 73.4 -2.9 2.4
Southeast 86.2 91.3 91.2 5.1 5.0
South 82.7 84.9 89.4 2.2 6.7
Midwest 88.1 86.2 89.6 -1.9 1.5
Total 78.8 81.1 83.3 2.3 4.5
Water service – Urban population
North 72.9 71.8 69.2 -1.1 -3.7
Northeast 97.8 87.1 89.6 -10.7 -8.2
Southeast 95.3 96.6 96.1 1.3 0.8
South 100 96 98.1 -4.0 -1.9
Midwest 99.3 95.3 97.4 -4.0 -1.9
Total 96.1 92.5 93.1 -3.6 -3.0
Distribution loss index
North 57.6 51.2 46.3 -6.4 -11.3
Northeast 50.3 50.8 45.7 0.5 -4.6
Southeast 43.5 34.4 32.9 -9.1 -10.6
South 37.9 35.4 33.7 -2.5 -4.2
Midwest 34.7 33.8 35.5 -0.9 0.8
US$mi/year 2005 2010 2015 Variation 2005 - 2010 Variation 2005 - 2015
Investments made
North 12,245 58,507 53,902 378% 340%
Northeast 105,184 285,746 265,097 172% 152%
Southeast 172,604 453,111 1,028,951 163% 496%
South 76,074 109,887 193,074 44% 154%
Midwest 72,379 89,531 100,262 24% 39%
Total 438,486 1,993,563 1,641,286 355% 274%
Source: Authors, based on data from SNIS and Banco Central 2017.
TABLE VIII (continuation)
TABLE IX
Evolution of service levels - drinking-water connections.
Connections 2005 2010 2015 Variation 2005 - 2010 Variation 2005 - 2015
Total (active + inactive)
North 1,090,552 2,104,059 2,396,000 93% 120%
Northeast 7,923,799 11,058,398 13,385,518 40% 69%
Southeast 10,815,876 20,906,972 24,705,115 93% 128%
South 4,758,269 7,137,762 8,234,656 50% 73%
Midwest 1,961,228 3,747,992 4,679,363 91% 139%
Total 26,549,724 44,955,183 53,400,652 69% 101%
Active
North 842,887 1,717,827 2,046,168 104% 143%
Northeast 6,637,474 9,453,959 11,361,438 42% 71%
Southeast 10,469,008 19,568,680 22,643,678 87% 116%
South 4,352,433 6,601,850 7,566,976 52% 74%
Midwest 1,779,568 3,417,930 4,220,187 92% 137%
Total 24,081,370 40,760,246 47,838,447 69% 99%
Source: Authors, based on data from SNIS.
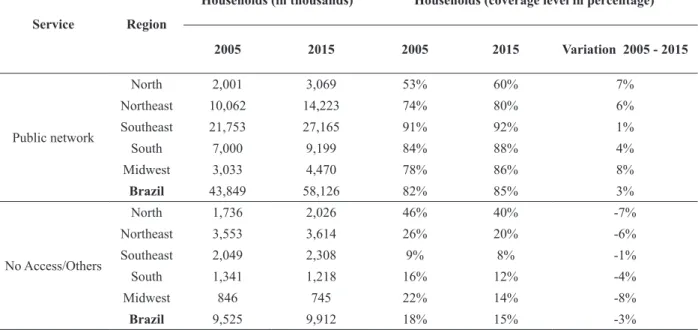
water supply, with almost 12 million people without the service (by cross-calculating Table V by the percentages in Table X). In a ten-year period, there was an improvement in national the coverage level
of 3%, from 82% to 85%; which is a residual value,
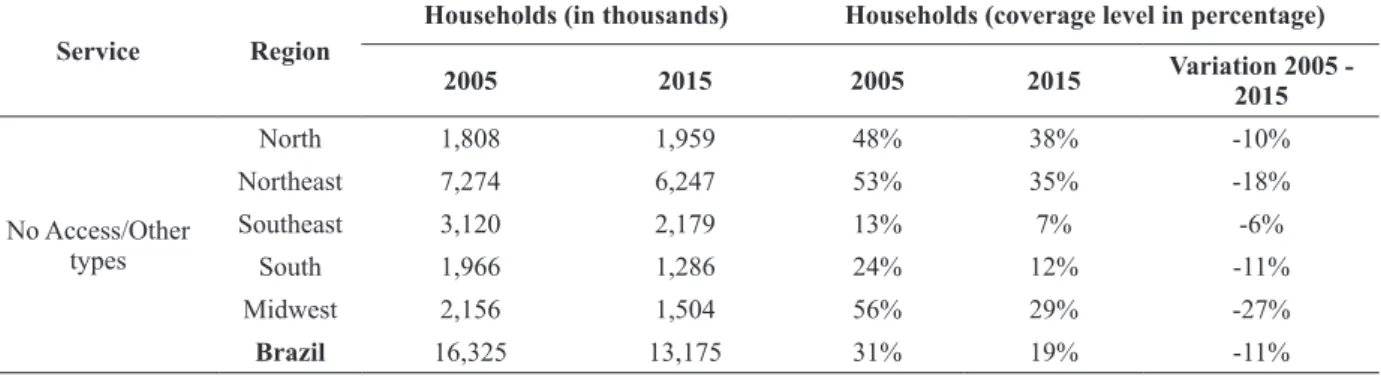
evidencing low investment rates in the sector. In Table XI, the classification under “other types” includes cesspools, rivers, ditches, other types not specified, and had no access. In fact, these destinations are not suitable for sewage and, according to Atlas de Saneamento 2011, “far from representing alternative solutions are,
rather, confirmation of the unsteadiness of sewage
collection in the country” (IBGE 2011).
Another issue to consider is that rainwater drainage is considered as part of the sewage
network infrastructure; so even when sewage
is directly released into this rainwater system, it is considered under the national index as an appropriate destination. A technical issue regarding this consolidated infrastructure is that the combined sewer system is not usually projected to support the load of the heavy rains (Reda 2006, MMA
and spread of diseases. On the other hand, there are also systems projected to receive only sewage (separate sewer systems), but these illegally and
clandestinely receive effluents from domestic and
industrial sources (Dias 2003)
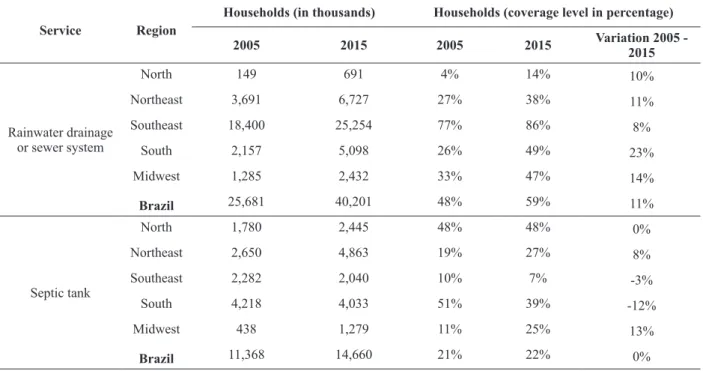
Even with these caveats, in 2015, almost 28 million households did not have access to the sewage network – by considering other types and the usage of septic tank (Table XI). The worst index is again in the North, with 14% of the households covered, but the Northeast has the largest number of households without adequate access.
Usually, the worse indexes, in any region, are recurrent in irregular settlements in urban areas or in pristine areas in rural areas. The proper provision of public services for these locations would have to consider their realities by means of implementing special projects, as will be discussed in this article. The search for regularization of the informal settlements would not be a solution for this problem because the main issue is usually the location per se (top of hills, hard-to-reach places,
alleys, and/or violent communities). Moreover, if the government stand still until the settlements are regularized, it will be a never-ending situation.
The rural electrification program is a show-case
that demonstrated that the solution must fit in with the realities of the country. If the conditions are appropriate, irregular connections of sewage
and water must be regularized as efforts of public
policies.
In a decade, there was no significant improvement in water supply in rural areas, and the main type of supply is still, in 2015, the artesian well. Considering that the sewerage network and waste management are also incipient in the rural area, artesian wells are in danger of frequent contamination. The main form of water supply in the urban environment is access to the general
network; however, it has not yet been universalized
even in ten years of providing services to the population, with little variation in the historical series (2.7%). As can be seen in Table XII, the water supply coverage levels for the rural area,
TABLE X Access to water services.
Service Region
Households (in thousands) Households (coverage level in percentage)
2005 2015 2005 2015 Variation 2005 - 2015
Public network
North 2,001 3,069 53% 60% 7%
Northeast 10,062 14,223 74% 80% 6%
Southeast 21,753 27,165 91% 92% 1%
South 7,000 9,199 84% 88% 4%
Midwest 3,033 4,470 78% 86% 8%
Brazil 43,849 58,126 82% 85% 3%
No Access/Others
North 1,736 2,026 46% 40% -7%
Northeast 3,553 3,614 26% 20% -6%
Southeast 2,049 2,308 9% 8% -1%
South 1,341 1,218 16% 12% -4%
Midwest 846 745 22% 14% -8%
Brazil 9,525 9,912 18% 15% -3%
for the 2005-2015 historical series, showed an improvement in the coverage of services by 17.7%, but remained below 50% in 2015.
Corroborating the information from the series of previous indicators, it is concluded that the greatest challenge of sanitation in Brazil is sanitary sewage (Table XIII). According to Table XIII, in 2015, a little more than half of urban properties have access to sanitary sewage
networks (68.0%); and in ten years there was only
a small improvement in the service coverage area from 56.3% to 68.0%. The urban population still uses, in 2015, precarious forms for its destination (12.4%) despite improvement in the last ten years. Considering that 85% (Table II) of the population is urban (approximately 173.5 million inhabitants),
this volume is significant.
The worst picture refers to the rural population, in which only 5.4% of the population has access to the sewage network, and most of the sewage is released in inappropriate ways (61.3%). There was an increase in sewage disposal in septic tanks in the
rural areas (of 17.5%), remembering also that this sewage is released in natura, that is, without any type of previous treatment (Table XIII).
According to the IBGE, of the 5,570 Brazilian municipalities, 2,495 do not have access to the sewer system (IBGE 2011). Both the water supply and the sewage network and treatment are precarious in Brazil, and have a direct impact on the economy, education, the environment, and health. The unsteady system contributes to the increase of GHG emissions in the country because more methane and other greenhouse gases are released into the atmosphere (IPCC 1996).
SOLID WASTE
Waste management is regulated by the National Solid Waste Policy (PNRS), which includes Law 12,305/2010 (Brasil 2010a) and Decree 7,404/2010 (Brasil 2010b). Like the water and sewage sectors, the waste sector is also operationalized by Plansab (MCID 2013), because the plan systematically encompasses sanitation services. According to this
TABLE XI Access to sewage services.
Service Region
Households (in thousands) Households (coverage level in percentage)
2005 2015 2005 2015 Variation 2005 -
2015
Rainwater drainage or sewer system
North 149 691 4% 14% 10%
Northeast 3,691 6,727 27% 38% 11%
Southeast 18,400 25,254 77% 86% 8%
South 2,157 5,098 26% 49% 23%
Midwest 1,285 2,432 33% 47% 14%
Brazil 25,681 40,201 48% 59% 11%
Septic tank
North 1,780 2,445 48% 48% 0%
Northeast 2,650 4,863 19% 27% 8%
Southeast 2,282 2,040 10% 7% -3%
South 4,218 4,033 51% 39% -12%
Midwest 438 1,279 11% 25% 13%
Law, article 54 (Brasil 2010a), open dumps should have been closed in 2014, with the possibility of being charged financial penalties due to this environmental crime, as provided by the Law of Environmental Crimes (Law 9,605/1998, art 54). However, this deadline has been subsequently postponed and, still in 2017, “the 3,000 open
dumps identified in Brazil affected the lives of 76.5
million people, bringing an economic loss of US$ 1
billion to the public coffers” (ISWA/Abrelpe 2017).
Consequently, despite the Laws, the PNRS and the Plansab, the following data describe the evolution
of the ten-year indicators as almost unchanged. It should be emphasized that solid waste disposal data are important in quantifying the trajectory of Brazilian GHG emissions for the sector, as poor management of SW means a high level of methane emissions to the atmosphere.
Table XIV shows a slight improvement in the indicators of SW directly collected from households, from 89.7% to 92.8% in ten years. Rural areas have a lower production of waste, but also have the lowest level of waste collected, 27.3%. The North and the Midwest presented the lowest
Service Region
Households (in thousands) Households (coverage level in percentage)
2005 2015 2005 2015 Variation 2005 -
2015
No Access/Other types
North 1,808 1,959 48% 38% -10%
Northeast 7,274 6,247 53% 35% -18%
Southeast 3,120 2,179 13% 7% -6%
South 1,966 1,286 24% 12% -11%
Midwest 2,156 1,504 56% 29% -27%
Brazil 16,325 13,175 31% 19% -11%
Source: Authors, based on PNAD/SIDRA/IBGE.
TABLE XI (continuation)
TABLE XII
Evolution of the coverage levels of the drinking-water network per household (in percentage and by location).
Indices in % Urban
2005 2015 Variation
2005 - 2015
Rural Urban Rural Urban Rural
Public network
North 66.9 18.0 72.2 23.1 5.3 5.1
Northeast 90.4 29.0 92.5 42.7 2.1 13.7
Southeast 96.5 28.1 96.7 26.6 0.2 -1.5
South 94.7 30.0 96.6 37.0 1.9 7.0
Midwest 88.4 15.4 94.1 14.1 5.7 -1.3
Brazil 92.5 26.8 95.2 44.5 2.7 17.7
No Access - Others
North 33.1 82.0 27.8 76.9 -5.3 -5.1
Northeast 9.6 71.0 7.5 57.3 -2.1 -13.7
Southeast 3.5 71.9 3.3 73.4 -0.2 1.5
South 5.3 70.0 3.4 63.0 -1.9 -7.0
Midwest 11.6 84.6 5.9 85.9 -5.7 1.3
Brazil 7.5 73.2 4.8 55.5 -2.7 -17.7
percentage of waste collected in rural properties (18.4% and 16.8%) in 2015 and in a 10-year period
(0.7% and 3.0%); whereas the Northeast and the
South improved the collection in rural areas (10.1% and 17.1%). Indirect collection and other types of destinations decreased for all the regions and for urban and rural areas, representing an improved situation for the period.
According to Abrelpe, there was an increase in the amount of solid waste (SW) produced and in the SW not collected for all the regions as well as for the country from 2005 to 2015 (Table XV). The Midwest is the region which present the highest increased generation of SW (71%), but the largest producer by far is the Southeast (194,790 tons/per
day). The South presented the highest percentage of amount of SW not collected (274%), but the Northeast is the one which had the highest quantity of SW not collected (11,701 tons/per day).
From 2005 to 2015, all the regions presented a smaller amount of waste dumped per day except the North, which increased this amount by 4%. In 2015, more than 82,000 tons per day were dumped in inappropriate places in Brazil and multiplying by 26 days of collection per month (Abrelpe 2011), it reaches a total of 25,602,408 per year.
For the 2005 data (Table XV), the category
“Controlled Landfill - Open Dump” included solid waste dumping; actions/places include burning or burying in the property; dumping on open land or TABLE XIII
Evolution of the coverage levels of the sewage network per household (in percentage and by location).
Indices in % Urban
2005 2015 Variation
2005 - 2015
Rural Urban Rural Urban Rural
Rainwater drainage or sewer system
North 5.0 1.0 17.7 0.8 12.7 -0.2
Northeast 36.4 1.9 49.4 3.8 13.0 1.9
Southeast 83.0 13.0 90.7 13.8 7.7 0.8
South 30.6 2.2 56.1 4.9 25.5 2.7
Midwest 38.3 1.5 51.9 1.6 13.6 0.1
Brazil 56.3 4.2 68.0 5.4 11.7 1.2
Septic tank
North 58.0 19.4 53.3 31.4 -4.7 12.0
Northeast 24.1 6.7 27.6 26.3 3.5 19.6
Southeast 9.2 14.9 5.1 32.7 -4.1 17.8
South 52.5 41.0 35.6 57.8 -16.9 16.8
Midwest 12.4 4.8 23.6 32.7 11.2 27.9
Brazil 22.4 15.5 20.0 33.0 -2.4 17.5
No Access - Other types
North 36.7 79.2 28.9 67.8 -7.8 -11.4
Northeast 39.5 91.5 23.0 69.8 -16.5 -21.7
Southeast 8.3 72.2 4.2 53.5 -4.1 -18.7
South 17.0 57.0 8.3 37.4 -8.7 -19.6
Midwest 49.3 93.8 24.6 65.4 -24.7 -28.4
Brazil 21.3 80.3 12.4 61.3 -8.9 -19.0
in public places; throwing in rivers, lakes or sea; or
other undeclared/illegal destinations. Whereas for
the other historical series the category “Landfill” is the landfills that applied all the international/
national rules for an appropriate destination of solid waste, and “Controlled Landfill - Open Dump”
included open dumps and controlled landfills, “that
do not have the necessary set of systems to protect the environment and public health” (Abrelpe 2006, 2016).
According to Table XVI, the worst situation is in the North and the Northeast as those states present the lowest collection rate of solid waste in properties and the highest inappropriate destination level when measured by households. However, there was a decrease in the coverage level of households that did not have its SW collected.
Table XVII shows that there is an increased number of municipalities presenting selective collection of SW. However, as observed by Abrelpe (2016), “although the number of municipalities
with selective collection activities is significant,
it is important to consider that these activities are often summarized in the provision of voluntary delivery points to the population or in the simple formalization of cooperative agreements with garbage collectors to perform the services.”
Brazil produced 79.9 million tons of waste in 2015 and 78.3 million in 2016 (Abrelpe 2017), respectively, with a coverage rate of 90.8% and 91%, accounting for 7.3 million tons not collected in 2015 (Abrelpe 2016) and 7 million not collected in 2016 (Abrelpe 2017). There is still a problem in
the final disposal of municipal solid waste (MSW),
which got worse from 2015 to 2016. In 2015, 58.7%
of the waste collected went to landfills, representing
a volume of 42.6 million tons. In 2016, 58.4% of
the waste collected went to landfills, representing a
volume of 41.7 million tons, with 29.7 million tons of waste inappropriately dumped. In 2016, out of a total of 5,570 municipalities, 3,331 dumped their MSW (Abrelpe 2017).
TABLE XIV
Evolution of the coverage levels of SW collected from households per household (in percentage and by location).
Indices in % Urban
2005 2015 Variation
2005 - 2015
Rural Urban Rural Urban Rural
Collected
North 83.7 17.7 93.0 18.4 9.3 0.7
Northeast 79.5 12.4 85.7 22.5 6.2 10.1
Southeast 93.3 27.4 94.5 35.8 1.2 8.4
South 94.4 25.5 96.3 42.6 1.9 17.1
Midwest 91.8 13.8 96.4 16.8 4.6 3.0
Brazil 89.7 18.5 92.8 27.3 3.1 8.8
Indirect collected - Others
North 16.3 82.3 7.0 81.6 -9.3 -0.7
Northeast 20.5 87.6 14.3 77.5 -6.2 -10.1
Southeast 6.7 72.6 5.5 64.2 -1.2 -8.4
South 5.6 74.5 3.7 57.4 -1.9 -17.1
Midwest 8.2 86.2 3.6 83.2 -4.6 -3.0
Brazil 10.3 81.5 7.2 72.7 -3.1 -8.8
TABLE XV
Amounts of solid waste (tons/per day).
Service Region 2005 2010 2015 2016 Variation
2005 - 2015
Produced
North 14,365 12,920 15,745 15,444 10%
Northeast 46,623 50,045 55,862 55,056 20%
Southeast 82,458 96,134 107,375 104,790 30%
South 19,982 20,452 22,586 22,127 13%
Midwest 10,096 15,539 17,306 16,988 71%
Brazil 173,524 195,090 218,874 214,405 26%
Collected
North 12,569 10,623 12,692 12,500 1%
Northeast 41,681 38,118 43,894 43,355 5%
Southeast 81,139 92,167 104,631 102,620 29%
South 19,643 18,708 21,316 20,987 9%
Midwest 9,743 13,967 16,217 15,990 66%
Brazil 164,774 173,583 198,750 195,452 21%
Not Collected
North 1,796 2,297 3,053 2,944 70%
Northeast 4,942 11,927 11,968 11,701 142%
Southeast 1,319 3,967 2,744 2,170 108%
South 340 1,744 1,270 1,140 274%
Midwest 353 1,572 1,089 998 208%
Brazil 8,750 21,507 20,124 18,953 130%
Landfill
North 1,049 3,718 4,545 4,429 333%
Northeast 10,782 12,960 15,688 15,449 46%
Southeast 42,644 66,084 76,345 74,642 79%
South 6,557 13,039 15,105 14,824 130%
Midwest 4,493 4,022 4,950 4,845 10%
Brazil 65,525 99,824 116,633 114,189 78%
Controlled Landfill - Open
Dump
North 7,839 6,905 8,149 8,071 4%
Northeast 29,442 25,158 28,206 27,906 -4%
Southeast 100,340 26,083 28,226 27,978 -72%
South 14,079 5,669 6,211 6,163 -56%
Midwest 10,127 9,945 11,267 11,145 11%
Brazil 96,302 73,759 82,059 81,263 -15%
TABLE XVI
Solid Waste Collection - coverage rates by households.
Type Region
Households (in thousands)
Households
(coverage level in percentage)
2005 2015 2005 2015 Variation
2005 - 2015
Collected
North 2,688 4,003 72% 79% 7%
Northeast 9,743 14,101 72% 79% 7%
Southeast 22,473 28,417 94% 96% 2%
South 7,328 9,798 88% 94% 6%
Midwest 3,379 4,795 87% 92% 5%
Brazil 45,663 61,114 86% 90% 4%
Not collected/Others
North 1,049 1,092 28% 21% -7%
Northeast 3,872 3,736 28% 21% -7%
Southeast 1,329 1,056 6% 4% -2%
South 1,013 619 12% 6% -6%
Midwest 500 420 13% 8% -5%
Brazil 7,711 6,923 14% 10% -4%
Source: Authors, based on PNAD/SIDRA/IBGE.
TABLE XVII
Number of municipalities with selective collection of SW.
Region
2005 2010 2015 2016
Yes No Yes No Yes No Yes No
North 1 448 205 244 258 192 263 187
Northeast 27 1,760 624 1,170 884 910 889 905
Southeast 140 1,526 1,326 342 1,450 218 202 265
South 274 885 923 265 1,067 124 1,454 214
Midwest 9 437 129 337 200 267 1,070 121
Brazil 451 5,056 3,207 2,358 3,859 1,711 3,878 1,692
Source: Authors, based on Abrelpe Reports, from years 2006, 2011, 2016, 2017. ASSESSMENT BY PLANSAB
According to the latest assessment report of Plansab (MCID 2015), a matrix of analysis was created so as to classify service levels from 2014 to 2015
under two categories: Appropriate Service Level;
and Deficit, which includes Precarious Service
Level; and No Service (Table XVIII).
Data collected also from PNAD and SNIS were used to categorize the results of Plansab from 2013 to 2015 (Table XVIII). It can be seen that when considering the quality of the services provided,
the indices are worse (Table XIX) than when only considering the access or not to the public service for the water services (Table VIII) and to the appropriate solid waste management (Table XVI). As was analysed in Table VI, the treatment of the sewage collected is higher than the treatment of sewage generated.
GREENHOUSE GAS EMISSIONS
Convention on Climate Change (UNFCCC). This commitment was nationally regulated by Law 12,187/2009 (Brasil 2009), known as the National Policy on Climate Change (PNMC). Although it established sectoral plans to implement policies for GHG mitigations, there is no sectoral plan for waste and sewage. There are only reduction targets considered with industrial processes under the PNMC (Brasil 2009).
The evolution of GHG emissions for the “Waste” sector reflects the “grave absence and precariousness” (IBGE 2011) of public policies in the country in this area. According to Table XIX, the indicators of 2014 demonstrate that the Energy Sector presented its greatest variation in the period of 1990 to 2014 (55.2%). The agricultural sector
has occupied third place in Brazil’s emissions since
2012, the year in which the energy sector began to occupy second place. The agricultural sector
presents smaller variations than the energy sector, despite the growing agricultural production in the country, which is mainly explained by the constant
efficiency gain in the Brazilian agricultural industry.
The biggest drop in emissions has been in the Land Use, Land-Use Change and Forestry (LULUCF) sector, which is directly related to a series of command-and-control regulations, mainly avoiding deforestation in the Amazon. Despite the reduction in the LULUCF emissions, it still contributes 18.1% of the total emissions. Given this weight, a study is necessary to deepen the knowledge of the impacts of agriculture and urbanization on deforestation.
There was a low participation of the Waste
sector in total emissions, but a significant increase
for the historical series 1990-2014 (41%), which is the largest increase among all sectors (Table XX).
TABLE XVIII Plansab assessment - categories.
Component Appropriate service Deficit
Precarious service No service
Water supply Supply of drinking water by distribution network or by well, spring
or cistern, with internal piping, in any case without intermittency (shutdowns
or interruptions).
Among the properties with water supply by network and well or source, the parcel of
households that: - Lacks internal plumbing; - Presents water quality below standards; - Has an intermittent or prolonged rationing;
- Use cistern for rainwater, which supplies water without health impacts and/ or insufficient amount for health protection;
- Use of reservoir supplied by car truck.
All situations not included in the service definitions and which constitute practices considered
inadequate. Sanitary sewage
– Collection of sewage, followed by treatment;
– Use of septic tank.
– Collection of sewage, not followed by treatment;
– Use of cesspool.
Solid waste management
- Direct collection in the urban area, with daily frequency or on alternate days and final environmental disposal
of waste;
- Direct or indirect collection in the rural area and environmentally
appropriate disposal of waste.
Among the properties with SW collection, the parcel of households that:
- in the urban area, with indirect collection or with direct collection, whose frequency
Table XXI shows the consolidated GHG emissions for the Waste sector subdivided according to the IPCC Guidelines (IPCC 1996). The Solid Waste Disposal (SWD) sector is the largest source, accounting for 52% in 2014. The precariousness of
the population’s housing infrastructure is reflected
in these emissions, in which 42.7% of the sewage is treated and only 50.3% of the population is served with an appropriate sewer system in 2015 (Table
VI). In addition, more than 40% of the waste is dumped (Table XVI).
DISCUSSION
Sanitation is a major Brazilian challenge, and new infrastructure is predominantly dependent on public investments, and on partial or full concessions (Brasil 2007). Sanitation data show
TABLE XIX
Plansab assessment - categories.
Type of service
Appropriate service Precarious service No service
in
thousands %
in
thousands %
in
thousands %
Water supply (2014) 112,257 55.4 81,398 40.1 9,197 4.5
Water supply (2015) 105,547 51.7 90,388 44.2 8,431 4.1
Sanitary sewage (2014) 103,898 51.2 87,680 43.2 11,274 5.6
Sanitary sewage (2015) 111,895 54.8 81,883 40 10,588 5.2
Solid waste management (2014) 122,756 60.5 57,649 28.4 22,446 11.1
Solid waste management (2015) 127,365 62.3 54,190 26.5 22,813 11.2
Source: Plansab Assessment Report, 2015 (MCID).
TABLE XX
Greenhouse Gas Emissions (in Gg of CO2eq GWP-AR2).
Years Energy Industrial processes Agriculture Waste LULUCF Total
1990 185,812 52,296 286,995 26,006 792,035 1,343,144
2000 284,281 75,950 328,367 38,694 1,265,607 1,992,899
2004 302,771 83,243 386,266 44,518 2,635,701 3,452,499
2010 371,096 90,155 407,072 54,127 349,176 1,271,626
2011 385,006 94,961 418,721 55,901 282,742 1,237,331
2012 419,090 94,166 414,579 57,046 252,013 1,236,895
2013 447,008 93,627 419,964 60,425 389,837 1,410,861
2014 469,826 94,480 424,469 62,788 233,139 1,284,702
Variation 1990-2014 153% 81% 48% 141% -71% -4%
Variation 2004-2014 55% 13% 10% 41% -91% -63%
Variation 2010-2014 27% 5% 4% 16% -33% 1%
% 1990 14% 4% 21% 2% 59% 100%
% 2000 14% 4% 16% 2% 64% 100%
% 2004 9% 2% 11% 1% 76% 100%
% 2014 37% 7% 33% 5% 18% 100%
that over a period of ten years the situation did
not evolve significantly in most regions of Brazil,
mainly in the poorest regions of the country: in the North, where most indexes regressed, and in the Northeast, with the largest underserved residents.
According to the World Health Organization (2008), each “$1 investment in sanitation will give a return of $9”. It is so important that the universal access to water and sanitation is an international commitment under the Sustainable Development Goals (SDG), and SDG 06, “Clean water and Sanitation for all”, aims at ensuring availability and sustainable management of water and sanitation for all by means of achieving the following targets (United Nations 2015):
6.1. By 2030, achieve universal and equitable
access to safe and affordable drinking water for all;
6.2. By 2030, achieve access to adequate and equitable sanitation and hygiene for all and end
open defecation, paying special attention to the needs of women and girls and those in vulnerable
situations;
6.3. By 2030, improve water quality by reducing pollution, eliminating dumping and minimizing release of hazardous chemicals and materials, halving the proportion of untreated wastewater and substantially increasing recycling
and safe reuse globally;
6.4. By 2030, substantially increase water-use
efficiency across all sectors and ensure sustainable
withdrawals and supply of freshwater to address water scarcity and substantially reduce the number
of people suffering from water scarcity;
6.5. By 2030, implement integrated water resources management at all levels, including
through transboundary cooperation as appropriate;
6.6. By 2020, protect and restore water-related ecosystems, including mountains, forests,
wetlands, rivers, aquifers and lakes;
6.a. By 2030, expand international cooperation and capacity-building support to developing countries in water- and sanitation-related activities and programmes, including water harvesting, desalination, water efficiency, wastewater
treatment, recycling and reuse technologies;
6.b. Support and strengthen the participation of local communities in improving water and sanitation management.
On the other hand, as presented throughout this paper, Brazil is already near to accomplishing SDG
07 (Table I): “affordable and clean energy”, which
aims at ensuring access to affordable, reliable, sustainable, and modern energy for all by means of the following targets:
7.1. By 2030, ensure universal access to
affordable, reliable and modern energy services;
7.2. By 2030, increase substantially the share
of renewable energy in the global energy mix; 7.3.
By 2030, double the global rate of improvement in
energy efficiency; TABLE XXI
GHG from Waste (in Gg of CO2eq GWP-AR2).
Years Efluents Solid
Waste Total
1990 8,675 17,331 26,006
2000 14,459 24,236 38,694
2004 18,286 26,232 44,518
2010 26,082 28,045 54,127
2011 26,786 29,116 55,901
2012 27,145 29,901 57,046
2013 28,168 32,257 60,425
2014 30,340 32,448 62,788
Variation
1990-2014 250% 87% 141%
Variation
2004-2014 66% 24% 41%
Variation
2010-2014 16% 16% 16%
% 1990 33% 67% 100%
% 2000 37% 63% 100%
% 2004 41% 59% 100%
% 2014 48% 52% 100%
7.a. By 2030, enhance international cooperation to facilitate access to clean energy research and technology, including renewable energy, energy efficiency and advanced and cleaner fossil-fuel technology, and promote investment in energy
infrastructure and clean energy technology;
7.b. By 2030, expand infrastructure and upgrade technology for supplying modern and sustainable energy services for all in developing countries, in particular least developed countries, small island developing States, and land-locked developing countries, in accordance with their respective programmes of support.
Rural electrification had been the main bottleneck in the universalization of this service for years because rural properties are distant and hard-to-reach, and rural dwellers usually do not have financial resources to pay for the infrastructure needed. Like the sanitation services, electricity is also a public service in Brazil, which is provided by the governments or utility companies. Analysing the history and implementation of the successful program “Electricity for Everyone” (LpT), a
federal rural electrification program, will bring new insights to sectoral efforts to universalize sanitation.
The main assumption of this article is that the example demonstrated by the success of universalization of rural electrification shows that there is no universalization of a public service without the strength of the State. For the universalization of sanitation, the same driver applies. In fact, as Heller and Castro argue (2013),
sanitation is a citizen’s right and a State’s duty
according to the principles of universality and equity in which, according to the authors:
“Every citizen, regardless of his or her social class, gender, ethnic origin or any other factor of social differentiation, has an unrestricted right to goods and services deemed essential to the maintenance of life in a civilized society... Access to essential services is a fundamental right, which
cannot be subject to the individual ability of users to pay and must be guaranteed by the State.”
The purpose of this discussion is to analyze the processes carried out by the State that brought about the universal access to electricity, which can serve as a benchmark for the universal access to sanitation.
One of the major differences between the universal access to electricity and to sanitation is that there is rarely a lack of access to energy services in urban areas. Even in the most deprived areas, electricity wires can reach properties as they are pulled from the nearby infrastructure. The problem of access to energy is primarily in the rural environment. Sanitation demands more complex
works or logistics, thus afflicting rural and urban
areas. Consequently, as the sanitation infrastructure does not reach deprived urban communities, sewage is thrown in nearby waters, waste is dumped on the slopes of hills and water is taken physically by its residents to their homes.
According to the 2010 Census (IBGE 2010a), there are 3,224,529 permanent households, with more than 11 million inhabitants, located in these poor communities, the so-called “subnormal clusters” (slums, “favelas”, poor communities, villages, among others), characterized by extreme shortages in the provision of public services (IBGE 2010b).
For many years, there was a huge shortage of electricity in the rural areas of the country. The 2000 Census reported almost 11 million people without energy (Table I). In addition to the huge contingent of families without access to electricity in about 4.8 million agricultural establishments, 2.9
million had not yet been electrified according to the
TABLE XXII
Comparative table of public services provided in 2015 for permanent residents.
Region Total (in thousands) Provision
of Service Water Sewage
Septic tank
connected to sewage
network
Solid
Waste Electricity
Brazil
Households 68,037 Yes 58,125
(85.4%)
40,201 (57.1%)
4,254 (6.2%)
61,114 (88.8%)
67,840 (99.7%)
Residents 204,053 Yes 172,492 116,531 12,687 181,249 203,493
Urban 172,811 No 11,241 57,932 161,473 2,152 46
Rural 31,242 No 20,320 29,591 29,894 20,654 513
North
Households 5,095 Yes 3,069
(60.2%)
691 (13.6%)
459 (9%)
4,003 (78.6%)
5,004 (98.2%)
Residents 17,455 Yes 10,448 2,282 1,533 13,562 17,161
Urban 13,085 No 3,670 10,838 11,678 366 2
Rural 4,369 No 3,335 4,334 4,243 3,527 291
Northeast
Households 17,837 Yes 14,223
(79.7%)
6,727 (37.7%)
920 (5.2%)
14,101 (79.1%)
17,758 (99.6%)
Residents 56,477 Yes 44,585 20,427 2,831 43,813 56,261
Urban 41,269 No 3,201 21,401 38,724 1,229 28
Rural 15,208 No 8,691 14,649 14,922 11,425 188
Southeast
Households 29,473 Yes 27,165
(92.2%)
25,254 (85.7%)
845 (2.9%)
28,417 (96.4%)
29,459 (100%)
Residents 85,610 Yes 78,676 72,816 2,515 82,369 85,581
Urban 79,716 No 2,653 7,731 77,718 424 3
Rural 5,893 No 4,280 5,062 5,376 2,817 25
South
Households 10,417 Yes (88.1%)9,199 (48.9%)5,098 (16.2%)1,685 (94.1%)9,798 (99.9%)10,409
Residents 29,148 Yes 25,629 13,968 4,759 27,352 29,135
Urban 24,945 No 858 11,183 20,527 75 9
Rural 4,203 No 2,661 3,997 3,862 1,721 4
Midwest
Households 5,215 Yes (85.7%)4,470 (46.6%)2,432 (6.6%)345 (91.9%)4,795 (99.9%)5,211
Residents 15,363 Yes 13,154 7,037 1,049 14,152 15,355
Urban 13,795 No 858 6,779 135 59 4
Rural 1,568 No 1,352 1,548 2,087 1,151 4
is 99.7%, with 46,000 inhabitants living in urban areas and 513,000 in rural areas.
The number of residents not served by the sewer system is higher in urban areas (more than 57 million) than in rural areas (more than 29 million), mainly in the Northeast, respectively over 21 million and more than 14 million. Nationally, there are more than 100 million people without direct access to a sewage network, considering people using septic tanks.
Besides the underserved sewage services, more than 31 million people do not have access to a water supply network (Tables III and X), and more than 22 million do not have their solid waste collected (Tables VI and X). These numbers are much higher than those that started the electricity universalization program by the 2000 Census (IBGE 2000).
Rural electrification efforts date back a long time, but the most effective ones in Brazil were the
“Electricity for the Countryside” (from 1999/2000 to 2003) and “Electricity for Everyone” (from 2003 up to now). “Electricity for the Countryside” had the objective of bringing energy services to 1 million households (or 5 million inhabitants) in four years, beginning in 1999 and being coordinated by the Ministry of Mines and Energy (MME). The
financial operation of the program was performed
by a public-private partnership, making use of a special fund of the electric sector called Global Reversal Reserve (Reserva Global de Reversão - RGR) of US$540 million. The RGR was formed by charges paid by the electric utilities and passed on to consumers, with a complement of US$280 million from the executors and entities of the Union - states and municipalities (Sugimoto 2002). The RGR was created by the Decree 41,019/1957 (Brasil 1957), and it was used for promoting “Electricity for Everyone”, as “for works of improvement and expansion of the electric system, in the areas of
power generation, transmission and distribution”;
it was administered by Eletrobras until May 2017.
This first significant electrification effort was
a partnership between the federal government,
electric utilities, rural electrification cooperatives
and local governments, with implementation in localities with a HDI of less than 0.500. The main bottleneck to the program was the need for payment
of the new facilities by final consumers (Fournier
and Penteado 2008), which either indebted an already poor population or made new connections impossible. However, the most important part of this program is the political decision to bring electricity to the needy population with contractual goals for each electric utility. This is an incredible paradigm shift that was to take energy services only to the richest population (Sugimoto 2002).
The on-going program, “Electricity for Everyone”, was launched at the end of 2003 and
aimed to bring energy to 10 million people; this,
according to the 2000 Demographic Census, would universalize its access. The priorities of the program were:
“Communities enrolled in federal social programs, rural settlements, indigenous communities, quilombolas (communities of
former slaves’ descendants), communities located
in extractive reserves or in areas of electricity generation or transmission of electricity, whose responsibility is not the electric utility provider, in addition to schools, health posts and community water wells. The services of the program are totally free, providing for the installation in homes of up to three points of light (one per room), two sockets, conductors, light-bulbs and other necessary materials” (MME 2010).