Urban Waters
C
ARLOSE
.M
.T
UCCIUrban development
Urban structure
U
rban development accelerated in the second half of the 20th centurywith the concentration of the population in reduced space. This triggered greater competition for the same natural resources (land and water) and led to destruction of natural biodiversity. The environment formed by natural space and by the population (socio-economic and urban) is a living and dynamic being that generates a set of interconnected effects, which if not controlled, can lead the city to chaos.
The objective of sustainable urban development is to improve the quality of life of the population as well as environmental conservation. It is also essentially integrating to the degree to which good quality of life is only possible in a well conserved environment that can meets the needs of the population supporting the harmony of man and nature.
The principal components of urban management are:
•Land use planning and management: by definition this involves the
developmentof a Master Plan to determine how the city should be
occupied and the corrections that need to be made in relation to the past and present;
•Road, water, energy, communication and transportation
infrastructure: planning and management of this infrastructure can be implanted by public or private agencies, but which should be regulated by a municipality;
•Socio-environmental management: the management of the urban environment is conducted by municipal, state or federal entities, according to the institutional structure. The management involves the evaluation and approval of projects, monitoring, inspection and research so that urban development is socio-environmentally sustainable.
Indicators
Urban systems1 are primordially areas of consumption and housing.
urban population will be in Asia and 13.4%, in Latin America and the Caribbean. The world is becoming increasingly urban because of economic development, generating pressure on the environment occupied by urbanization.
The principal indicators of urban development are:
•Populationfactors:growthrate,migrationandurbandensiication; •Economic:income,grossproductandproductionproile;
•LandUse:distributionbytypeofuseofurbanspaceinresidential, commercial and industrial, or public spaces.
Urbanization increases with economic growth, as the profile of income is altered and employment concentrated more in services and industry than in agriculture. With urbanization, the birth rate tends to decrease because of various social factors.
Urban growth in recent decades has transformed Brazil into an essentially urban country (83% of the population is urban). This process took place in particular in the Metropolitan Regions (MR) and in the cities that became regional centers. The MRs has a principal nucleus with various neighboring cities. The growth rate of the nucleus of the MR is small, while the growth of the periphery is very high. Cities with more than one million inhabitants grow at an average annual rate of 0.9%, while regional cities with population between 100,00 and 500,000 (medium-size cities according to Ipea/IBGE (MMA, 2000)grow at a rate of 4.8% (IBGE, 1998). All the inadequate processes of urbanization and environmental impact that are found in the MRs are reproducing in the medium size cities. Cities with populations above 100,000 people account for 51% of the Brazilian population, distributed in 212 municipalities, while the thirty largest municipalities (larger than 500,000), represent 27% of the population.
During the past century, urban development created standards of urban concentration. In the large cities, there was a process of urban decentralization in direction of the periphery, leaving the centers of the cities unpopulated and in decline. Difficulties with transportation routes, increased traffic and deterioration in transportation have led to changes of attitude in this process.
In some Brazilian cities, approximately half of the population lives in irregular or informal areas (MMA, 2000). The growth of the population living in slums has been significant, and their increasing density is cause for concern. The population growth occurs particularly among the low income population, and the population in slums should double in the next 10 years, reaching 13.5 million people. This reflects a housing deficit that is the result of the economic situation, while the participation of the State in the increase of housing was some 27% (MMA, 2000).
The principal problems related to infrastructure and urbanization in the developing countries, and in particular those in Latin America, are:
and air pollution and flooding. These unsuitable environmental conditions reduce health conditions and the quality of life of the population, cause environmental impacts and are the principal limits to development.
•Increase of the periphery of cities in an uncontrolled manner by rural migration in search of employment. These neighborhoods generally lack security, traditional infrastructure for water, sewage, drainage, transportation and collection of solid waste and are dominated by criminal groups usually linked to drug trafficking.
•Urbanization is spontaneous and urban planning is conducted for the portion of the city occupied by the middle and upper income
population. In illegal and public areas, there is invasion and occupations
occur in areasof risk such as those with flooding and mudslides, with frequent deaths during rainy periods. A significant portion of the
population lives in some type of slums. Therefore, there is the formal
and the informal city. Urban management general reaches the former.
Impacts on urban waters
Urban planning is conducted for the formal city, while for the informal city trends of its occupation are analyzed. The principal problems related to water infrastructure in the urban environment are:
•Lackofsewagetreatment:alargepartofthecitiesoftheregiondonot have sewage treatment and release effluents into storm sewers, which flow to urban rivers (the case in most Brazilian cities);
•Othercitiesopttoimplantsanitarysewagesystems(oftenwithout treatment), but do not implement urban drainage networks and suffer from frequent floods with the increase of impervious surfaces;
•Occupationoftheloodplain,sufferingfrequentloods;
•Imperviousareasandchannelizationofurbanriverswithincreaseof flood stage (seven times) and its frequency; increased amount of solid residues affecting the quality of river water of rivers close to urban areas; •Thedeteriorationofwaterqualitybecauseoflackoftreatment
of effluents has created potential risks to the water supply for the population in various situations, and the most critical has been the occupation of the areas of contribution of urban supply reservoirs which, suffering from eutrophication, present health risks to the population. There is a limited view of what is integrated management of urban land and its infrastructure, and a large portion of the problems highlighted here were generated by one or more of the factors highlighted below:
•Poor conceptual base among engineering professionals for the planning and control of the systems: an important portion of the engineers who act in urban areas do not have up to date information about environmental issues and generally seek structural solutions that alter the environment, creating an excess of impermeable areas and a consequent increase of temperature, flooding, pollution and other problems;
•Sectorialviews of urban planning: planning and development of urban areas are conducted without considering factors related to the different components of water infrastructure.
An important portion of the professionals who act in this area have a limited sectorial view;
•Lack of managerial capacity: municipalities do not have the structure for the planning and management of the different aspects of water in the urban environment.
Urban waters
Urban waters encompass the water supply system and sanitary sewage, urban drainage and river and stream flooding, the management of total solids, with the goals of public health and environmental conservation. This section first presents a historic view of the development of urban waters.
Phases of urban waters
Agricultural society was formed by small groups or centers that converged on today’s cities. Until the 20th century, a great challenge in the cities was to avoid the proliferation of diseases, especially those caused by sanitary conditions created by the effluents of the population, which contaminated their drinking water sources, creating ideal conditions for the proliferation of infectious diseases.
The supply of water from secure sources and the collection of sewage and its release downstream (without treatment) from the city’s water source, was designed to avoid diseases and their effects, but wound up transferring the
impacts downstream. This is called the hygienist phase. Urban growth accelerated
after the Second World War, when there was a population explosion known as the baby boom. This process was followed by accelerated urbanization, leading a high portion of the population to the cities, resulting once again in the collapse of the urban environment due to the non treated effluents and from air pollution.
was not sustainable to continue the construction of drainage works that increased the flow due to urbanization, such as the channeling of natural rivers. Attempts were made to revise procedures and use buffering systems instead of channeling.
This has been denominated the corrective phase of urban waters. Despite these actions, it was found that part of the pollution persisted, due to urban and rural flooding, called pollution from diffuse sources. Since the 1990’s, these countries have invested in sustainable urban development policy based on treatment of urban and rural pluvial waters, conservation and pluvial flow and tertiary treatment of effluents for the removal of nitrogen and phosphorus that cause eutrophication of lakes. The base of the developments in land use is the implementation of urbanization in order to preserve the natural
flow path and give priority to infiltration. This phase has been called sustainable
development (Table 1).
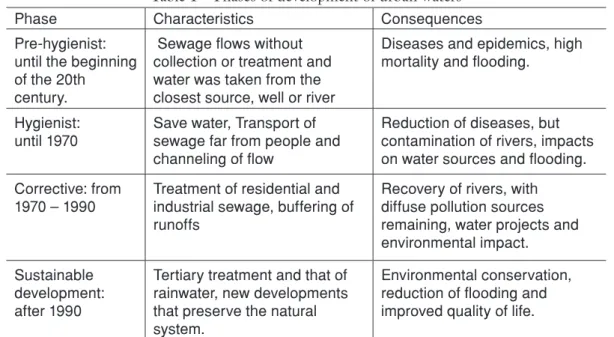
Table 1 – Phases of development of urban waters Phase Characteristics Consequences
Pre-hygienist: until the beginning of the 20th
century.
Sewage flows without collection or treatment and water was taken from the closest source, well or river
Diseases and epidemics, high mortality and flooding.
Hygienist: until 1970
Save water, Transport of sewage far from people and channeling of flow
Reduction of diseases, but contamination of rivers, impacts on water sources and flooding.
Corrective: from
1970 – 1990 Treatment of residential and industrial sewage, buffering of runoffs
Recovery of rivers, with diffuse pollution sources remaining, water projects and environmental impact.
Sustainable development: after 1990
Tertiary treatment and that of rainwater, new developments that preserve the natural system.
Environmental conservation, reduction of flooding and improved quality of life.
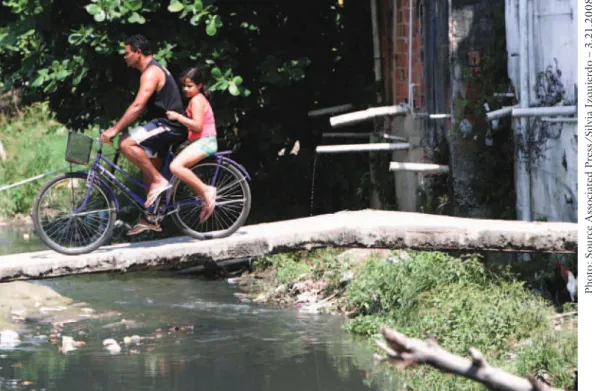
Cities in developing countries are found in various stages. Initially, when the population was small, water supply came from wells or from a nearby body of water and sewage was released in storm sewerage (when found) or they evolve to black wells or septic systems. This risks contaminating drinking water with sewage, which is heightened when the land has a low capacity for infiltration. In this situation, cesspools do not function and sewage flows through the streets or through storm sewers. This stage is previous to the hygienist stage and produced the proliferation of water born disease. In this pre-hygienist stage, diseases such as diarrhea are the principal cause of child mortality.
Water and sewage
Water and sewerage services in Brazil are summarized in Table 2. One can observe that the water supply coverage in Brazil is high, but the coverage of sewage collection and treatment is low.
Table 2 – Coverage of water supply and sewerage in %
Type Urban Rural Total
Coverage D5 Coverage D5 Coverage D5
Population 1 (%) 152
(83%) % 31,6 (17%) % 183,60 %
Water Supply1 (%) 91,95 8,15 88,443 11,56 91,35 8,65
Sewage
Collection (%) 77,22 22,78 18,43 81,57 67,10 32,9
Network (%) 54,27 4,08 45,63
Sewage
Treatment 2 (%) 28,2
4 81,8
Source: Adapted from Esbe (2006) and SNIS (2004).
1. Proportion obtained according to households in IBGE census for 2005; 2. Obtained as proportion of entities sampled by SNIS; 3Water supply coverage +safe water source; 4. This percentage refers to the total collected and not the total sewage; 5. Service deficit.
P
h
o
to
: S
o
u
rc
e A
ss
o
ci
at
ed P
re
ss
/
S
il
v
ia I
z
q
u
ie
rd
o – 3
.2
1
.2
0
0
8
Water supply services suffer from a number of chronic problems: the preservation of urban water sources, water lost in distribution and a lack of rationalization of the use of water at a domestic and industrial level.
Urban development has produced a cycle of contamination, generated by the effluents of the urban population, which include domestic and industrial sewage and rainwater runoff. This process is due to:
•Releaseofuntreatedsanitarysewageinrivers,contaminatingthem. •Stormsewerstransportalargequantityoforganicpollutionandmetals
that reach the rivers in rainy periods.
•Contaminationofundergroundwaterbyindustrialanddomestic
effluents, by means of cesspools, leaks from sanitary sewage systems and storm drains, among others.
•Depositsofurbansolidwastethatcontaminatessurfaceand underground waters, functioning as permanent sources of contamination.
•Theoccupationofurbanlandwithoutcontrolofitsimpactonwater resources.
Over time, locations that have water supply tend to reduce the quality of their water or demand greater chemical treatment of the water supplied to the population. Therefore, even if there is now good water supply coverage in Brazil, it can become compromised if measures to control the cycle of contamination are not taken.
Legislation for the protection of water sources has been approved in most Brazilian States protecting the hydrographic basins used to supply cities. In these areas, urban land cannot be used in a way that compromises the quality of drinking water supplies.
With the growth of cities, these protected areas suffer pressure from occupations because of high real estate values in the region and by the lack of interest among landowners to protect the areas, given that they lose value because of the protections, yet the landowners must pay taxes. These areas are invaded by low income populations and the immediate consequence is increased pollution. Many landowners encourage invasions to be able to sell their property to the government.
The principal lesson that can be drawn from this scenario is that upon declaring that the hydrographic basin of the water source has public utility, it should be purchased by the government or economic value should be created for the property, through the generation of an indirect market for the region (environmental compensation market, development rights
per month with the agreement of the owner to preserve the area in its natural conditions. The rental value would represent an increased cost on the water bill from 5% - 15%. This increase is the price to be paid to guarantee the quality of the water over time.
The coverage of the sewage collection is 77% if the use of septic tanks are considered (Table 2) but attendance by sewage treatment is low, which compromises water quality, since water sources are contaminated. Considering the total demand of the population for water, the amount that is treated before
being released into rivers is certainly below 15%.2 This results in seven to 11
thousand tons3 of BOD released each day in Brazilian water systems. This
pollution provokes waterborne diseases and the deterioration of the natural environment. Each resident is receiving an environmental subsidy because they do not pay for the impacts they cause. In Brazil, in recent years, sanitation companies have invested in sewage collection systems and treatment stations, but the portion of the volume generated by the cities that is effectively treated before reaching the rivers is still very small. Some of the questions this raises are the following:
•Whensewagenetworksareimplementedordesigned,connections with existing houses or condominiums is often not considered. For this reason, the networks do not collect the sewage for which they are designed and the treatment stations do not receive the sewage for which they have capacity. The design was prepared improperly or was not executed as it should have been because the sewage continues to flow through storm system.
•Sincemanyofthecompanieschargefortheserviceofcollectionand treatment, even if the treatment is not realized, what interest do the companies have in completing the coverage of sewage collection and treatment? Another frequent situation is that of increasing the collection without treatment, aggravating the problem to the degree that it
concentrates the pollution in rivers. Likewise, what is the interest of the company in reducing losses if it can transfer the costs to the final price? How can the company have an interest in reducing demand for water
through rationalization programs, if this would represent lower income? Note the lack of efficiency indicators for the services or of compensations to more efficient consumers who reduce their consumption.
•Whenasystemisimplementedtochargeforpollution,whowillpaythe penalties for the pollution generated?
These questions are generally related to the management of services and socioeconomic development.
Urban drainage and urban flooding
•Flooding of areas near rivers: these are natural floods that take place in the largest bed of rivers because of temporal and spatial changes in precipitation and flow in the river basin;
•Floods due to urbanization: these are floods that occur in urban drainage because of the impervious surfaces, channeling of flow or other obstructions to the flow.
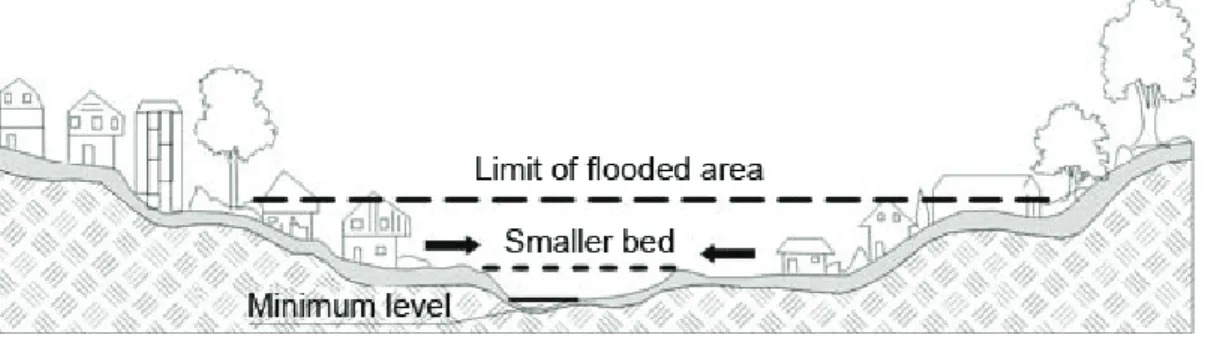
Floods in areas near rivers – Rivers generally have two beds: the smaller bed, where the water flows most of the time, is limited by the risk of 1.5-2 years. The floods occur when the flow reaches levels higher than the smaller bed, reaching the larger bed. The levels of the larger bed identify the magnitude of the flood and its risk. The impacts from the flooding occur when this risk area is occupied (Figure 1). This type of flooding generally occurs in medium and large river basins (> 100 km2).
Figure 1 – River bed characteristics.
These conditions occur because of the following actions:
•IntheMasterPlanforUrbanDevelopmentofcities,thereisusuallyno restriction concerning the occupation of flood risk areas, a number of years without a flood is sufficient for these areas to be subdivided for urban occupation.
•Invasionofareasnearriverbanks,whichbelongtothegovernment,by the low income population.
•Theoccupationofareasofmediumrisk,withlowerfrequencylooding, but when there is flooding, significant harm is inflicted.
To try to change this scene, a state or federal program is needed to technically support the solutions of the municipalities and to educate the population, in addition to joint actions with banks that finance projects in risk areas.
Floods caused by urbanization –Floods occur at increased frequency and magnitude due to the impervious surfaces and the construction of storm sewage systems. Urban development can also produce obstructions to flow, such as landfills, bridges, improper drainage, obstructions to the flow in pipes and sedimentation. These floods are generally seen as local because they involve small river basins (< 100 km2, and frequently river basins as small as < 10 km2).
To the degree that a city becomes urbanized, the following impacts usually occur:
•Amultipleincreaseinthemaximumlows(Figure2)andoftheir frequency due to the increased capacity of flow through pipes and channels and impervious areas.
•Increasedproductionofsedimentsbecauseofthelackofprotectionon the surface and because of the production of solid waste.
•Thedeteriorationofthequalityofsurfaceandundergroundwater,due to the washing of streets, transportation of solid waste and of illegal connections to the sanitary and storm sewage systems.
•Becauseofthedisorganizedimplantationofurbaninfrastructure,such as: (a) bridges and embankments for roads that obstruct water flow; (b) reduction of the section of flow by landfills for bridges and construction in general; (c) obstruction of rivers, canals and pipes by garbage and sediment; (d) poorly planned and or executed drainage projects, with size that decreases downstream drainage without sanitary sewage treatment, and others.
Total Solids
The two principal types of solids are sediments generated by soil erosion,
due to precipitation and the runoff system, and solid waste produced by the
population. The sum of these two components is called total solids.
In urban development, distinct stages of production of solid material in the urban drainage are found, as follows:
a) pre-development stage: the river basin naturally produces a quantity of sediments transported by the rivers due to the natural functions of the hydrological cycle;
b) initial urban development stage: when there is modification in the coverage of the river basin, because of the removal of its natural protection, the ground remains unprotected and erosion increases in the rainy periods, increasing the production of sediments. Examples of this situation are: when a subdivision is implanted, the soil remains unprotected; unpaved streets; erosion from the increased velocity of the flow upstream from the urban areas; in construction projects because of lack of management of worksites where there is movement of earth. This volume is transported by the surface flow to the rivers. In this phase,
there is a predominance of flows and little production of garbage; c) intermediary stage: part of the population is established, there is still
substantial movement of earth because of new construction. Due to the established population, there is also a portion of solid waste that is added to the sediments;
d) developed area stage: in this phase practically all of the urban surfaces are consolidated, resulting in a residual production of sediments due to the non-impervious areas, but the production of urban garbage reaches its maximum with the urban densification.
Quality of pluvial water
The quantity of water in the storm sewerage has a high pollutant load because of the flow level involved. The volume of this flow is more significant at the beginning of floods. The first 25 mm of surface flow generally transports a
large portion of the polluting load4 from stormwater (Schueller,1987).
The stormwater water quality is assessed by parameters that characterize the organic pollution and the quantity of metals. Schueller (1987) reports that the event average concentration is a characteristic of each drainage area.
have allowed the use of storm sewerage to transport sanitary sewage, which can be an inadequate solution since this sewage is not treated. When the sanitary system is built, there is great difficulty removing the existing connections to the storm system, which in practice results in two mixed systems with different load levels.
The water quality of the storm system depends on various factors: urban cleaning and its frequency; intensity of precipitation and its temporal and spatial distribution; the time of year and the type of use of the urban area.
Urban water management
The management of actions within the urban environment can be defined according to the relationship of dependency on water in the watershed or from the administrative jurisdiction of the municipality, state or nation. The trend in water resource management has been to work at the level of the hydrographic basin. Nevertheless, land management is conducted by a municipality or group of municipalities in a Metropolitan region. The
management can be conducted according to the definition of geographic space outside and inside a city.
Watershed management plans have been developed for large watersheds (> 1.000 km2). In this situation, there are various cities that interfere in each others’ activities, transferring impacts. It is difficult for a watershed plan to involve all the measures of each city, but it should regulate the conditions that
cause a transfer of impactsoutsidea city, such as the quality of its effluents and
alterations in quantity. The instrument for managing water quality outside of a city, and which is already required by law, is the classification of a river within one of the categories established by CONAMA (Brazilian regulation of environment). Nevertheless, these categories do not establish controls over the increase of flow because of urbanization.
Environmental management within a city involves actions within the
municipality to attend the external conditions foreseen in the Watershed
Management Plan to avoid impacts. These conditions generally seek to minimize the impacts of quantity and improve the water quality in the entire watershed, in addition to internal conditions that seek to avoid the impacts to the population in the city itself. For these two spaces there are managers, the instruments used and the management goals, as described in Table 3. The global construction of this management structure faces some difficulties:
•Limitedcapacityofthemunicipalitiestoundertakethemanagement, found in most cases.
•Thewatershedmanagementsystemisstillnotaconsolidatedrealityin most South American countries.
Table 3 – Management space of urban waters
Space Domain Managers Instrument Characteristic Watershed1 State or
federal government
Committee and agencies
Watershed Plan Management of water quantity and quality in the rivers of the watershed, without transferring impacts.
Municipality2 Municipality or Metropolitan
Region
Municipality Master Plan and Integrated Urban Plan for Drainage, Storm
Sewerage and Solid Waste
Minimizing the impacts within the city, in the small urban river basins and not transfer these to the rive system.
1. Large watersheds (> 1.000 km2); 2. Area of scope of municipalities and their small sub-watersheds for macrodrainage (< 50 km2). The amounts of areas that are representative and may be changed for large cities.
In the first case, the solution involves state and federal support through technical offices that support the smaller cities in the development of their planning and implementation activities. The second would depend on the transition and evolution of the development of management in the country. The third would depend fundamentally on the development of a program at a federal and even state level, with a financial fund to make the actions possible.
Trends
The Millennium goals proposed by the United Nations involve various factors related to urban water management. The principal factors are: (a) reduction of the lack of access to potable water and sewage collection and treatment by 50% by 2015; (b) reduction of poverty, in which the vulnerability to natural and anthropic events has greater impact, given that vulnerability to droughts and floods is one of the main factors of poverty. To achieve the Millennium goals, it was agreed in Johannesburg in 2002 that countries should seek to develop Water Resources Plans. These plans involve developing the management of water resources in the countries.
Brazil evolved in the process of Water Resources Management, because by enacting a Water Resources Law it took the first step towards instituting the broad mechanism for water management, created the tools such as authorization, usage fees and classification of rivers (water quality goals), establishing the
mechanisms. It established institutions such as the National Water Agency and state agencies and Watershed Committees are being formed. Therefore, the process is underway in a suitable manner. Nevertheless, in the realm of actions in sanitation, the following is found:
a) There is a universe of various cities in the country with privatized services (private companies, about 10%), others with municipal government services and the large majority with state-run companies. The state companies attend approximately 82% of the population attended by water supply and 77% of the population with sewage collection (Ipea, 2002).
b) The coverage of sewage collection is moderate if cesspool systems are considered, but coverage with sewage treatment is low, which compromises the whole, since water sources are contaminated. c) The cities’ vulnerability to rain events is high, which aggravates the
situation of poverty in the periphery of the cities. The largest damages are not necessarily material but social.
For the country to be able to achieve the Millennium goals and increase the distribution of water and the collection and treatment of sewage, reducing this deficit by 50% by 2015, it will be necessary to act in a concentrated manner on the following factors:
•Increasethelowofwaterintheruralareasandforthelowincome population, in an effort to achieve total coverage of safe water. •Thedeicitinsewagecollectionisstill32.9%;therefore,achievingthe
goals would mean reducing this deficit to 16.4%.
•Thebiggestproblem,however,isfoundinincreasingsewagetreatment, where the deficit is 81.8%. Meeting the Millennium goals would mean reducing this to 40.9%.
A study carried out by PMSS in 2003-2004 (apud Esbe, 2006) mentions the need for investments of R$ 178 billion in 20 years to achieve universalization of service, representing 0.6% of GNP. Tucci (2005a) reported a need for investment for a National Pluvial Waters Program that would control the impacts of drainage and flooding in cities and identified a total cost of R$ 21,5 billion in 24 years for the solution of these impacts, representing up to 0.2% of GNP in one year. Based on these estimates, it is possible to foresee the need for investments of 0.8% of GNP in environmental sanitation (without including solid waste). This represents an order of R$ 16 billion per year for water, sewage and drainage, over a horizon of approximately 20 years, to achieve a sustainable process of urban development.
If this investment was conducted as foreseen in Tucci (2005a), initiated in the largest cities in terms of priority, the largest loads would be contained in coming years.
has led to an increase in the deficit and not a reduction (Esbe, 2006). The main difficulties found are related to:
a) Institutional factors related to the management of companies, change in legislation and lack of efficient services to the degree to which there are no standards, well defined goals for service and efficient services. The inefficiency is transferred to the users, since the services are not competitive.
b) Economic-financial, because of limited resources and borrowing capacity of the municipality and a lack of permanent financing. There is currently a lack of effective integration of the goals for Water Resources Management and those for Environmental Sanitation. Although this integration is implicitly called for in the legislation, in practice, it does not occur. The Watershed Management Plan calls for the classification of rivers, and cities should act to control urban effluents to achieve the standard set for the rivers inside and outside their watershed. Nevertheless, plans are needed to classify the rivers influenced by the cities, followed by a plan of action to achieve the goals.
Notes
1 Urban systems are limited areas, characterized by high population density sustained by biophysical processes with origin and scope that goes beyond the urban area (Rees, 2003).
2 Considering a total of the collected of 50.6% and treated of 28.2% of the collected (SNIS, 2004) and 75% efficiency in terms of the reduction of load, 10.7% of the load is effectively treated.
3 Considering the load of 183.6 million people, a concentration of 250 mg/l of BOD, consumption of 250 l/day and return of 80%, 8.197 thousand tons per day is the portion released into cesspools - 25%.
4 Load is the product of flow multiplied by the concentration of the polluting substance.
Bibliographic references
ESBE. PNAD 2005 aumenta o déficit de dos serviços de saneamento básico. Projeções indicam universalização em 50 anos. ESBE Associação das Empresas de Saneamento Estaduais, 2006.
IBGE. Anuário estatístico do Brasil - 1997. Rio de Janeiro: Instituto Brasileiro de Geografia e Estatística, 1998. (CD-ROM).
IPEA. Diagnóstico dos Serviços de água e Esgotos 2001. Sistema Nacional de Informações sobre Saneamento. Programa de Modernização do Setor de Saneamento, 2002.
MMA. Plano Nacional de Recursos Hídricos. Brasília: Secretaria de Recursos Hídricos. Ministério do Meio Ambiente, 2006.
REES, W. E. Understanding urban ecosystems: an ecologic economics perspective. In: BERKOWITZ, A. R.; NILON, C. H.; KOLLWEG, K. S. (Ed.) Understanding Urban Ecosystems: a new frontier for sciences and education. New York: Spriger-Verlang, 2003. p.115-36.
SCHUELER, T. Controlling urban runoff: a practical manual for planning and designing urban BMP. Washington, DC: Metropolitan Washington Council of Governments, 1987.
SNIS. Diagnóstico dos serviços de água e esgoto - 2003. Brasília: PMSS Programa de Modernização do Setor de Saneamento. Ministério das Cidades, 2004.
TIETENBERG, T. Environmental and natural resource economics. Boston: Addison Wesley, 2003. 646p.
TUCCI, C. E. M. Programa de drenagem sustentável: apoio ao desenvolvimento do manejo das águas pluviais urbanas - Versão 2.0. Brasília: Ministério das Cidades, 2005ª. ______. Desenvolvimento dos recursos hídricos no Brasil. REGA, v.2, n.2, dez. 2005b.
A
BSTRACT– Urban Waters systems generally include both water supply & sanitationfacilities (WSS). Sanitation refers to domestic and industrial sewage collecting and treatment; it does not include urban storm water or solid waste management systems. Urban waters involve components of a sustainable urban environment and the use of integrated water resource management (IWRM) concepts are needed for planning, implementation and maintenance of urban infrastructure. In urban environments, IWRM is referred to specifically as Integrated Urban Water Management (IUWM). In this paper urban development and its relations with urban waters in Brazil are analyzed. Management of Water Resources in Brazil is undertaken at the level of river basins and the administration is federal or by the state. This article evaluates alternatives for water management at the level of the city and the river basin in the Brazilian institutional environment.
K
EYWORDS–
Management, Urbanization, Water supply, Sanitary.Carlos E. M. Tucci is a professor at the Institute of Hydraulic Studies of the Federal University at Rio Grande do Sul (UFRGS). – [email protected]
Received on 6.16.2008 and accepted on 6.23. 2008.