ABSTRACT: Water deficit is a major factor limiting crop yield
in rainfed areas. We hypothesized that under water deficit the decrease of photosynthetic production stimulates: carbohydrate remobilization from leaves, stems and roots to reproductive organs; and decreasing flowering intensity and pod development. The present work aims to study the effect of water deficit during bloom and grain pod-filling stages in two indeterminate soybean cultivar, Vtop and Nidera. The following physiological parameters were evaluated by means of daily CO2 assimilation rate (Ai), dynamic of carbohydrates in tissues, plant growth, grain yield and yield components. The study was conducted in a greenhouse with plants sown in tanks of 0.5 m³. Regardless of the phenological phase, water deficit reduced Ai, plant growth and number of pods
BASIC AREA -
Article
Source-sink relationships in two soybean
cultivars with indeterminate growth under
water deficit
Alexandre José da Silva1, José Rodrigues Magalhães Filho2, Cristina Rodrigues Gabriel Sales3,
Regina Célia de Matos Pires2, Eduardo Caruso Machado2*
1.Syngenta Crop Protection – Research and Development Department of Abiotic Stress Management (ASM) – Sao Paulo (SP), Brazil.
2.Laboratory of Plant Physiology ‘Coaracy M. Franco’ - Center for Research and Development in Ecophysiology and Biophysics - Agronomic Institute - Campinas (SP), Brazil.
3.Lancaster Environment Centre - Lancaster University - Lancaster, UK.
*Corresponding author: caruso@iac.sp.gov.br
Received: Jan. 11, 2017 – Accepted: Apr. 10, 2017
and seeds per plant. The fact that grain yield was less affected by water deficit at bloom than at grain pod-filling stage was attributed to larger seeds found at bloom. In both treatments, a sharp reduction on carbohydrate content was found in leaves, stem and roots at the beginning of pod formation. The high amounts of carbohydrates remobilized for seed growth, along with the high values of Ai observed in well-watered plants, indicate that grain yield of soybeans is source rather than sink limited. On the other hand, in water deficit treatments, a new stimulus for carbohydrate storage was found in the leaves and stem at the beginning of grain maturity, suggesting that grain yield was limited by sink capacity. Key words:Glycine max L. Merrill, photosynthesis, carbohydrate,
INTRODUCTION
The dynamic of carbon assimilation in plants is functionally controlled by a source-sink relationship (Ainsworth et al. 2004; Ribeiro et al. 2012). Sources are the sites where net assimilation of CO2 occurs while sinks are tissues where photoassimilates are allocated for growth or storage. Although the CO2 assimilation rate is genetically determined, exogenous factors, such as water deficit, exerts substantial control over it (Liu et al. 2004a). Endogenous factors can also reduce the CO2 assimilation rate by a negative feedback effect on photosynthesis due to high leaf carbohydrate content (Mondal et al. 1978; Ribeiro et al. 2012). In soybean, the pods and seeds are the major sink tissues and their size and number per plant determine grain yield (Declaux et al. 2000; Egli and Bruening, 2004). Effects of water deficit on soybean productivity have been attributed to impairment of yield components mainly when water stress occurs during reproductive stages (Egli et al. 1976, 1983; Chaves et al. 2002).
Currently, most soybean crops in Brazil have used cultivars with indeterminate growth habit. These cultivars have keep growing for long periods by shooting new leaves at plant top simultaneously with flower and pod formation on the bottom shoots of the plant. These cultivars have a long flowering stage that can attenuate the drought effect on the reduction of the numbers of flowers and pods, once the reproductive stage is more sensitive to water deficit (Liu et al. 2004a). Nevertheless, this response could also be genotype-dependent such as in cultivars of soybean with determinate growth habit in which the tolerant genotypes keep high relative leaf water content (Fioreze et al. 2011). The reduction of the CO2 assimilation rate in the leaves could induce remobilization of stored carbohydrates to tissues with higher demands. Under water deficit the remobilization of carbohydrates from storage tissues to reproductive structures during bloom stages could be crucial for pods and seeds formation in soybean (Westgate and Peterson 1993; Liu et al. 2003, 2004a), once photosynthesis is usually the predominant source of photoassimilates for pod and seed growth (Christy and Porter 1982). As it has been shown for maize and soybean, carbohydrates accumulated in the leaves and stem are an important source of carbon, helping to supply the high demand for photoassimilates by the growing seeds and pods (Westgate and Thompson 1989; Machado et al.
1992; Liu et al. 2004b). However, these authors did not consider the roots relevance as a carbon source for storage that can be remobilized to grain filling. For instance, in orange trees, 70% of all the remobilized carbon in the plant during the reproductive stage comes from the roots (Dovis et al. 2014).
In summary, the effect of water stress on grain yield and yield components of soybean should be attributed to two main processes:
i. Reduction of cell water potential, and
ii. Decrease of the CO2 assimilation rate in leaves. The reduction of the water potential of tissues affects cell expansion, which drives the growth process of plants.
On the other hand, decreasing the CO2 assimilation rate limits the availability of photoassimilates for the growth process (Declaux et al. 2000; Liu et al. 2004a). Therefore, a better understanding of physiological processes affected by water stress in indeterminate soybean cultivars could provide not only fundamental knowledge on how to improve significantly crop management as well as on support to breeding programs. The present study tested the following hypothesis:
i. The decrease of photosynthetic production stimulates carbohydrate remobilization from leaves, stems and roots to reproductive organs under water deficit; and
ii. The reduction of photosynthetic production decreases flowering intensity and pod development. To test t hes e hyp ot hes es, we submitte d t wo indeterminate soybean cultivars to water deficit at two different phenological stages: at the beginning of the bloom and during grain-filling stage. The physiological response was evaluated via analysis of the following parameters: daily CO2 assimilation rate, plant growth and determination of carbohydrate content in leaves, stems and roots.
MATERIAL AND METHODS
Plant material and treatments applied
grown in 12 tanks (2.0 m long 0.5 m wide × 0.5 m high), containing 0.5 m³ of soil. The soil contained 45% of sand, 36% of silt and 19% of clay. Planting nutritional management was carried out according to van Raij et al. (1996) by applying 300 kg·ha−1 of 00-20-20 of the N-P-K formula. During sowing, Bradirhizobium japonicum was applied on the seeds in the seeding groove. In each tank, two lines of soybean were sown and each line comprised 20 plants from each cultivar with row spacing of 0.35 m and 10 plants per meter. Three treatments were applied as follows: T1, control, in which plants were kept in well-watered conditions during the entire cycle; T2, water deficit imposed during the bloom stage from R2 to R5, i.e., between 38 and 51 days after emergence (DAE); and T3, water deficit during the pod-filling stage from R5.1 to R6, i.e., between 51 and 72 DAE. The soil water potential (ΨW) was monitored using a WaterMark® 200SS (Irrometer, Riverside, CA, USA) sensor with reading capacity from 0 kPa (maximum water holding capacity of soil) to −199 kPa (low water available). In well-watered treatment, the ΨW was kept between 0 kPa and −25 kPa measured every two days. In each tank, two lines of drip irrigation with a constant and known flow were installed and the irrigation was managed by controlling the time in an automatic panel. Water deficit was promoted by the gradual reduction of irrigation time reaching the maximum period of stress the ΨW of −170 kPa in T2 and −190 kPa in T3 treatments, which corresponded to 13 and 21 days after initial irrigation reduction, respectively. Subsequently, irrigation was resumed and the ΨW recovered and kept at similar level in the control treatment until the cycle end.
Environmental conditions
Day and night air temperature (Tair, °C), air humidity (HR, %) and daily photosynthetically active radiation (PAR, MJ·m−2·day−1) were measured with sensors connected to a multichannel recorder model CR1000 (Campbel, North Logan, UT, USA), where the data was stored every 20 min throughout the crop cycle. Based on this information, the daytime (from 7:00 a.m. to 7:00 p.m.) and night time (from 7:00 p.m. to 7:00 a.m. of the day after) decendial average temperatures were considered. For PAR, the decendial average was considered from total daily measured.
Plant growth analysis
The samples for growth analysis were collected at four different crop stages:
i. At 38 DAE, i.e., beginning of bloom (R2 stage);
ii. At 51 DAE, i.e., beginning of pod + seed formations (R5.1 stage, which was the maximum stress for T2);
iii. At 72 DAE, i.e., during grain-filling (R6 stage, maximum stress for T3); and
iv. At 100 DAE, i.e., physiological maturity (R7 stage, final sampling at harvest time). In each sample, data on the following parameters were assessed: leaf area (LA) measured with a planimeter (LI-3100C, Li-Cor, Lincoln, NE, USA); total aboveground dry matter per plant (DM) and pod dry matter per plant (PDM, referring to pod + seed), which were dried in an oven at 60 °C until constant weight; number of pods per plant (NP); number of nodes per plant (NN) and plant height (H). At the end of the harvesting (100 DAE), the complementary analysis related to yield components was performed, namely total grain dry mass per plant (GDMT), dry matter of 100 grains (GDM100) and number of grains per plant (NG).
Daily CO2 assimilation rate and leaf water potential
The CO2 assimilation rates (A, µmol·m−2·s−1) were measured every 2 hours from 7:00 a.m. to 5:00 p.m. using an infrared gas analyser coupled with light source (Li-6400XT Licor Inc., Lincoln, NE, USA). The measurements were made in the newest totally expanded leaves. The intensity of the PAR used for gas exchange measurements was the same as that reached the top of the crop canopy during each interval. The CO2 reference for all measurements was 380 μmol·mol−1. The daily net CO2 assimilations (Ai, mol CO2·m−2·d−1) were calculated by integrating the areas under the curves built from daily instantaneous measurements of A, using the software OriginTM.
Carbohydrate content
The carbohydrate content was determined in dried samples of leaves, stems and roots collected at 38 DAE (R2 stage), 51 DAE (R5.1 stage), 72 DAE (R6 stage) and 100 DAE (R7 stage). Total soluble sugars and sucrose contents were quantified by the phenol-sulfuric method (Dubois et al. 1956; Van Handel 1968), while starch was determined according to the enzymatic method described by Amaral et al. (2007). Samples were dried in an oven at 5 °C until constant weight and then milled in a manual grinder (model A11b, IKA, Staufen, Germany). The newest fully expanded leaves used for this analysis were obtained from two plants (sub-samples) used in the growth analysis, which were homogenized during the milling process. The total non-structural carbohydrates (TNC) of leaves (LTNC), stems (STNC) and roots (RTNC) were calculated by adding the contents of starch and total soluble sugars.
Experimental design and statistical analysis
The plots were arranged in completely randomized blocks with five replicates per treatment (blocks) for all analyses,
except for the leaf water potential, which had four replicates considered. All data were submitted to the analysis of variance taking into account each cultivar independently. The data analysed through the experimental period (growth analysis, CO2 assimilation rate and carbohydrate content) were treated as factorial analyses considering the treatments and the time as factors of variation. Leaf water potential, measured only at the maximum stress period and yield components, analysed only at the end of the experiment, were treated as randomized blocks. When differences were found, the mean values were compared by the Tukey test (p ≤ 0.05). All analyses were carried out using the software SASM-Agri (Canteri et al. 2001).
RESULTS AND DISCUSSION
Environmental and plant conditions, soil and leaf water potential
The average temperature ranged from 19.5 ± 0.3 to 32.0 ± 0.5 °C (Figure 1a) and radiation varied from 6.0 ± 1.2 to 12.0 ± 2.1 MJ·m-2·d-1 (Figure 1b); therefore, environmental conditions were adequate for soybean
Figure 1. Decendial averages of day and night air temperature (Tair, in a) and of total daily of photosynthetic active radiation (PAR, in b), soil
water potential (ΨW) at 0.2 (in c) and at 0.4 (in d) meters deep in T1 (plants watered during the whole cycle), T2 (plants that was submitted to
water deficit at the flowering stage, from 38 to 51 DAE) and T3 (plants that was submitted to water deficit at the grain filling stage from 51 to 72 DAE); DAE indicates days after seedling emergence.
20 22 24 26 28 30 32
4 6 8 10 12 14
0 20 40 60 80 100 120 -200
-150 -100 -50 0
0 20 40 60 80 100 120 0 20 40 60 80 100 120
0.4 meters depth
0.2 meters depth -200
-150 -100 -50 0 Night
Tair
(°C)
Day
T1 T2 T3
WD1 WD2
DAE
DAE
0 20 40 60 80 100 120
DAE
DAE WD1 WD2
PAR (MJ·m
–2·d –1)
ΨW
(kPa)
ΨW
(kPa)
(a)
(c)
(b)
growth (Secretaria da Agricultura 1974). At the beginning of the bloom (prior to the treatments), abundant nodulation was observed in root of plants and the N contents determined in leaves were 45.4 and 41.7 g·kgDM-1 for Vtop and Nidera, respectively, which were considered adequate for soybeans (Embrapa 1998).
The ΨW for treatment T1, ranged from zero to −25 kPa across the entire experiment and soil profile (Figures 1c,d), shows that the soil water content was kept at high levels for good plant growth throughout the experiment. For treatments T2 and T3, the minimal soil water content occurred at maximal period of water stress, i.e., −170 kPa at 51 DAE (T2) and −199 kPa at 72 DAE (T3) on both soil profiles (Figures 1c, d). In T2 and T3, the ΨW in soil profiles recovered to the levels of T1 treatment (~ −10 kPa) one day after re-watering and were kept at high levels during the remaining cycle (Figures 1c,d).
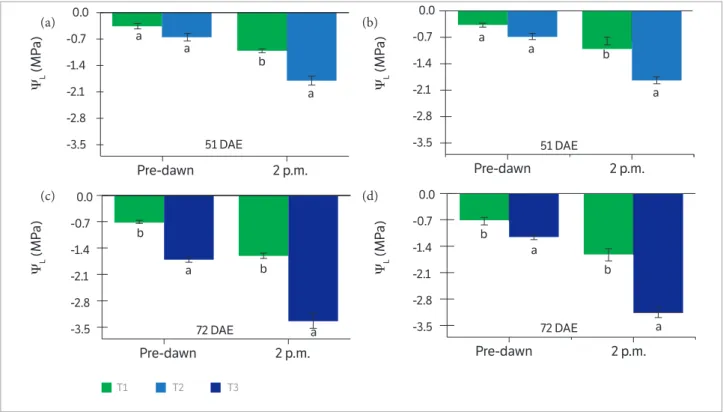
It was found a significant difference of ΨL at 51 DAE between treatments only in the measurements at 2:00 p.m. for both cultivars, where ΨL of T2 was lower (p < 0.05) than T1 (Figures 2a, b). Differently, plants of Vtop and Nidera submitted to water deficit in a later period
(T3, at 72 DAE) presented a significantly reduction of ΨL (p < 0.05) for both measurements, 6:00 a.m. and 2:00 p.m., when compared to T1 (Figures 2c,d). The low ΨW in the soil profile was enough to reduce ΨL of Vtop and Nidera cultivars on T2 and T3 treatments. However, the water deficit imposed to T3 (72 DAE) was more intense than that at 51 DAE (T2). It is then suggested that this response could be related either to higher water demand of plants during the grain-filling stage (Liu et al. 2004a; Westgate and Peterson, 1993) or longer periods under water deficit, which corresponds to T3. The difference in time duration of water deficit between T2 and T3 treatments can be explained by the higher phenological duration required to grain-filling process, which corresponded to T3 period.
Effects of water deficit on plant growth
In T1 treatment, plant height (H) for both cultivars increased until 72 DAE reaching ~1.2 m (Figures 3a,d). Regardless of the phenological phase, water deficit reduced H similarly to both cultivars. The maximal leaf area (LA) was 32 dm²·pl−1 and occurred in T1 plants at 72 DAE for both cultivars (Figures 3b,e), decreasing afterwards. Likewise,
-3.5 -2.8 -2.1 -1.4 -0.7 0.0
-3.5 -2.8 -2.1 -1.4 -0.7 0.0
-3.5 -2.8 -2.1 -1.4 -0.7 0.0
-3.5 -2.8 -2.1 -1.4 -0.7 0.0 a
a
51 DAE
T1
a
b
b b
a a
72 DAE
Pre-dawn
ΨL
(MP
a)
ΨL
(MP
a)
ΨL
(MP
a)
ΨL
(MP
a)
2 p.m. b a
a
a
51 DAE
Pre-dawn 2 p.m.
Pre-dawn 2 p.m.
Pre-dawn 2 p.m.
b b
a
a 72 DAE
T2 T3
Figure 2. Leaf water potential (ΨL) measured at pre-dawn (6:00 a.m.) and at 2:00 p.m. at maximum water deficit of two indeterminate soybean cultivars Vtop (in a, c) and Nidera (in b, d) for T2 (51 DAE, in a, b) and T3 (72 DAE, in c,d), compared to T1 for each date. Description of T1, T2 and T3 follows Figure 1; means followed by the same letters do not differ significantly at 5% of probability by Tukey test, n = 4. DAE indicates days after seedling emergence.
(a)
(c)
(b)
water deficit impaired LA growth in T2 treatment keeping it at constant levels, about 16 dm²·pl−1 for both cultivars. However, the Nidera cultivar did not present any LA recovery response once soil rehydration was re-established (Figure 3e). Still, for treatment T3, the water deficit had low effect on LA reduction on Vtop cultivar (Figures 3b,e). As reported by Declaux et al. (2000), the reduction of H and LA is related to decrease of YL once the growth mechanism of tissues is driven by high cell water potential. It is known that the low soil water content reduces water flow in the plant, mainly in the midday period, therefore affecting YL. The reduced YL found in T2 and T3 treatments were strong enough to reduce plant growth generating a negative effect on DM production (Bunce 1982; Desclaux et al. 2000).
Although the water deficit in treatment T3 was more severe (Figures 1c,d and 2b), its effect on final above ground dry mass (DM) was negligible, presenting the same weight as that observed in T2 regardless of the cultivar (Figures 3c,f). The control plants showed quasi-linear response of biomass production overtime, presenting at 100 DAE, about 96 g·pl−1 of DM whereas T2 produced 70 g·pl−1 and T3 about 60 g·pl−1 for both cultivars (Figures 3c,f).
Effects of water deficit on yield and yield components
The maximum number of nodes (NN) found in the plants was about 30 in Vtop and 33 in Nidera cultivar
Vtop
DAE
Nidera
T1 T2 T3
DM (g·pl
–1)
LA (dm
2·pl –1)
H (cm)
140
120
100
80
60
40
100
80
60
40
40 50 60 70 80 90 100
DAE
40 50 60 70 80 90 100 20
0 40
30
20
10
DM (g·pl
–1)
LA (dm
2·pl –1)
H (cm)
140
120
100
80
60
40
100
80
60
40
20
0 40
30
20
10
WD1 WD2
WD1 WD2
Figure 3. Plant height (H in a,d), leaf area (LA in b,e) and above ground dry mass (DM in c,f) of two indeterminate soybean cultivars, Vtop (a,b,c) and Nidera (d,e,f) measured from flowering (38 DAE) for final ripening periods (100 DAE) in T1, T2 and T3 treatments. Description of T1, T2 and T3 follows that in Figure 1. N = 5 ± SE. DAE indicates days after seedling emergence.
(a) (d)
(b) (e)
(Figures 4a,d). The water deficit reduced (p < 0.05) the final NN only in T3 for the Nidera cultivar showing that the occurrence of low soil water content during pod formation was more harmful than at early stages. Besides, full recovery of NN was observed in T2 for this cultivar (Figure 4d). On the other hand, the Vtop cultivar showed no differences in the final NN among treatments, which could be explained by full recovery of NN in T2 and T3 after soil rehydration, observed in T2 for the Nidera cultivar as well (Figures 4a,d). After soil rehydration, full recovery of NN was not followed by H recovery, suggesting that a lower internodes length is expected in all plants of T2 and T3, as also reported by Declaux et al. (2000). Regarding the number of pods per
Vtop
DAE
Nidera
T1 T2 T3
PDM (g·pl
–1)
NP·pl
–1
NN·pl
–1
40
30
20
10
0
60
45
30
15
40 50 60 70 80 90 100
DAE 0
100
80
60
40
20
0
WD1 WD2
PDM (g·pl
–1)
NP·pl
–1
NN·pl
–1
40
30
20
10
0
60
45
30
15
40 50 60 70 80 90 100
0 100
80
60
40
20
0
WD1 WD2
plant (NP), the control plants achieved maximum NP at 72 DAE which was higher (p < 0.05) than in the other treatments, i.e., between 83 and 90 NP in T1 vs. 50 NP in T2 and T3 for both cultivars (Figures 4c,f ). Although water deficit has induced a generalized reduction of NP regardless its occurrence, partial recoveries of NP were observed in T2 plants after soil rehydration, which are related to plant growth resumption (Figures 3a,d; 4b,e). Taking this into account, the NP component in soybean indeterminate cultivars seems to be more sensitive to water deficit during the post-anthesis stage (Declaux et al. 2000; Kokubun et al. 2001).
Concerning the pod dry mass (PDM), the control plants presented higher PDM than T2 and T3 treatments,
Figure 4. Number of nodes per plant (NN·pl−1 in a, d), number of pods per plant (NP·pl−1 in b, e) and pods dry mass (PDM in c, f) of two indeterminate soybean cultivars, Vtop (a, b, c) and Nidera (d, e, f), measured from flowering (38 DAE) to final ripening periods (100 DAE) in T1, T2 and T3 treatments. Description of T1, T2 and T3 follows that on Figure 1. N = 5 ± SE. DAE indicates days after seedling emergence.
(a) (d)
(b) (e)
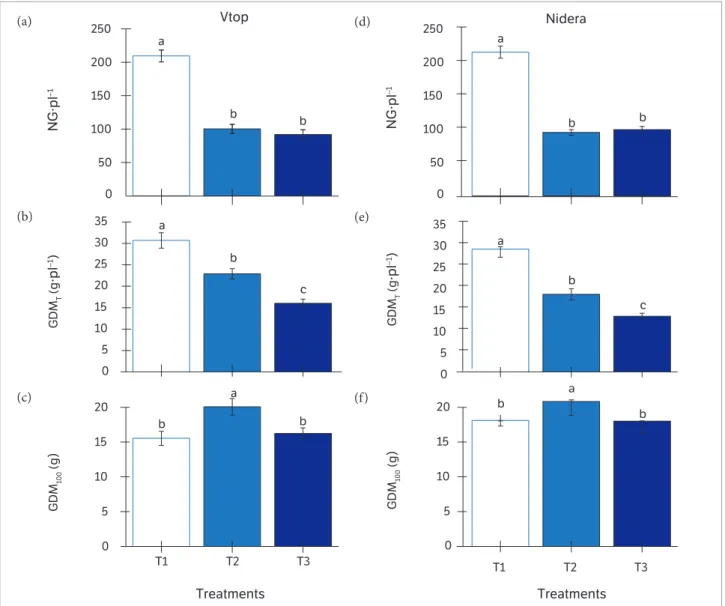
reaching about 50 g of PDM per plant in both cultivars at the end of the cycle (Figures 4c,f ). On the other hand, plants that underwent water deficit once reached PDM of 20 to 32 g during the same period. The effects of water deficit on PDM were, however, more pronounced during the grain-filling stage, i.e., in T3 for both cultivars (Figure 4c,f ). Plants of the control treatments produced about 200 grains per plant (NG), twice as much the number found in T2 and T3 plants (Figures 5a,d). Consequently, grain yield per plant (GDMT) in T1 was 31% and 55% greater, respectively, than in T2 for Vtop and Nidera, and about twice as much as that found in T3 for both cultivars (Figures 5b,e). Regarding the dry matter of 100
grains (GDM100), T2 presented 20 g of dry mass in 100 seed, which was higher (p < 0.05) than in T1 and T3 that rendered about 15 to 18 g in both cultivars (Figures 5c,f). Water deficit during grain-filling stage induces the increase of seed weight as a compensatory effect to attenuate the reduction of grain number (Declaux et al. 2000). Thus, our results indicate that such compensatory effects occurred in T2 plants as high as GDM100 (p < 0.05) was observed even in the presence of reduced NG (Figures 5a, c,d,f ), which should be attributed to the increase of the seed growth rate (Rotundo and Westgate, 2010). On the other hand, a non-compensatory effect was found in GDM100 in T3 plants even at reduced NG (Figures 5a,d).
0 50 100 150 200 250
b b
NG·pl
–1
NG·pl
–1
a
b b
a
0 5 10 15 20 25 30 35
0 5 10 15 20 25 30 35
c b
a
GDM
T
(g
·pl
–1)
GDM
100
(g
)
GDM
T
(g
·pl
–1)
GDM
100
(g
)
c b
a
T1 T2 T3
b b
a
Nidera
Treatments Treatments
Vtop
T1 T2 T3
0 0
5 10 15 20
5 10 15 20 b
b
a
0 50 100 150 200 250
Figure 5. Number of grains per plant (NG·pl−1 in a, d), grain dry mass per plant (GDM
T) (b, d) and dry mass of 100 grains (GDM100 in c, f) of two
indeterminate soybean cultivars, Vtop (a, b, c) and Nidera (d, e, f), measured at final ripening periods (100 DAE) in T1, T2 and T3 treatments. Description of T1, T2 and T3 follows that on Figure 1. Means followed by the same letters do not differ significantly at 5% of probability by Tukey test, n = 5.
(a) (d)
(b)
(c)
(e)
Liu et al. (2004b) have shown that reduction of water potential in plants have induced an increase in the abscisic acid (ABA) content in the xylem sap of soybean, which negatively correlated to pod fresh weight. The authors suggested that this response is related to the ABA inhibitory effect on cell expansion of pod tissue. The lack of compensatory effect on T3 plants could be related to the inhibitory effect of ABA on cell expansion of pod and grains, buffering the compensatory effect of GDM100 and inhibiting a higher seed growth rate.
Therefore, the effects of water deficit on grain yield can be clearly explained by changes in yield components (Declaux et al. 2000; Liu et al. 2004a), where NP, NG and GDM100 are the most sensitive (Figures 4b, e; 5a, d, c, f). Moreover, water deficit imposed during the grain-filling stage caused more damage to grain yield (Figures 5b, e), mainly in response to the PDM daily-gain drop off (Figures 4c,f). On the other hand, plants that experienced water deficit at the bloom stage presented partial recovery on daily-gain of PDM after soil rehydration. This was attributed to the increase of GDM100 as a compensatory effect to reduced NP (Figures 4b,c,e, f; 5c,f ). Declaux et al. (2000) has also reported such performance in indeterminate soybean cultivars.
Effects of water deficit on photosynthetic production
The control treatment of both cultivars presented similar maximum daily net CO2 assimilation (Ai), from 0.95 to 1.11 mol·m−2·d−1 (Figures 6a, b). During pre-anthesis, Ai was 36% lower than in subsequent phenological stages. The drying of the soil in both phenological stages induced a sharp reduction (p < 0.05) in Ai that was around 65% at bloom and 82% in grain-filling stages for both cultivars. Three days after soil rehydration, T2 plants shown full recovery of Ai, while in T3 plants only a partial recovery was found (Figures 6a,b). The Ai increase observed through the phenological stages of transition, i.e., at 45 DAE, may be related to the growing demand of photoassimilates caused by the emergence of blooms and pod formations (Figures 4b,e; 6a,b). As stated by other authors, the photosynthesis dynamics seems to be controlled by the source-sink relationship, i.e., any increase in carbohydrates demand by sink tissues tends to increase the photosynthesis in source leaves as
well (Ainsworth et al. 2004, 2011; Ribeiro et al. 2012). At the beginning of bloom, the plant growth rates were at high levels and only 20% of total aboveground dry matter (DM) and 66% of final plants height (H) had been achieved (Figures 3a,c,d,f ). This suggests that the up-regulation of photosynthesis occurred in response to the increase in sink demand. However, the observed reduction of Ai in plants submitted to water deficit was attributed to a decrease in YL (Figures 2a,b; 6a,b), as reported by other authors (Bunce 1982; Egli and Bruening, 2004; Liu et al. 2004a,b; Ribas-Carbo et al. 2005). It is known that low YL increases the stomatal resistance, which in turn reduces the CO2 uptake, thereby affecting leaf photosynthesis by the diffusive process (Huber et al. 1984). Therefore, the low grain-yield found in T2 and T3 plants can be attributed to the photosynthesis reduction per unit of leaf area and photosynthesis on the canopy scale in response to the LA reduction (Figures 3b,e; 6a,b).
Figure 6. Daily net CO2 assimilation (Ai) of two indeterminate soybean cultivars, Vtop (a) and Nidera (b), measured from 38 to 76 DAE in T1, T2 and T3 treatments. Description of T1, T2 and T3 follows that in Figure 1. N = 5 ± SE. DAE indicates days after seedling emergence.
0
35
T1 T2 T3
40 45 50 55 60 65 70 75 35 40 45 50 55 60 65 70 75
WD1 WD2
WD1 WD2
200 400 600 800 1,000 1,200 0 200 400 600 800 1,000 1,200
Nidera Vtop
Ai
(mmol·m
–2·d –1)
Ai
(mmol·m
–2·d –1)
DAE
(a)
Total non-structural carbohydrate partitioning vs. source-sink relationship
In well-watered plants (T1), an (p < 0.05) increase on total non-structural carbohydrate (TNC) content was found in all analysed tissues between 38 and 51 DAE (Figure 7). Therefore, a significant reduction of TNC occurred in the stem (STNC) and root (RTNC) tissues until 72 DAE, remaining at constant levels until the cycle end (Figures 7b,c,e,f). In LTNC leaves, the reduction had a mild response, keeping it at a relatively constant rate. In T2 and T3, the STNC and RTNC responses were similar to that observed in T1 during almost the entire cycle, with exception for STNC post-72 DAE, due to a new stimulus for accumulation of carbohydrates (Figure 7).
In leaves, water deficit imposed in T2 and T3 plants induced an abrupt decrease of LTNC; however, an increase (p < 0.05) in LTNC for both treatments was observed after soil rehydration (Figures 7a,d). During water deficit in T2, plants accumulated high carbohydrate contents in the roots (RNTC) that were higher (p < 0.05) than those found in the other two treatments (Figures 7c,f ).
The TNC increase in all tissues of well-watered plants during the bloom stage can be related to the enhancement of source:sink ratio caused by the larger Ai observed during the transient phenological stage (Figures 6a,b; Figure 7). As previously reported (Ainsworth et al. 2004, 2011; Ribeiro et al. 2012), the up-regulating in Ai was attributed to the increase of sink demand by both bloom and pod formation processes (Figure 6). However, it is
Vtop
DAE
Nidera
T1 T2 T3
RTNC (mg·gDM
–1)
STNC (mg·gDM
–1)
LTNC (mg·gDM
–1)
150
125
100
75
50
25
0
150
125
100
75
50
25
0
40 50 60 70 80 90 100
150
125
100
75
50
25
0
WD1 WD2
DAE
RTNC (mg·gDM
–1)
STNC (mg·gDM
–1)
LTNC (mg·gDM
–1)
150
125
100
75
50
25
0
150
125
100
75
50
25
0
40 50 60 70 80 90 100
150
125
100
75
50
25
0
WD1 WD2
Figure 7. Total of non-structural carbohydrate content in leaves (LTNC in a, d), stems (STNC in b, e) and in roots (RTNC in c, f) of two indeterminate soybean cultivars, Vtop (a, b, c) and Nidera (d, e, f) in plants submitted to T1, T2 and T3 treatments. Description of T1, T2 and T3 follows that in Figure 1. N = 5 ± SE. DAE indicates days after seedling emergence.
(a) (d)
(b)
(c)
(e)
suggested that at the beginning of bloom stage, the high production of photoassimilates exceeded carbohydrates consumption thus inducing the storage of photoassimilates in all tissues. Subsequently, the intense processes of pod formation and grain-filling increased the sink demand for levels higher than the photoassimilates production by the source. Hence, intense remobilization of TNC was observed in all tissues (Figures 4b,c,e,f; Figure 7). Surprisingly, a significant TNC reduction occurred simultaneously with the maximum daily photosynthetic assimilation rate (Figures 6a, b), suggesting that grain yield of indeterminate soybean was limited by source activities. Furthermore, in water stress treatments, the TNC widespread remobilization occurred until 72 DAE, supporting the sink demand. Interesting response occurred after the period for both T2 and T3 in which an increase in the carbohydrate content was found in leaf and stem tissues (Figures 7a,b,d,e). This response may be related to the increase in source-sink ratio induced by the following factors: plant growth reduction, lower daily-gain of PDM and increase in Ai observed after soil rehydration in these treatments (Figures 3a,b,d,e, Figures 4c,f; Figure 6). In other words, the reduced NP and NG in both water deficit treatments kept the carbohydrate consumption at lower levels than that produced in the source, inducing accumulation of photoassimilates excess in these tissues. It suggests that under water deficit, the grain yield of soybean is sink limited. As a result, photoassimilates production was high enough to sustain the higher seed growth rates observed in T2 plants, confirmed by the GDM100 component and PDM daily-gain (Figures 4c,f; Figures 5c,f). This response, however, was not found in
T3 plants in which the non-improving seed growth rates induced an accumulation of photoassimilates in the stem and leaf tissues (Figures 7a,b,d,e).
Finally, the improvement of canopy photosynthesis in soybean has a potential to increase grain yield in crops grown in regions where water is not a limiting factor. Although the two cultivars come from different genetic background, a similar response pattern was found between them.
CONCLUSION
Grain yield of well-watered soybean is limited by ‘source’ rather than ‘sink’ activities. Although carbohydrates stored in leaves, stems and roots are important sources of carbon storage, they are insufficient to sustain the grain-filling process. On the other hand, soybean submitted to water deficit during the reproductive stage presented an accumulation of reserves in the leaves and stems, indicating that soybean under water stress is ‘sink’ rather than ‘source’ limited.
ACKNOWLEDGMENTS
The authors thank the National Council for Scientific and Technological Development (CNPq, Brazil) and the São Paulo Foundations for Research Support (FAPESP) for the scholarships granted to ECM and JRMF, respectively. The technical and field support given by Mr. Severino Nogueira is gratefully acknowledged.
REFERENCES
Ainsworth, E. A., Rogers, A., Nelson, R. and Long, S. P. (2004). Testing the “source sink” hypothesis of down-regulation of photosynthesis
in elevated (CO2) in the field with single gene substitutions in Glycine
max. Agriculture and Forest Meteorology, 122, 85-94. http://dx.doi.
org/10.1016/j.agrformet.2003.09.002.
Ainsworth, E. A. and Bush, D. R. (2011). Carbohydrate export from the leaf: a highly regulated process and target to enhance photosynthesis and productivity. Plant Physiology, 155, 64-69. http:/ / dx. doi. org/ 10. 1104/ pp. 110. 167684.
Amaral, L. I. V., Gaspar, M., Costa, P. M. F., Aidar, M. P. M. and Buckeridge, M. S. (2007). Novo método enzimático rápido e sensível de extração e dosagem de amido em materiais
vegetais. Hoehnea, 34, 425-431. http://dx.doi.org/10.1590/
S2236-89062007000400001.
Boyer, J. S. (1995). Measuring the water status of plants and soils. San Diego: Academic Press.
leaves. Canadian Journal of Botany, 60, 195-200. http://dx.doi. org/10.1139/b82-026.
Canteri, M. G., Althaus, R. A., Virgens Filho, J. S., Giglioli, E. A. and Godoy, C. V. (2001). SASM-Agri: Sistema para análise e separação de médias em experimentos agrícolas pelos métodos Scott-Knott, Tukey e Duncan. Revista Brasileira de Agrocomputação, 1, 18-24.
Chaves, M. M., Pereira, J. S., Maroco, J., Rodrigues, M. L., Ricardo, C. P. P., Osório, M. L., Carvalho, I., Faria, T. and Pinheiro, C. (2002).
How plants cope with water stress in the field. Photosynthesis and
growth. Annals of Botany, 89, 907-916. http://dx.doi.org/10.1093/
aob/mcf105.
Christy, A. L. and Porter, C. A. (1982). Canopy photosynthesis and yield in soybean. In: Govindge (Ed.). Photosynthesis: Development, Carbon Metabolism and Plant Productivity. (p. 499-511). New York: Academic Press.
Desclaux D., Huynh T. T. and Roumet P. (2000). Identification of soybean plant characteristics that indicate the timing of drought
stress. Crop Science, 40, 716-722. http://dx.doi.org/10.2135/
cropsci2000.403716x.
Dovis, V. L., Machado, E. C., Ribeiro, R. V., Magalhaães Filho, J. R., Marchiori, P. E. R. and Sales, C. R. G. (2014). Roots are important sources of carbohydrates during flowering and fruiting in ‘Valencia’ sweet orange trees with varying fruit load.
Scientia Horticulturae, 174, 87-95. http://dx.doi.org/10.1016/j.
scienta.2014.05.011.
Dubois, M., Gilles, K. A., Hamilton, J. K., Rebers, P. A. and Smith, F. (1956). Colorimetric method for determination of sugars and
related substances. Analytical Chemistry, 28, 350-356. http://
dx.doi.org/10.1021/ac60111a017.
Egli D. B., Gossett D. R. and Leggett J. E. (1976). Effects of leaf
and pod removal on the distribution of 14C labeled assimilate in
soybeans. Crop Science, 16, 791-794. http://dx.doi.org/10.2135/
cropsci1976.0011183X001600060013x.
Egli, D. B., Meckel, L., Phillips, R. E., Radcliffe, D. and Leggett, J. E. (1983). Moisture stress and nitrogen redistribution in soybean.
Agronomy Journal, 75, 1027-1031. http://dx.doi.org/10.2134/agro
nj1983.00021962007500060036x.
Egli, D. B. and Bruening, W. P. (2004). Water stress, photosynthesis, seed sucrose levels and seed growth in soybean. Journal of
Agricultural Science. 142, 1-8. http://dx.doi.org/10.1017/
S0021859604004095.
Empresa Brasileira de Pesquisa Agropecuária (1998). Centro
Nacional de Pesquisa da Soja. Recomendações técnicas para
a cultura da soja na região central do Brasil. Documentos, 120.
Londrina: Embrapa-Soja.
Fioreze, S. L., Pivetta, L. G., Fano, A., Machado, F. R. and
Guimarães, V. F. (2011). Comportamento de genótipos de soja
submetidos a déficit hídrico intenso em casa de vegetação.
Revista Ceres, 58, 342-349. http://dx.doi.org/10.1590/
S0034-737X2011000300015.
Huber, C., Rogers, H. H. and Mowry, F. L. (1984). Effects of water
stress on photosynthesis and carbon partitioning in soybean
(Glycine max L. Merr.). Plants Grown in the Field at Different CO2
Levels. Plant physiology, 76, 244-249.http://dx.doi.org/10.1104/
pp.76.1.244
Kokubun, M., Shimada, S. and Takahashi, M. (2001). Flower abortion
caused by pre-anthesis water deficit is not attributed to impairment
of pollen in soybean. Crop Science, 41, 1517-1521. http://dx.doi.
org/10.2135/cropsci2001.4151517x.
Liu, F., Andersen, M. N. and Jensen, C. R. (2003). Loss of pod set
caused by drought stress is associated with water status and ABA
content of reproductive structures in soybean. Functional Plant
Biology, 30, 271-280. http://dx.doi.org/10.1071/FP02185.
Liu, F., Jensen, C. R. and Andersen, M. N. (2004a). Drought stress
effect on carbohydrate concentration in soybean leaves and pods
during early reproductive development: its implication in altering
pod set. Field Crops Research, 86, 1-13. http://dx.doi.org/10.1016/
S0378-4290(03)00165-5.
Liu, F., Andersen, M. N. and Jensen, C. R. (2004b). Root signal
controls pod growth in drought-stressed soybean during the critical, abortion-sensitive phase of pod development. Field
Crops Research, 85, 159-166.
http://dx.doi.org/10.1016/S0378-4290(03)00164-3.
Machado, E, C., Silveira, J. A. G., Vitorello, V.A. and Rodrigues, J. L.
M. (1992). Fotossíntese, remobilização de reservas e crescimento
de grãos em dois híbridos de milho sob deficiência hídrica na fase
de enchimento dos grãos. Bragantia, 51, 151-159. http://dx.doi.
org/10.1590/S0006-87051992000200004.
Mondal, M. H., Brun, W. A. and Brenner, M. L. (1978). Effects of sink
removal on photosynthesis and senescence in leaves of soybean
Ribas-Carbo, M., Taylor, N. L., Giles, L., Busquets, S., Finnegan,
P. M., Day, D.A., Lambers, H., Medrano, H., Berry, J. A. and Flexa,
J. (2005). Effects of water stress on respiration in soybean
leaves. Plant Physiology, 139, 466-473. http:/ / dx. doi. org/ 10. 1104/
pp. 105. 065565.
Ribeiro, R. V., Machado, E.M., Habermann, G., Santos., M. G.
and Oliveira, R. F. (2012). Seasonal effects on the relationship
between photosynthesis and leaf carbohydrates in orange trees.
Functional Plant Biology, 39, 471-480. http://dx.doi.org/10.1071/
FP11277.
Rotundo, J. L. and Westgate, M. E. (2010). Rate and duration of
seed component accumulation in water-stressed soybean. Crop
Science, 50, 676-684. http://dx.doi.org/10.2135/cropsci2009.05.
0240.
Secretaria da Agricultura (1974). Zoneamento Agrícola do Estado de São Paulo, vol. 1. 165p.
Van Handel, E. (1968). Direct micro determination of sucrose.
Analytical Biochemistry, 22, 280-283. http://dx.doi.org/
10.1016/0003-2697(68)90317-5.
van Raij, B., Cantarella, H., Quaggio, J. A. and Furlani, A. M. C.
Recomendações de adubação e calagem para o Estado de São
Paulo (p.285). 1997. 2. ed. (Boletim Técnico, 100). Campinas:
Instituto Agronômico/Fundação IAC.
Westgate, M. E. and Peterson, C. M. (1993). Flower and pod
development in water-deficient soybean (Glycine max L. Merr.).
Journal of Experimental Botany, 44, 109-117. http://dx.doi.org/10.1093/
jxb/44.1.109.
Westgate, M. E. and Thomson, G. L. (1989). Water deficits and
reproduction in maize. Responses of the reproductive tissues to
water deficits at anthesis and mid-grain fill. Plant Physiology, 91,