1Universidade de São Paulo/USP – Faculdade de Zootecnia e Engenharia de Alimentos – São Paulo – SP – Brasil – [email protected] 2Universidade de São Paulo/USP – Faculdade de Zootecnia e Engenharia de Alimentos – São Paulo – SP – Brasil
Received in may 26, 2014 and approved in september 1, 2014
PULP ON THE BLOOD PARAMETERS LINKED TO
ENERGY METABOLISM IN HORSES
Efeito de dietas com níveis crescentes de polpa cítrica sobre parâmetros sanguíneos ligados ao metabolismo energético de equinos
Madalena Lima Menezes1, Roberta Ariboni Brandi2, Ives Cláudio da Silva Bueno2, Júlio Cesar de Carvalho Balieiro2, Camilla Garcia Moreira2, Olivia Carmen de Araújo Nascimento2
ABSTRACT
Currently, the use of alternative energy ingredients for horses has increased because these foods contain “superfibers”,
making safer diet for these animals. To study the influence of diets containing increasing levels of citrus pulp on albumin, triglycerides, cholesterol, glucose, insulin and short chain fatty acid (SCFA) concentrations in the blood, five animals were used, with an average age of 3.5 years and a live weight of 460.66±76.86 kg, they were fed twice a day, at 7:00 am and 4:00 pm. The diets were formulated to meet the requirements of the animals at maintenance. 60% of the energy was obtained from forage, and 40% from concentrate, containing the following inclusion levels of citrus pulp (0, 7, 14, 21 and 28%). The area under the curve (AUC) and the glucose and insulin peaks were calculated, and no differences were observed between the treatments. There was no effect of diet on the blood concentrations of the evaluated parameters tested, and there was no effect of the time of collection on the following variables: SCFAs, cholesterol, triglycerides and albumin. However, the diet did have quadratic effect on the glucose (Ŷ =-0.5327X²+4.2130X+84.5276) and insulin (Ŷ=-0.1002X² +0.8233X + 1.6336) concentrations. Up to 28% of the concentrate can be composed of citrus pulp in horse diets without causing any alterations on the concentrations of the parameters analyzed in the blood. High-fiber diets with easily fermentable fibers are beneficial because they maintain the glucose and insulin
curves close to the baseline levels.
Index terms: Soluble fiber, nutrition, pectin, plasma.
RESUMO
Atualmente, a utilização de ingredientes energéticos alternativos para os equinos tem aumentado, pois esses alimentos contêm “super fibras”, tornando a dieta mais segura para esses animais. Objetivando-se estudar a influência de dietas, contendo níveis crescentes de polpa cítrica sobre as concentrações sanguíneas de albumina, triglicérides, colesterol, glicose, insulina e ácidos graxos de cadeia curta, foram utilizados cinco animais, com idade média de 3,5 anos e peso vivo de 460,66±76,86kg, arraçoados duas vezes ao dia, às 7h e às 16h. As dietas foram formuladas para atender àdemanda de animais em mantença, sendo 60% da energia proveniente do volumoso e 40% do concentrado, contendo os seguintes níveis de inclusão de polpa cítrica(0, 7, 14, 21 e 28%). Foram calculadas a área abaixo da curva (AAC) e o pico da glicose e insulina, para as quais não foram observados efeitos das dietas. Não houve efeito da dieta sobre as concentrações sanguíneas dos parâmetros avaliados, bem como não houve efeito do tempo de coleta sobre as variáveis: ácidos graxos de cadeia curta, colesterol, triglicérides e albumina. Foi observado, porém, efeito quadrático para as concentrações de glicose (Ŷ = -0,5327X² + 4,2130X + 84,5276) e insulina (Ŷ = -0,1002X² +0,8233X + 1,6336). A polpa citrica pode ser incluida em até 28% no concentrado dos equinos, sem causar alterações nas concentrações sanguineas analisadas. Dietas com alta inclusão de fibra e participação de ingredientes com fibras de fácil fermentação são benéficas,pois mantêm as curvas glicêmicas e insulinêmicas próximas aos valores basais.
Termos para indexação: Fibra solúvel, nutrição, pectina, plasma.
INTRODUCTION
The horse is a non-ruminant herbivore capable of meeting most or all of its nutritional demands by ingesting forage (Brandi; Furtado, 2009). This species utilizes the fiber fraction of the diet because it has microflora in the cecum and colon that is capable of digesting fiber similarly to ruminants (Frape, 2008).
To make the diet safer, grain is being replaced by ingredients containing “super fibers”, as they are alternative high-energy ingredients for horses (Duren, 2000). These ingredients include citrus pulp, beet pulp and soybean hull (Furtado et al., 2011). According to Bampidis and Robinson (2006), citrus pulp has structural carbohydrates that are highly and quickly fermented, which makes them readily available for the animal (Rocha Filho et al., 1999).
Energy metabolism can be divided into two main metabolic pathways: glucose metabolism and lipid metabolism (Mcardle, 2001). The normoglycemia of the horse is maintained by two predominant metabolic pathways: carbohydrate intake and gluconeogenesis, predominantly using propionate (Frape, 2008). Diets with high concentrate concentrations or diets with processed concentrates result in higher glucose and insulin curves and indices (Gobesso et al., 2009), where as when no fiber is added to the diet, there are lower glucose curves and no peaks (Staniar et al., 2007), which indicates that this diet benefits the horse’s metabolism.
Vervuert et al. (2004), working with six horses fed corn processed in different ways (finely ground, steamed, micronized, steam-flaked and popped), evaluated the effects of the processing techniques on plasma glucose and insulin, but the treatments had no effect on the analyzed parameters, indicating that the glucose and insulin absorption is determined by the Area Under the Curve (AUC), which represents the total amount of glucose or insulin absorbed during a specific time interval. The larger the AUC, the higher the glycemic index of the feed (Pi-Sunyer, 2002).
The energy metabolism can be evaluated by some blood variables, such as triglycerides, cholesterol and short chain fatty acids (SCFAs) (Wittwer, 2000).
The microorganisms in the cecum and colon breakdown the fiber in the feed and convert it to SCFAs including acetic, propionic, lactic, isobutyric, butyric, isovaleric and valeric acids, which are responsible for supplying 30 to 70% of the total energy requirements of horses, depending on whether the diets have a higher fiber content or a higher soluble carbohydrate or starch content (Lewis, 2000). SCFA transport is performed using albumin, a plasma protein synthesized by the liver (Lehninger, 2006).
There are very few studies on the actions of fibers in the energy metabolism of horses. Triglycerides and cholesterol are routinely evaluated in experiments using oil in the diet (Hiney and Potter, 1996). Soluble
fiber may be responsible for the increase in intestinal transit time and is related to the reduced gastric emptying time (Buffington, 2003), there by increasing insulin sensitivity and promoting lower glycemic responses (Braga, 2008). Hodge et al. (2004) suggested that fiber offers human health benefits because it increases the number of insulin receptors, there by stimulating the use of glucose, decreasing the release of counterregulatory hormones (glucagon) and lowering the fasting and postprandial serum levels of cholesterol and triglycerides.
According to Thomas et al. (1991), Demarco et al. (1999), Jenkins et al. (2002) and Jiménez-Cruz et al. (2004), fiber intake leads to a slower and more prolonged increase in blood glucose levels, thus keeping the glucose levels more constant during rest or exercise. In turn, the intake of high glycemic index feeds results in a quick and marked increase in blood glucose, which leads to the secretion of large amounts of insulin, which could lead to hypoglycemia (Burke et al., 1993).
In humans, the intake of low glycemic index feeds leads to a lower release of postprandial plasma insulin, thus favoring the oxidation of fat over carbohydrates, there by resulting in a higher availability of SCFAs (Cocate et al., 2008).
Behall et al. (1997), Kerckhoffs et al. (2003) and Behall et al.(2004) demonstrated that diets supplemented with oat meal and barley promoted a significant decrease in total serum cholesterol in hypercholesterolimic humans, mainly due the action of β-glucans found in these foods, which can increase the synthesis of bile acids and reduce cholesterol absorption, there by leading to lower blood cholesterol.
The goal of this study was to evaluate the effects of diets that included different levels of citrus pulp on blood parameters related to energy metabolism in horses.
MATERIALS AND METHODS
The experiment was performed at the Horse Breeding Facility of the Pirassununga Campus. Five mixed-breed mares with a mean age of 3.5 years and a live weight of 460.6±76.86 kg were used in the study, these animals were housed in individual stalls.
by the Nutrient Research Council (NRC, 2007); 60%
of the energy came from the forage (Coast Cross hay), and 40% came from the concentrate, which contained increasing levels of citrus pulp (Tables 1 and 2). Were used three different hay during the experiment, during the first period and the second was used hay 1, hay 2
Table 1 – Percentage composition of the experimental concentrate (%DM).
Ingredient Citrus pulp level in the concentrate (%)
0 7 14 21 28
Ground corn 60.43 60.32 59.00 58.00 55.92
Soybean meal 3.90 6.20 5.73 7.95 9.45
Wheat bran 30.00 21.00 16.00 7.93 1.78
Citrus pulp 0 7 14 21 28
Premix* 0.67 0.67 0.67 0.67 0.67
Lime 2.86 2.30 1.82 1.33 0.81
Dicalcium phosphate 1.27 1.63 1.90 2.25 2.50
Salt 0.88 0.88 0.88 0.88 0.88
Guaranteed analysis: Linoleic acid: 3630 mg, Oleic acid: 3 mg, Calcium (min.): 150 g, Calcium (max.): 170 g, Phosphorous: 80 g, Sodium: 121 g, Potassium: 10 g, Sulfur: 4954 mg, Cobalt: 30 mg, Tyrosine: 34 mg, Copper: 1400 mg, Iodine: 200 mg, Chromium: 12 mg, Lysine: 4000 mg, Magnesium: 7225 mg, Manganese: 1400 mg, Phosphatidylcholine: 1000 mg, Methionine: 14 mg, Selenium: 27 mg, Iron: 2000 mg, Zinc: 3500 mg, Vitamin A: 85000KIU/kg, Vitamin C: 200 mg, Vitamin D: 8500 KIU/kg, Vitamin E: 200 mg, Saccharomycescerevisiae: 0.01500x10⁷CFU.
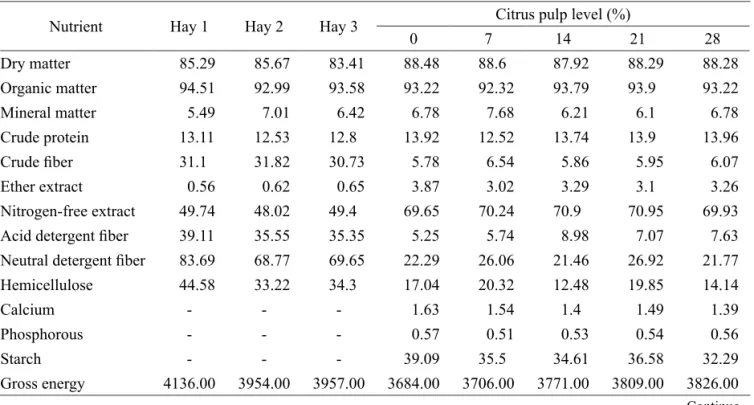
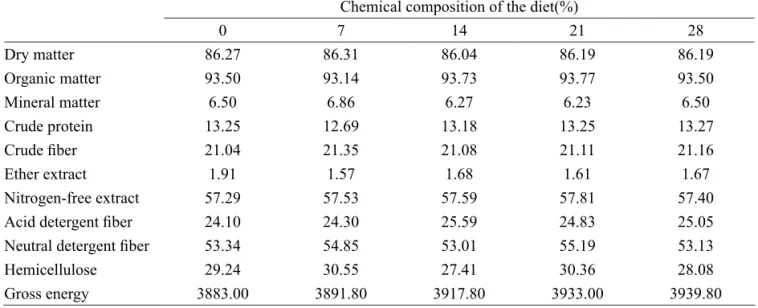
Table 2 – Chemical composition of the concentrates and experimental diets.
Nutrient Hay 1 Hay 2 Hay 3 Citrus pulp level (%)
0 7 14 21 28
Dry matter 85.29 85.67 83.41 88.48 88.6 87.92 88.29 88.28 Organic matter 94.51 92.99 93.58 93.22 92.32 93.79 93.9 93.22
Mineral matter 5.49 7.01 6.42 6.78 7.68 6.21 6.1 6.78
Crude protein 13.11 12.53 12.8 13.92 12.52 13.74 13.9 13.96 Crude fiber 31.1 31.82 30.73 5.78 6.54 5.86 5.95 6.07
Ether extract 0.56 0.62 0.65 3.87 3.02 3.29 3.1 3.26
Nitrogen-free extract 49.74 48.02 49.4 69.65 70.24 70.9 70.95 69.93 Acid detergent fiber 39.11 35.55 35.35 5.25 5.74 8.98 7.07 7.63 Neutral detergent fiber 83.69 68.77 69.65 22.29 26.06 21.46 26.92 21.77 Hemicellulose 44.58 33.22 34.3 17.04 20.32 12.48 19.85 14.14
Calcium - - - 1.63 1.54 1.4 1.49 1.39
Phosphorous - - - 0.57 0.51 0.53 0.54 0.56
Starch - - - 39.09 35.5 34.61 36.58 32.29
Gross energy 4136.00 3954.00 3957.00 3684.00 3706.00 3771.00 3809.00 3826.00
was used third period and for the fourth and fifth period hay 3 was used. The animals were fed twice a day, at 7:00 am and 4:00 pm. The diet adaptation period was seven days, followed by one day for blood collection, which took place before feeding and 1, 3, 6 and 9 hours after feeding.
Chemical composition of the diet(%)
0 7 14 21 28
Dry matter 86.27 86.31 86.04 86.19 86.19
Organic matter 93.50 93.14 93.73 93.77 93.50
Mineral matter 6.50 6.86 6.27 6.23 6.50
Crude protein 13.25 12.69 13.18 13.25 13.27
Crude fiber 21.04 21.35 21.08 21.11 21.16
Ether extract 1.91 1.57 1.68 1.61 1.67
Nitrogen-free extract 57.29 57.53 57.59 57.81 57.40
Acid detergent fiber 24.10 24.30 25.59 24.83 25.05
Neutral detergent fiber 53.34 54.85 53.01 55.19 53.13
Hemicellulose 29.24 30.55 27.41 30.36 28.08
Gross energy 3883.00 3891.80 3917.80 3933.00 3939.80
Table 2 – Continued.
The blood samples were taken by jugular venipuncture, using vacuum collection tubes with no anticoagulant to determine albumin, triglyceride and cholesterol levels.Vacuum collection tubes with sodium fluoride were used for the glucose and insulin samples, and vacuum collection tubes with heparin were usedfor the SCFAs. After collection, the samples were sent to the laboratory, where they were centrifuged, and the serum and/or plasma was removed and placed in labeled Eppendorf® tubes.
To determine the levels of the biochemical variables (glucose, insulin, cholesterol, triglycerides and albumin), Laborlab® kits were used, and the samples
were read in a semi-automatic spectrophotometer (Bio-2000). To determine the insulin variable, was used biochemical Roche Diagnostics® kit, using the
technique of electrochemiluminescence.
In the determination of SCFAs, the serum was centrifuged at 1500rpm for 10 minutes; subsequently, 1 ml of the supernatant serum was moved to a 10 ml test tube, to which 5 ml of ethanol was added. The sample was again centrifuged at 3000 rpm for 10 minutes. After the sample was removed from the centrifuge, the supernatant was transferred to a 10 ml test tube containing 40 µl of 1 mM NaOH (sodium hydroxide). The tube was place in a forced ventilation oven at 60°C until completely dry; then, the residue in the tube was dissolved in 99% formic acid. Finally, 1 ml of distilled water was added for reading in a gas chromatograph.
The AUC concentrations were calculated using the trapezoidal rule (Gibaldi and Perrier, 1982) for plasma
glucose and serum insulin concentrations, excluding the area under the baseline values (fasting).
The blood variables of glucose, cholesterol, triglycerides, albumin and SCFAs were evaluated by a linear mixed model that includes the effects of the diet, the time of collection and the interaction between the factors, considering that the measurements were repeated in the same experimental unit (animals fed each diet). The results were analyzed using the Statistical Analysis System software (SAS, 2004).
This study was approved by the Ethics in Research Committee of the Faculty of Animal Science and Food Engineering, University of São Paulo under the case number 2012.1.1326.74.4 being in accordance with the ethical principles of animal experimentation.
RESULTS AND DISCUSSION
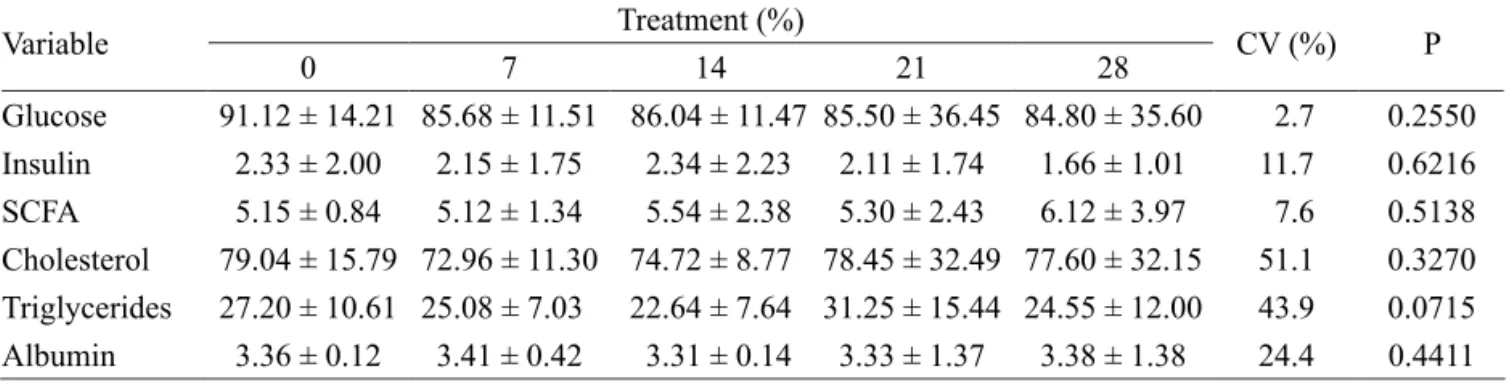
There was no effect (P>0.05) of the diets on the blood concentrations of glucose, insulin, SCFAs, cholesterol, triglycerides and albumin (Table 3). Diets that maintain the glucose and insulin curves closer to baseline values have been sought to avoid the development of insulin sensitivity (Braga, 2008), in addition to keeping the equine diet safer by removing starch (Vervuert et al., 2004) and introducing easily fermentable fibers (Duren, 2000).
have beneficial features such as: delay gastric emptying and intestinal transit, increase the absorption of water (reducing the occurrence of diarrhea), increase glucose tolerance and decrease the levels of total cholesterol.
The study of SCFAs, triglycerides and cholesterol can predict the energy metabolism of the animal. Given that in the present study the animals were fed to meet maintenance requirements, energy deposition was not expected, this result was confirmed because the animals maintained their weight during the study, and there was no alteration of lipid metabolism. The stability of these parameters is already an indicator of the possibility of substituting the traditional wheat bran for citrus pulp in the diets.
Studies of the effects of fiber on blood parameters analyzed in this work are scarce, thus justifying the data discussion with other species such as humans and ruminants.
As a small percentage of easily fermentable fibers were used in the diet (up to 28% of the concentrate), there were no changes in the blood concentration of SCFAs. There are few studies on the blood concentration of this parameter; however, Lewis (2000) stated that SCFAs are responsible for providing 30 to 70% of the total energy requirements of horses. There was no effect of the diet on blood SCFA concentrations, possibly due to the similarity of the composition of the diets; both the diet containing wheat bran (beta-glucan source) (Oakenfull and Topping, 1987 and Stevenson et al., 2012) and the diet with citrus pulp (pectin source) (Hall et al., 1999; Miron et al., 2001; Muller and Prado, 2005) had easily fermentable fibers that may have had the same effects on the microorganisms in the hindgut, promoting a similar fermentation profile.
Maintaining the SCFA concentrations may have also reduced the effects of the diet on the serum concentrations of albumin, as this protein is responsible for transporting SCFA in the blood. Furthermore, offering a balanced diet kept the animals nourished, as serum albumin
variation is also an indicator of protein deficiency (Wittwer et al., 1987), which was not observed in the present study.
As there was no variation in the SCFA concentrations, maintenance ofthe serum levels of triglycerides and cholesterol was expected. All the values obtained in this study agree with the literature regarding blood concentrations of such parameters to equines (Rey et al., 2001; Radostitis et al., 2002; Dugat et al., 2011).
Some factors may have influenced this stability, such as a higher percentage of forage in the diet and the presence of soluble fibers, which may have contributed to an increase in the synthesis of bile acids and reductions in cholesterol and triglyceride absorption, which could result in the stability of these plasma variables (Kerckhoffs et al., 2003), aside from the fact that easily fermentable fibers and cellulose are hypocholesterolemic agents (Judd and Truswell, 1982; Anderson et al., 1998).
Another relevant point is that there was a low percentage of ether extract in the diet of this study (average of 1.69%), which may have contributed to the non-stimulation of this energy-generating pathway.
The predominance of fiber observed in the present study may have helped to delay gastric emptying (Capito and Filisetti, 1999), which may have contributed to keeping low levels of cholesterol, glucose and insulin.
The use of a diet with low levels of corn in the present study, to meet the recommendations of Vervuert et al. (2004) regarding the level of starch intake, in addition to the equivalence in the formulation of the experimental concentrates, may have contributed to the absence of effects of the diet on blood glucose and blood insulin. Furthermore, the diets were formulated with minimum levels of corn (average of 58.73%, table 1), which may also have contributed to this lack of an effect. As already mentioned, using 75% dry matter from forage may also have somewhat influenced this result.
Table 3 – Effect of the diets on the variables (glucose (mg/dL), insulin (μU/ml), SCFAs (mmol/L), cholesterol (mg/dl),
triglycerides (mg/dl) and albumin (g/dl)).
Variable Treatment (%) CV (%) P
0 7 14 21 28
There was no effect (p>0.05) of the time of collection on the SCFAs, cholesterol, triglycerides or albumin (Table 4), but there was an effect (p<0.05) on glucose and insulin (Table 4). As predicted, there was an effect of the time of collection (p<0.05) on blood glucose and insulin. There was a quadratic effect (Table 4), which indicates that there is a postprandial increase and a return to values closer to the baseline eight hours after feeding. This prolonged period of glycemic and insulinemic stability at higher levels of citrus pulp can be considered beneficial, as it contributes to a constant energy supply between feedings, as observed by Thomas et al. (1991) and Demarco et al. (1999). According to those authors, fiber intake causes a slower and more prolonged increase in the blood glucose concentration, which favors maintaining the blood glucose at more constant levels during rest or exercise. Teixeira Neto (2003) and suggested that diets rich in fiber have low glycemic indices, which can reduce calorie intake in subsequent feedings due to the amount of glucose absorbed by the animal.
This consistency in energy supply can be proven by the absence of dietary effects on the peaks and AUC of glucose and insulin (p>0.05). The values obtained by the plasma glucose and insulin peaks contradict those observed by Witham and Stull (1998) who reported that in horses, plasma glucose peaks
were observed 2 to 3 hours after feeding, and insulin peaks were observed between 3 and 4 hours after feeding. Such a difference can be attributed to the action of the fibers.
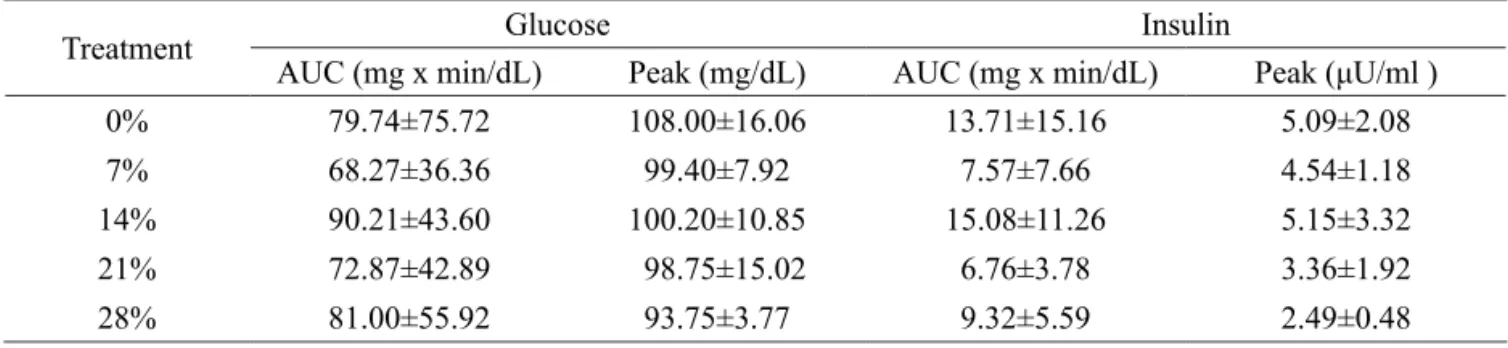
There was no effect of the diet (p>0.05) on the AUC or the glucose or insulin peaks (Table 5).This consistency in energy supply can be proven by the absence of dietary effects on the peaks and AUC of glucose and insulin (p>0.05). The values obtained by the plasma glucose and insulin peaks contradict those observed by Witham and Stull (1998) who reported that in horses, plasma glucose peaks were observed 2 to 3 hours after feeding, and insulin peaks were observed between 3 and 4 hours after feeding. Such a difference can be attributed to the action of the fibers.
The intake of low glycemic index foods may have led to a lower postprandial plasma insulin release, favoring the oxidation of fat instead of carbohydrates, resulting in a higher availability of SCFAs (Cocate et al., 2008), which was not observed in the present study.
The fluctuations between peak and resting levels vary according to the type of diet: diets with more grains and less forage cause higher peaks and reduced decreases (Ralston and Baile, 1982; Guezennec et al., 1995). This trend was not observed in this study due to the predominance of forage in the diet.
Table 4 – Effect of blood collection time on the variables (SCFAs (mmol/L), cholesterol (mg/dl), triglycerides (mg/
dl), albumin (g/dl), glucose (mg/dL), and insulin (μU/ml)).
Variable Time (hours) CV (%) P
0 1 3 6 9
SCFA 5.01±1.56 5.47±2.10 5.74±2.36 5.53±2.68 5.47±3.30 12.0 0.8221 Cholesterol 76.61±22.61 77.74 ±24.34 78.81±26.53 74.90±22.14 74.71±21.70 2.6 0.6954 Triglycerides 24.69±9.82 26.60±12.84 24.43±10.72 26.71±10.87 28.63±11.53 4.3 0.5600 Albumin 3.37±0.94 3.44±1.04 3.33±0.93 3.32±0.93 3.33±0.93 1.5 0.5095 Glucose 84.5276+4.2130X-0.5327X²
Insulin 1.6336+0.8233X-0.1002X²
Table 5 – Areas under the insulin and glucose curves and their respective peaks per treatment.
Treatment Glucose Insulin
AUC (mg x min/dL) Peak (mg/dL) AUC (mg x min/dL) Peak (μU/ml )
0% 79.74±75.72 108.00±16.06 13.71±15.16 5.09±2.08
7% 68.27±36.36 99.40±7.92 7.57±7.66 4.54±1.18
14% 90.21±43.60 100.20±10.85 15.08±11.26 5.15±3.32
21% 72.87±42.89 98.75±15.02 6.76±3.78 3.36±1.92
CONCLUSIONS
Citrus pulp is a promising ingredient, and it can represent up to 28% of the concentrate for horses without causing any alterations in blood glucose, insulin, cholesterol, triglycerides and SCFAs.
Diets that are rich in fiber and have ingredients with easily fermentable fibers offer benefits to equine diets because these diets maintain the blood glucose and insulin curves close to baseline and delay the postprandial glucose decrease.
REFERENCES
ANDERSON, J.W.; GUSTAFSON N.J.
Hypocolesterolemic effect of oat and bean products. The American Journal of Clinical Nutrition. 48:749-753, 1988.
BAMPIDIS, V.A.; ROBINSON, P.H. Citrus by-products as ruminant feeds: A review. Animal Feed Science and Technology. 128:175-217, 2006.
BEHALL, K.M.; SCHOLFIELD, D.J.;
HALLFRISCH, J. Effect of beta-glucan level in oat fiber extracts on blood lipids in men and women. Journal of the American College Nutrition. 16:46-51, 1997.
_______________. Diets containing barley significantly reduce lipids in mildly hypercholesterolemic men and women. The American Journal of Clinical Nutrition. 80(5):1185-1193, 2004.
BRAGA, A.B. et al. Neutral detergent fiber levels in diets for horses. Revista Brasileira de Zootecnia. 37(11):1965-1972, 2008.
BRANDI, R.A.; FURTADO, C.E. Nutritional and metabolic importance of fiber in equine diets. Revista Brasileira de Zootecnia. 38:246-258, 2009.
BUFFINGTON, C. Morbid Obesity. Beyond Change. 4:73-108, 2003.
BURKE, L.M.; COLLIER, G.R.; HARGREAVES, M. Muscle glycogen storage after prolonged exercise: effect of the glycemic index of carbohydrate feedings.
Journal of Applied Physiology. 75(2):1019-1023, 1993.
CAPITO, S.M.P.; FILISETI, T.M.C.C. Inulin: a promising food ingredient. Journal of Brazilian Society for Food and Nutrition. (18):1-11, 1999.
COCATE, P.G.; ALFENAS, R.C.G.; PEREIRA, L.G. Glycemic index: metabolic and physiological responses before and after physical activity. Revista Mackenzie de Educação Física e Esporte. 7(2):109-117, 2008.
DEMARCO, H.M. et al. Pre-exercise carbohydrate meals: application of glycemic index. Medicine and Science in Sports and Exercise. 31(1):164-170, 1999.
DUGAT, S.L. et al. Values for triglycerides, insulin, cortisol and ACTH in a herd of normal donkeys. Journal of Equine Veterinary Science. 30(3):141-144, 2011.
DUREN, S. Feeding the endurance horse. Kentucky Equine Research. 2:351-363, 2000.
FRAPE, D. Equine nutrition & feeding. 3.ed. São Paulo: Roca. 602 p. 2008.
FURTADO, C.E.; BRANDI, R.A.; RIBEIRO, L.B. Use of by-products and alternative feeds for equine diets in Brazil. Revista Brasileira de Zootecnia. 40(Suppl): 232-241, 2011.
GIBALDI, M.; PERRIER, D. Pharmacokinetics. 2ª ed. V.15, New York: Marcel Dekker,1982.
GOBESSO, A.A.O.; ETCHICHURY, M.; TOSI, H. Plasma glucose and insulin response in horses fed with different starch sources. Brazilian Journal of Veterinary Research and Animal Science. 46(4):324-331, 2009.
GUEZENNEC C. Oxidation rates, complex carbohydrates and exercise. Sports Medicine. 19(6):365-372, 1995.
HALL, M.B. at al. A method for partitioning neutral detergent-soluble carbohydrates. Journal of the Science of Food and Agriculture. 79(15):2079-2086, 1999.
HODGE, A.M. et al. Glycemic index and dietary fiber and the risk of type 2 diabetes. Diabetes Care. 27(11):2701-2706, 2004.
HOFFMAN, R.M. et al. Hydrolyzable carbohydrates in pasture, hay, and horse feeds: Direct assay and seasonal variation. Journal of Animal Science. 79(2):500-506, 2001. JENKINS, D.J. et al. Soluble fiber intake at a dose approved by the US Food and Drug Administration for a claim of health benefits: serum lipid risk factors for cardiovascular disease assessed in a randomized controlled crossover trial.
American Journal of Clinical Nutrition.75:834-839, 2002.
JIMÉNEZ-CRUZ, A. et al. A high-fiber, moderate-glycemic-index, Mexican style diet improves dyslipidemia in individuals with type 2 diabetes. Nutrition Research. 24(1):19-27, 2004.
JUDD, P.A.; TRUSWELL, A.S. Comparison of the effects of high and low methoxyl pectin on blood and faecal lipids in man. The British Journal of Nutrition. 48(3):451-458, 1982.
KERCKHOFFS, D.A.J.M.; HORNSTRA, G.;
MENSINK,R. Cholesterol-lowering effect of β-glucan from oat bran in mildly hypercholesterolemic subjects may decrease when β-glucan is incorporated into bread and cookies. The American Journal of Clinical Nutrition. 78(2):221-227, 2003.
LEHNINGER, A.L. Princípios de Bioquímica. 4. ed. São Paulo: SARVIER, 1202p. 2006.
LEWIS, L. Nutrição Clínica Equina: Alimentação e Cuidados. São Paulo: Roca.710p. 2000.
McARDLE, W.D. Exercise Physiology – Energy, Nutrition and Human Performance. 5.ed. Rio de Janeiro. Guanabara Koogan, 1104p. 2001.
MIRON, J.; YOSEF, E.; BEN-GHEDALIA, D. Composition and in vitro digestibility of monosaccharide constituents of selected by product feeds. Journal of Agricultural and Food Chemistry. 49(5):2322-2326, 2001.
MULLER, M.; PRADO, I.N. Metabolismo da Pectina em animais ruminantes. Uma Revisão. Revista Varia Scientia. 4(8):45-56, 2005.
NRC. National Research Council of the National Academies: Nutrient Requirements of Horses. 6th edition. Washington, D.C.: National Academy Press. 341p. 2007.
OAKENFULL, D.G.; TOPPING, D.L. The nutritional value of wheat bran. Food Technology in Australia. 39:288-292, 1987.
OLIVEIRA, C.A.A.; ALMEIDA, F.Q.; VIEIRA. A.A. Kinetics of the passage of digesta and water and nitrogen balance in horses fed diets with different ratios of roughage and concentrate.
Revista Brasileira de Zootecnia. 32(1):140-149, 2003.
PI-SUNYER, F.X. Glycemic index and disease. The American Journal of Clinical Nutrition. 76(1):290-298, 2002.
RADOSTITIS, O.M. et al. Veterinary Medicine: a text book of the diseases of cattle, horses, sheep, pigs and goats. Rio de Janeiro: Guanabara Koogan. p.1648. 2002.
RALSTON, S.L.; BAILE, C.A. Plasma glucose and insulin concentrations and feeding behavior in ponies. Journal of Animal Science. 54(6):1132-1137, 1982.
REY. F.; HALLEBEEK, J.M.; BEYNEN, A.C. Apparent digestibility of crude fiber in ponies fed either a low or high-protein diet. Journal of Animal Physiology and Animal Nutrition. 85:251-254, 2001.
ROCHA FILHO, R.R. et al. Citrus pulp and corn production and fatty acid volatile rumen. Science and Agriculture. 56(2):471-477, 1999.
SANTOS, T.M. et al. Capacidade tamponante, pH e consistência das fezes em equinos submetidos à sobrecarga dietética com amido. Ciência Rural. 39(6):1782-1788,
2009.
SARTORELLI, D.S.; CARDOSO, M. Association between dietary carbohydrates and type 2 diabetes mellitus: epidemiological evidence. Arquivo Brasileiro de Endocrinologia e Metabolismo. 50:415-426, 2006.
STANIAR, W.B. et al. Glucose and insulin responses to different dietary energy sources in thorough bred broodmares grazing cool season pasture. Livestock Science. 111:164-171, 2007.
TEIXEIRA NETO, F. Clinical Nutrition. Rio de Janeiro, RJ: Guanabara Koogan, 548p. 2003.
THOMAS, D.; BROTHERHOOD, J.; BRAND, J.C. Carbohydrate feeding before exercise: effect of the glycemic index. International Journal of Sports Medicine.12:180-186, 1991.
VERVUERT, I.; COENEN, M.; BOTHE, C. Effects of corn processing on the glycaemic and insulinaemic responses in horses. Journal of Animal Physiology. 88:348-355, 2004.
WITHAN, C.L.; STULL, C.L. Metabolic responses of chronically starved horses to refeeding with three isoenergeticdiets. Journal of the American Veterinary Medical Association. 12(5):691-696, 1998.
WITTWER, F. et al. Analysis of the results of metabolic profiles in dairy herds in Chile. Archives of Medical Veterinary. 19:35-45, 1987.
WITTWER, F. Biochemical markers in controlling metabolic nutritional disorders in dairy cows. In: GONZÁLEZ, F. H. D. et al. (Eds.) Metabolic
profile of ruminants: its use in nutrition and