UNIVERSIDADE DE TRÁS-OS-MONTES E ALTO DOURO
Capillary electrophoresis of serum proteins across the lifespan and different metabolic stages in sheep
Master Dissertation in Veterinary Medicine José Arthur de Abreu Camassa
Supervisors:
Professora Doutora Maria Isabel Ribeiro Dias Professor Doutor Carlos Alberto Antunes Viegas
UNIVERSIDADE DE TRÁS-OS-MONTES E ALTO DOURO
Capillary electrophoresis of serum proteins across the lifespan and different metabolic stages in sheep
Master Dissertation in Veterinary Medicine José Arthur de Abreu Camassa
Supervisors
Professora Doutora Maria Isabel Ribeiro Dias Professor Doutor Carlos Alberto Antunes Viegas
Composition of Jury
President: Maria da Conceição Medeiros Castro Fontes Vogal: Amelia Maria Lopes da Silva
Vogal: Ana Cristina Silvestre Ferreira Supervisior: Carlos Alberto Antunes Viegas
III DECLARATION
NAME: José Arthur de Abreu Camassa C.C: 31571421
TELPHONE: (+351) 913929566 E-MAIL: camassa.vet@gmail.com
GRADUATE DEGREE DESIGNATION: Integrated Master in Veterinary Medicine.
DISSERTATION TITLE: Capillary electrophoresis of serum proteins across the lifespan and different metabolic stages in sheep
SUPERVISORS: Professora Doutora Maria Isabel Ribeiro Dias; Professor Doutor Carlos Alberto Antunes Viegas.
YEAR OF CONCLUSION: 2017.
I, José Arthur de Abreu Camassa, declare that the contents of this Dissertation are my own work and that they have not been presented to any University other than the University of Trás-os-Montes and Alto Douro.
Vila Real, Junho de 2017 José Arthur de Abreu Camassa
V Acknowledgements
At the moment that I finish this work I want to thank all those who contributed to its realization. I acknowledge the University of Trás-os-Montes e Alto Douro (UTAD), in the person of Rector António Augusto Fontainhas Fernandes, for authorizing and giving conditions to execute this work.
I acknowledge my supervisors, Professora Isabel Dias and Professor Carlos Viegas, the great mentors of this work.
I acknowledge INNO laboratory for their technical contribution especially to Dr. Paula Brilhante Simões and M.V. Augusto Sousa da Silva.
I acknowledge all medical and auxiliary staff from UTAD-Veterinary Hospital for their cooperation and friendship.
To my girlfriend, Camila Cardoso Diogo for all love and patience during this journey. To my parents and brothers for all love and support even with an ocean away.
ABSTRACT
In recent years, sheep have been used extensively in animal and veterinary sciences research and also as a large animal model for pre-clinical and translational research due to similarities with humans. Determining the serum protein electrophoretic pattern in sheep could not only provide useful information on the species, but also on the influence of variables such as age and
physiological state. Nevertheless, the objectives of this study were the characterization and evaluation of the serum concentration of total protein and their fractions, as determined by free-solution capillary electrophoresis in ewes of different ages and physiological states. For that purpose, eighty ewes were divided according to age or physiological state in eight groups. Blood samples were drawn during the same season and in the same flock, and serum protein
electrophoresis was performed by an automated system. Reference intervals (95% confidence intervals) for total protein and each protein fraction values were determined by parametric or non-parametric methods depending on normality of data distribution. There were significant differences between the reference range per different ages, for total protein, albumin, alpha 1 and alpha 2, and gamma globulins. Physiological states groups showed significant differences
between dry and lactation groups for total protein and beta globulin values. Total protein and protein fractions gradually increased across the lifespan, and decreased after 8 years of age. The knowledge obtained via this study helps validate the influence of age and physiological states on serum protein variability, which could be used for diagnostic and research purposes.
VII RESUMO
Nos últimos anos, as ovelhas têm sido amplamente utilizadas em pesquisas de ciências
veterinárias e animais, e também como modelo animal de grande porte para ensaios pré-clínicos e translacionais devido às semelhanças com humanos. A determinação do padrão eletroforético de proteínas séricas em ovelhas não apenas pode fornecer informações úteis sobre a espécie, mas também sobre a influência de variáveis como idade e estado fisiológico. Desta forma, o objetivo deste estudo foi a caracterização e avaliação da concentração da proteína total e das suas frações séricas, determinadas pela eletroforese por capilaridade de solução livre em ovelhas de diferentes idades e estados fisiológicos. Para este propósito foram utilizadas oitenta ovelhas divididas em oito grupos de acordo com a idade e o estado fisiológico. As amostras sanguíneas foram colhidas no mesmo rebanho e durante a mesma estação do ano e a eletroforese proteica sérica foi realizada por um sistema automatizado. O intervalo de referencia (95% intervalo de confiança) para os valores de proteína total e para as frações proteicas foram determinados por métodos
paramétricos ou não paramétricos, dependendo da normalidade da distribuição dos dados. Comprovaram-se diferenças estatisticamente significativas entre os intervalos de referência por idades diferentes, para os parâmetros proteína total, albumina, alfa-1, alfa-2 e gama globulinas. Relativamente aos grupos com diferentes estados fisiológicos encontraram-se diferenças
significativas para os valores de proteína total e de beta globulina entre os grupos seco e lactante. Os valores de proteína total e das frações séricas aumentam gradualmente durante a vida das ovelhas, diminuindo após os 8 anos de idade. O conhecimento obtido com este estudo ajuda a confirmar a influência da idade e dos estados fisiológicos na variabilidade dos valores de proteína sérica, o que pode ser aplicado na clínica e na investigação.
Table of Contents Acknowledgements ... V ABSTRACT ... VI RESUMO ... VII Index of Figures ... X Index of Tables ... XI Abbreviations List ... XII
Section I - A review of the scientific literature ... 1
1. Electrophoresis ... 1
1.1 Zone electrophoresis ... 1
1.2 Paper electrophoresis ... 2
1.3 Gel electrophoresis ... 2
1.4 Moving boundary electrophoresis ... 4
1.5 Capillary electrophoresis ... 4
2. Serum Proteins ... 5
3. Serum protein fractions... 6
3.1 Albumin... 6
3.2 Alpha globulins ... 7
3.3 Beta globulins ... 8
3.4 Gamma globulins... 9
4. Use of electrophoresis in veterinary studies ... 10
4.1Electrophoresis studies in dogs ... 11
4.2 Electrophoresis studies in cats ... 12
4.3 Electrophoresis studies in horses ... 13
4.4 Electrophoresis studies in goats ... 15
4.5 Electrophoresis studies in sheep... 16
5. The use of sheep as a large animal model for pre-clinical and translational studies .... 18
6. Churra-da-Terra-Quente sheep ... 19
Section II – Original Article ... 21
1. Aims ... 21
2. Material and Methods ... 21
IX
2.2 Blood sampling ... 22
2.3 Determination of total protein ... 22
2.4 Separation of serum proteins by capillary electrophoresis ... 22
2.5 Statistical analysis... 22
3. Results ... 23
4. Discussion ... 29
5. Conclusion ... 32
Index of Figures
Figure 1. Representative apparatus paper electrophoresis. Source: Dipa et al. (2016). ... 2
Figure 2. Representative gel electrophoresis. Source: Dipa et al. (2016). ... 3
Figure 3. Representative electrophoresis in moving boundary. Source: Dipa et al. (2016) ... 4
Figure 4. Representative electrophoresis by capillary. Source: Dipa et al. (2016). ... 5
Figure 5. Box plot presentations of serum concentrations of total protein and protein fractions by age .... 25
Figure 6. Box plot presentations of serum concentrations of total protein and protein fractions by age .... 26
Figure 7. Box plot presentations of serum concentrations of total protein and protein fractions by physiologic stages... 27
Figure 8. Box plot presentations of serum concentrations of total protein and protein fractions by physiologic stages... 28
XI Index of Tables
Table 1. Values for the studied parameters across the lifespan in sheep ... 23 Table 2.Values for the studied parameters per physiological stage in sheep ... 24
Abbreviations List
A / G: Albumin - Globulins ratio a.m: Ante meridiem
ANCOTEQ: Associação nacional dos criadores de Churra-da-Terra-Quente ANOVA: Analysis of variance
CTQ: Churra-da-Terra-Quente
DOP: Denomination of protected origin IBM: International Business Machine Ig: Immunoglobulin IgA: Immunoglobulin A IgD: Immunoglobulin D IgE: Immunoglobulin E IgG: Immunoglobulin G IgM: Immunoglobulin M Kg: Kilogram
NY: New York
rpm: Revolutions per minute SD: Standard deviation
SPSS: Statistical Package for the Social Sciences USA: United States of America
volt: Voltage α: Alpha β: Beta γ: Gamma μm: Micrometer °C: Degrees Celsius %: Percent
Section I - A review of the scientific literature 1. Electrophoresis
Protein electrophoresis is a standard method for fractionation and quantification of serum proteins. The methods of separations are of different forms. In stabilizing media such as gel, filaments and plates or without support phases as in capillary electrophoresis in free solution separation. Electrophoretic mobility is the movement of particles under the influence of an electric field of 1 volt per meter, resulting in an electrophoretic rate of square meters per second volt (Rudge and Monning, 2000).
The electrophoretic mobility is influenced by each electrolyte under specific and precise conditions, and is specific for each method presenting a direct measurement when compared to another substance (Sheehan, 2009).
The molecular weight and shape influences the movement. In this way higher molecular weight or shape move slower. Summarizing, when the technique is applied in mixtures, it is shown the presence of different bands on the gel or paper (Rudge and Monning, 2000).
The types of electrophoresis can be divided in two categories based on method; zone electrophoresis (Paper electrophoresis, Gel electrophoresis, Thin layer electrophoresis and Cellulose acetate electrophoresis) and moving boundary electrophoresis (capillary electrophoresis, isoatchophoresis, isoelectric focussing and immuno electrophoresis). There are other types that do not fit into the previous categories (affinity electrophoresis, dielectrophoresis, electroblotting and plused field gel electrophoresis) (Dipa and Surati, 2016).
1.1 Zone electrophoresis
A small amount of sample is applied. As a narrow zone or local area of a column, plate or buffer film. The migration leads to complete separation of the bands, which is prevented from regrouping again by thermal convection due to the stabilization of the electrolyte in a porous matrix or fibrous material such as paper, gel, starch, agar or polyacrylamide.
2
The factors that interfere with the migration rate are; mobility of the charged particle, the electro-endosmotic flow, the evaporation flow, and the strength of the electric field. The method requires the use of reference substances and handling under well-defined conditions (Smith, 1960).
1.2 Paper electrophoresis
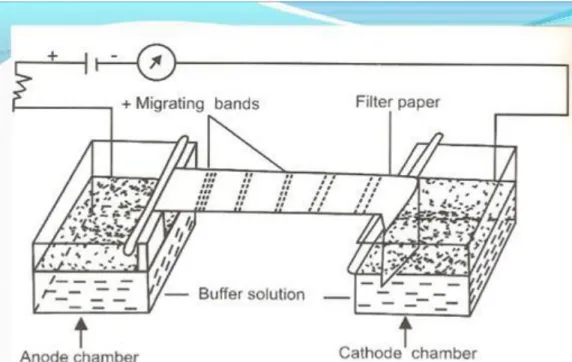
The technique consists of the use of Whattman filter paper No.1® moistened with a buffer
solution, the sample is applied at one end, connected to an electric current with opposing electrodes at the ends (Figure 1). After the paper is dried and stained to check the bands, and compared to a standardized sample. When analyzing a serum sample, it is possible to check five bands in the paper electrophoresis (Mackay and Volwiler, 1954).
Figure 1. Representative apparatus paper electrophoresis. Source: Dipa et al. (2016).
1.3 Gel electrophoresis
The method consists of the analysis of macromolecules using the size and the electric charge of the proteins for the separation. In agarose gel used only electric charge due to pores in agarose are large for sieve the macromolecules (Figure 2). A mixed population of DNA or RNA is separated based on length due through the electric field, the negative molecules are moved through the agarose gel or other substance (Lee et al., 2012). Nanoparticles can also be separated in gel electrophoresis (Hasenoehrl et al., 2012).
As previously reported lighter and smaller molecules migrate faster, and it is possible due to use the pores of the gel, this process is called sieving.
In polyacrylamide gel the mobility respect the charge of molecule, length and conformation as in agarose gel. The molecules may be mixed with a denaturant and processed in an unstructured linear chain, thus the molecule will move under length, mass and charge influence (Lee et al., 2012).
In most proteins, there are an equal fractionation of charge per unit mass with denaturant use however, for instance, many membrane proteins do not have the same charge distribution due to greater hydrophobic content, and may hinder the accuracy of the results. The urea is used as denaturant for nucleic acids and sodium dodecyl sulfate for protein samples (Roy and Kumar, 2012).
4 1.4 Moving boundary electrophoresis
The method consists of a buffered solution of proteins in a U-shaped cell, an electric current being applied, causing the proteins to be placed in layers depends of mobility velocity, which are placed by boundaries (Figure 3). It is necessary to perform refractometry or conductimetry measurements to locate the boundaries and obtain the data. The method is indicated mainly for substances of high relative molecular weight and low diffusibility (Cann and Goad, 1965).
Figure 3. Representative electrophoresis in moving boundary. Source: Dipa et al. (2016).
1.5 Capillaryelectrophoresis
Over the past two decades, the capillary electrophoresis has had an extensive clinical validation for protein profile (Petersen et al., 2003), being first reported by Jorgenson and Lukas (1981) with the possibility of separation efficiency in bands using a system for performing zone electrophoresis in open tubular glass capillaries (Figure 4) (Jorgenson and Lukas, 1981) but it was developed by Arne Tiselius in 1930. Therefore, the capillary electrophoresis is advanced method compared to other conventional electrophoresis methods due to multiple factors such as ease of use with high speed and high resolution separations, total automation, immediately analyzed (Petersen et al., 2003; Giordano et al., 2010; Dipa et al., 2016), optical detection of the proteins which avoids quantitation errors caused by staining and destaining and variability in protein dye binding (Lehmann et al., 1997).
Figure 4. Representative electrophoresis by capillary. Source: Dipa et al. (2016). 2. Serum Proteins
A protein is a linear polymer composed of one or more long chains of amino acids linked by peptide bonds. In blood (serum or plasma) are the major components and have been involved in different functions. The functions occurring in almost all organism, including the maintenance of colloid osmotic structure, catalysis of biochemical reactions and buffering acid-base balance, transport of lipids, hormones, vitamins and minerals in the circulatory system and the regulation of acellular activity, functioning of the immune system (Kaneko et al., 2008) and coagulation (Meyer and Harvey 2004).
Hepatocytes produced and secreted many serum proteins however, immunoglobulins are produced by reticuloendothelial tissues, lymphoid and plasma cells (Eckersall 2008). Nevertheless, other tissues can synthesize serum proteins including the intestine (Alpers, 1972), lung (Massaro et al., 1971), adipose tissue (Emery et al., 1983) and mammary gland (Rius el al., 2010).
In human plasma, believed to keep thousands of distinct proteins, and in serum proteome there are nearly 3700 chromatographically separated protein spots on two-dimensional electrophoresis gels and identification of 325 distinct proteins by mass spectrometry (Pieper et al., 2003).
6
In veterinary medicine, serum protein determination is a common proven technique (Zaias et al., 2009). In domestic species, electrophoresis has been a proven diagnostic technique for disease monitoring (Ferlizza et al., 2015; Riond et al., 2009).
3. Serum protein fractions 3.1 Albumin
Albumin is produced exclusively by some organelles in the cytoplasm of the hepatocyte; the rate of synthesis is maintained controlled by colloid osmotic pressure at 33% maximal capacity in heathy animals (Busher, 1990; Kahn, 2010). Colloid osmotic or oncotic pressure has the albumin as the main factor for regulates passage of water and diffusible solutes through the capillaries because this protein does not diffuse trough intact vascular endothelium (Busher, 1990). Abumin accounts for 35% to 50% of serum total protein, being the major protein fraction in serum however, only 30% to 40% of albumin can be found in blood, the other part is in interstitial space (Kaneko et al., 2008). Other body tissue fluids also can be found albumin like gastric juice, tears and sweat (Busher, 1990). The catabolism occurs in different tissues like muscle, liver and kidney and his turnover is correlated with the body size (Tothova et a., 2016).
Albumin plays different functions such as maintaining the colloid osmotic pressure, transport protein in which metabolites in blood link to this protein. Binding to albumin avoid loss of important small molecules by the kidney such as hormones, bilirubin, vitamins, drugs and metals. The binding to fatty acids and keeping them in soluble form in the plasma is explanation of hyperlipemia occurs in clinical situations of hypoalbuminemia (Busher, 1990; Kahn, 2010).
Albumin synthesis can be affected by protein and amino acid nutrition, colloidal osmotic pressure, the action of some hormones and disease states. One the most frequently pathological albumin pattern is hypoalbuminemia (Tothova et al., 2016). Inadequate protein intake leads to reduced albumin synthesis while there is dietary deficiency. Thus, a diet high in amino acids increases the synthesis of albumin by the liver and a decrease in colloidal pressure also stimulates the synthesis of albumin (Busher, 1990). Hypoalbuminemia can be present as part of inflammatory disease or inadequate protein intake due to the increase its transcapillary escape rate to interstitial space, in animals with necroinflammatory liver disease the hypoalbuminemia
precedes ascites. Liver, kidney, gastrointestinal disease, acute phase response, malnutrition, blood, and plasma loss indicates significant pathology either in the production of albumin by the liver or its leakage through a damaged surface (Kaneko et al., 1997).
An increase concentration of albumin is normally observed in cases of acute dehydration however hyperalbuminemia was reported in different species due to different causes. In dogs with hepatocellular carcinoma (Cooper et al. 2009) and hipoadrenocorticism (Saito et al., 2002), in cattle with lump skin disease (Abutarbush., 2015), in cats with neuropathy associated with transient diabetes mellitus (wolff, 1984). Other factors can increase albumin synthesis such as insulin, corticosteroids, thyroid hormone and growth hormone (Kahn, 2010).
Congenital analbuminemia is an autosomal recessive disorder characterized by a trace level of albumin in blood plasma and mild clinical symptoms, with few reports in humans (Caridi et al., 2014). There is no case report in veterinary sciences about this disease.
Bisalbuminemia or alloalbuminemia is another inherited abnormality of albumin that is characterized by the occurrence of two distinct peaks, these two peaks of equal or unequal intensity. In veterinary, there is report in bottlenose dolphin (Gili et al., 2016), amphibians (Francis et al., 1985) and iguanas (Musilová et al., 2016).
3.2 Alpha globulins
Alpha (α) globulins are a group of globular proteins in plasma that are highly mobile in electrophoresis (Kaneko et al., 2008). The α fraction is characterized by one or two fractions (α-1 and α-2 globulins) depending on the species (Tothova et al., 2016). α1-antitrypsin, α-1 acid glycoprotein, α-1 antichymotrypsin, α-1 fetoprotein, and α-1 lipoprotein have been detected in the α-1 globulin fraction, while haptoglobin, α-2 microglobulin, α-2 macroglobulin, ceruloplasmin, α-2 antiplasmin and α-2 lipoprotein have been identified in the α-2 globulin fraction (Kaneko et al., 1997). The α-1 antitrypsin is main part of α-1 fraction and α-2 fraction consists mainly of α-2 macroglobulin and haptoglobin (Busher,1990).
Increase of α globulin is common finding in electrophoretogram. During acute or chronic inflammatory diseases, the increase of α-1 and α-2 globulins can be justified by activation of the host inflammatory responses due to acute phase proteins migrate (Tothova et al., 2016).
8
However, in normal conditions was report the influence of colostrum intake on the α-globulin in clinically healthy calves (Nagyová et al., 2016).
In cats, the increase of α-1 globulins was report in feline infectious peritonitis causing hypertension and chronic renal failure (Taylor et al., 2010). Patients with congenital α1-antitrypsin deficiency presents a significant decrease of α1 fraction, thus it was created transgenic sheep for produce human α-1 antitrypsin in the milk aimed commercial exploitation (McClenaghan et al., 1991).
Increase of α-2 globulins was related inflammatory pulmonary disease and feline infectious peritonitis (Taylor et al., 2010). Specific increase of α-2 macroglobulin can be verified in nephrotic syndrome due to decrease of glomerular filtration rate of lower molecule weight protein lost in urine.
Haptoglobin present increase during stress, infection, acute inflammation or tissue necrosis possibly be related to the stimulation of synthesis, in sheep was evidence the increase in clinical stage of scrapie (Meling et al., 2012). Haptoglobulin decrease after combination with free plasma hemoglobin to allow hepatic recycling due to hemolytic reaction (Busher, 1990), in sheep was noted the haptoglobin decrease with the foetus age (Beĭsenbaeva et al., 1979).
3.3 Beta globulins
Beta (β) globulins are a group of globular proteins in plasma that is second in mobility in electrically charged solutions (Kaneko et al., 2008). The main β globulins are transferrin and complement, in some species there are present β-1 and β-2 subfractions (Tothova et al., 2016). β2 can be found in some animals, this subfraction may be result of IgA and IgE immunoglobulins that migrate to β-γ interzone, and IgM immunoglobulins that can migrate in the β region also (Meyer and Harvey 2004).
Increase of β-globulin is associated with inflammatory diseases, infections active hepatitis, chronic liver diseases, liver cirrhosis, nephrotic syndrome, hypercholesterolemia and iron deficiency anaemia. Decrease of β-globulin is associated with malnutrition and hepatic failure (Tothova et al., 2016).
In ewes with different metabolic stages, pregnancy and postpartum showed highest values compared with early, mid-, end lactation and dry period (Piccione et al., 2009b). In dogs, increase of β-1and β-2 was related with otitis externa, chronic stomatitis, myositis and Angiostrongylus vasorum infection. Decrease of β-2 was associated with aplastic anaemia and bacterial meningitis (Tappin et al., 2011).
3.4 Gamma globulins
Gamma (γ) globulins are a group of globular proteins in plasma that is third in mobility in electrically charged solutions, it is behind α- and β-globulins. Gamma globulin is composed by five isotypes of immunoglobulins (Ig): IgG, IgM, IgA, IgD, and IgE (Kaneko et al., 2008).
Immunoglobulin G (IgG) is the main immunoglobulin in concentration, subclasses are recognized in most species (Kaneko et al., 2008) such as in sheep with production of IgG1 and IgG2 (Beh, 1987).
Immunoglobulin M (IgM) is the second greatest concentration and it is the first antibody to be synthetized during immunogenic stimulus and the first antibody apparent during morphogenesis (Kaneko et al., 2008). Association between haptoglobin and IgM and the clinical progression of caseous lymphadenitis in sheep, showed be an effective tool in search of vaccine formulations (Bastos et al., 2013).
Immunoglobulin A (IgA) can be present in two forms, as a monomer or a dimeric secretory form. The main tissues for defense are intestinal tract and the lung and the functions are neutralizing virus and preventing adherence of bacterial pathogens to target tissue (Kaneko et al., 2008). In sheep, mucosal IgA seems have a role in resistance to both larval and adult stages of Haemonchus contortus however more studies are needed to be confirming this correlation between IgA and resistance (Hernández et al., 2016).
Immunoglobulin D (IgD) functional role is poorly understood and is not present in many animals although in humans IgD concentration are greater than IgE (Rogers et al., 2006).
Immunoglobulin E (IgE) has small amounts concentration in serum however it is recognized and characterized in many animals (Kaneko et al., 2008). Humans, non-human
10
primates, rodents, avian species, and all of the domestic animals allergic responses are mediated by IgE. Immunoglobulin E can bind through Fc receptors on tissue mast cells and blood basophils and lead the cell degranulates, releasing vasoactive amines, stimulating leukotriene synthesis, and resulting in potent pharmacological effects (Gershwin, 2015). It is possible that when IgE bind to CD23 stimulates a regulatory function. Immunoglobulin E can help in parasite killing by IgE bind to eosinophils, the link allows the eosinophils to deposit their toxic granule on worm (Kaneko et al., 2008).
4. Use of electrophoresis in veterinary studies
In veterinary science, the most common methods of electrophoresis are cellulose acetate and agarose gel however, a few years ago the use capillary method electrophoresis increased (Crivellente et al., 2008). During comparison of capillary zone electrophoresis and agarose gel electrophoresis both system from Sebia, concluded the same previously advantages (Petersen et al., 2003; Giordano et al., 2010), and with higher sensitivity displays for capillary method however the agarose gel method showed higher specificity (Lissoir et al., 2003). Nevertheless, capillary method requires attention in the interpretation comparably with agarose gel and cellulose acetate due to necessity of specific reference intervals used for interpretation and distinctive visual patterns for albumin, gaps between fractions, and subpeaks found on capillary method tracings are recognized (Giordano et al., 2010). Despite the variation in the capillary method as narrower peaks and more peaks compared to the agarose gel, there is an increased efficiency in the separation of the protein bands in rats, mouse, dogs, marmoset and human (Crivellente et al., 2008). Therefore, the capillary method is viable and reliable alternative for the determination of protein profile in a routine veterinary clinical pathology laboratory (Jenkins et al., 1995; Crivellente et al., 2008). Finally, it is fundamental research for the formation of a reference range and diagnostic sensitivity and specificity for different animal species (Counotte, 2010).
4.1 Electrophoresis studies in dogs
Nowadays there are different methods of electrophoresis available for dogs, and comparing the most common methods such as agarose gel and cellulose acetate with the capillary method, capillary was as effective as usual methods (Giordano and Paltrinieri, 2010) and provide a better resolution (Abate et al., 2000). Capillary method presents other advantages such as complete automation and ease of use as described previously although it requires attention in interpretation due to the distinct visual pattern and need for a specific reference range for the capillary method (Giordano and Paltrinieri, 2010). However, there are possible causes for change in results of the electrophoresis capillary zone, such as the presence of haemolysis, lipaemia, bilirubinaemia and fibrinogen may interfere in the results due to changes in the electropherogram morphology. Haemolysis that may increase the β-2 band due to increased haemoglobin, α-2 lipids and increased α-2 with increased lipids and bilirubinaemia, although it does not interfere in the electrophoresis morphology but there is increase in albumin and α-1 and a decrease in fractions α-2 and β-2 (Martínez-Subiela et al., 2002).
The variability intra-species is wide challenge for formation of reference range. Galgos compared with other breeds showed higher albumin, β-globulins and albumin to globulin ratio and lower total globulins, α2-globulins and γ-globulins (Mesa-Sánchez et al., 2016). Other study with retired race greyhounds presented a statistical significant difference for non-greyhound from total protein concentrations, total globulins and α -1, α-2, β-1 and β-2 globulins were significantly lower and the albumin to globulin (A: G) ratio was significantly higher (Fayos et al., 2005) both studies confirm the variability intra-species. Other different factors such as environmental and dietary conditions have been reported as possible obstacles for the formation of a reference interval for dogs and cats (Keay, 1982).
Another study that was based on the formation of a reference interval from an agarose gel electrophoresis in healthy dogs to perform the comparison with dogs with different pathologies. The ultra-resolution electrophoresis and immunofixation electrophoresis were used to separate and to characterize individual proteins, and showed useful to present quantitative variations such as increase and decrease in coloration and qualitative variations such as appearance of one or more bands, usually absent in physiological state (Abate et al., 2000).
12
The combination of different electrophoresis methods may be a useful tool, such as combination of one-dimensional agarose gel electrophoresis with two-dimensional polyacrylamide gel aimed to characterize the serum proteome in dogs. The two-dimensional electrophoresis is a promising technique for the detection of different pathologies in dogs and other species, and may be used to aid in the interpretation of agarose gel electrophoresis (Atherton et al., 2013). Nevertheless, the agarose gel electrophoresis showed useful method. Analyzing 147 case reports of different diseases in dogs 140 presented electrophoretic pattern with alterations, with greater interference in albumin, decreased in 59.3% of the cases and main cause of classified alteration was infection/inflammation disease in 79 cases (Tappin et al., 2011).
4.2 Electrophoresis studies in cats
Electrophoresis is poorly studied in cats and has few information that can be used in the clinical routine (Gerou-Ferriani et al., 2011), more than 3 decades of electrophoresis studies in cats are performed with the intention of forming a reference range for species, which may be used as tool for diagnosis and monitoring. (Baker and Valli, 1982).
There are studies that have used electrophoresis as an assist to diseases diagnostic in cats, the study aimed to form a reference range to compare the protein electrophoretograms in healthy cats and cats with lymphoma. The pathology showed a significant decrease in mean albumin concentration and a significant increase in mean β-globulin concentrations during the use of agarose gel electrophoresis (Gerou-Ferriani et al., 2011). However, another study (Alves et al., 2012) used cellulose acetate electrophoresis compared healthy cats and with lymphoma, results detected not significant difference in protein bands between healthy group and unhealthy.
Another study used agarose gel electrophoresis for created a reference range with 177 cats divided in clinically normal and abnormal, 77 cats were healthy but 136 electrophoresis showed abnormal results. Cases were analyzed and classified by aetiology, presented main cause of alteration infection/inflammation disease in 80 cases (Taylor et al., 2010).
Similarly to dogs, the different methods of electrophoresis such agarose gel, cellulose acetate and capillary can be performed for cats, and with same advantages and precautions for
reliable results should be preserved as reported previously for dogs (Giordano and Paltrinieri, 2010).
Cats with FIV after IGY therapy presented albumin and globulins returning to the physiological values for species, although it is a preliminary study the method seems to be relevant for monitoring diseases and treatments (Supeanu et al., 2016).
Other study used one-dimensional sodium-dodecyl-sulfate polyacrylamide gel electrophoresis and two-dimensional to map the urine proteome of heathy cats and compare it with the proteome of cats with chronic kidney disease. Thus, it suggesting some possible sensitive and specific biomarkers for early prediction and monitoring of chronic kidney disease in cats (Ferlizza et al., 2015).
Many articles described previously used electrophoresis as method for diagnosis or monitoring of disease, and the reference range is a fundamental part of studies (Ferlizza et al., 2015; Gerou-Ferriani et al., 2011; Taylor et al., 2010). However, (Keay, 1982) related the influence of external factors and internal under the values of protein electrophoresis such as environmental, dietary conditions and different breeds. Previously reported (Kristensen and Barsanit, 1977) cats which lived in controlled environment have significantly increased levels of γ-globulins as compared with the values in cats kept as house pet, it confirms that environmental can influence reference range.
4.3 Electrophoresis studies in horses
The first report in horses about reference range using agarose gel electrophoresis, it established the concentrations of albumin and alpha-, β-, and γ-globulins. The 126 animals both sexes and ranging from 2 to 20 years of age, including 105 thorough breeds and 21 heavy draught horses (Riond et al., 2009). Equus caballus genome is incompletely characterized this way, the study (Miller et al., 2004) aimed constructed a reference two-dimensional protein map for horse, resulting in identify almost all moderate to high abundance proteins stained in the serum two-dimensional electrophoresis pattern. This way, both studies (Miller et al., 2004; Riond et al., 2009) aimed be a useful tool for the study of monitoring and disease diagnosis.
14
In horses, as described previously for other specie there are influences of different factors which may alter values of electrophoresis. In a study with Pega donkey (Equus asinus) was possible determined the age and sex interference under the levels of proteins in the serum profile using sodium dodecyl sulphate-polyacrylamide gel electrophoresis (Girardi et al., 2017). Horse breed is possibly another influence factor as in other specie (Keay, 1982). The evaluation of serum protein fractions in the miniature Caspian horse presented albumin, α1, α2, β, and γ globulin, using cellulose acetate electrophoresis and fractions values were not similar with protein fractions of other breeds (Zamani Ahmadmahmudi et al., 2012). Exercise is another possible factor of values variation electrophoresis; preliminary investigation assessed electrophoresis plasma protein fraction profile after competitive racing activity in thoroughbred horses, resulting in simultaneous increases concentrations of total plasma protein, serum albumin, α-1 globulin, α-2 globulin, β-1globulin, β-2 globulin, γ-1 and γ-2 globulins (Coyne et al., 1990). It was reported another study using automated multiparametric agarose gel electrophoresis system for assess serum electrolyte and protein modification during different workloads in jumper horse. The results showed significant difference in albumin, α-1 globulin, total protein e others serum electrolyte (Piccione et al., 2007). In another study with Standardbred Horses were assessed by means of automated multiparametric agarose gel electrophoresis system during 1600 and 2000 meters trot races. The results indicated the exercise and different workload may be the cause of globulins even without set pattern to compare (Piccione et al., 2009).
Assessed the influence of physical exercise in horses revaccinated against equine herpes virus 4/1 and equine influenza virus, the protein profile was determined by agarose gel electrophoresis. Results show that there is influence of physical exercise in vaccinated horses, however there is no suppression of the protective function of γ-globulins (Gundasheva, 2015).
Another use of one dimensional gel electrophoresis showed be efficient as diagnosis method after ingestion of the poisonous weed ragwort (Senecio jacobea), it presenting a significant alteration in the equine plasma protein profile (Moore et al., 2008).
4.4 Electrophoresis studies in goats
In goats serum proteins were identified 5 fractions by zone electrophoresis on buffered agarose gel: albumin, α1-, α2-, β- and γ-globulins (Nagy et al., 2015). However, different factors reported may be significant for protein fractions values such as; age (Alberghina et al., 2010), feed (Kudělková et al., 2016), serum storage method (Nagyová et al., 2016), physiological changes such as puerperium (Saut et al., 2009) and periparturient stage (Janků et al., 2011).
During one study with healthy Girgentana goats, which aim was to establish electrophoretic reference intervals using agarose gel electrophoresis with attention to different ages, authors assessed total protein and the electrophoretic pattern. Results showed significant differences between the 2-4-years-old group and 5-12-years-old group in total protein, albumin, α-globulin concentrations and A/G ratios (Alberghina et al., 2010).
The feed variations showed be significant during assess of protein fractions using electrophoresis gel. The study compared blood serum of 32 periparturient goats supplemented without or with various forms of zinc, the results showed influence of different forms of zinc under the total protein, albumins and γ-globulin values (Kudělková et al., 2016).
During analysis of the effect of different storage time and temperature conditions on the serum sample in goats results showed a significant variation of stored samples compared with sample analyzed immediately after separation, and it recommended use fresh serum samples or samples refrigerated for 24 h for electrophoretic analysis (Nagyová et al., 2016). During puerperium analysis, showed non-significant statistical differences for fractions protein, only acid glycoprotein increased during puerperium, determined under sodium dodecyl sulphate-polyacrylamide gel electrophoresis in Saanen goats (Saut et al., 2009). On the other hand, periparturient goats presented significant changes on values of individual fractions at different times in the periparturient period. These values fluctuation is useful for diagnosis, monitorization diseases, experimental studies and reveal physiological changes that should be considered during interpreting the results (Janků et al., 2011).
Other studies using different stages of sheep’s life showed be relevant for specie improvement such as changes in the protein composition of mammary secretion during the
16
involution of mammary gland (Raimondo et al., 2013) and use of alternative source of passive immunity (Lima et al., 2013).
The aim study was to associate mammary gland involution in goats with variation protein fractions, with attention immune system as albumin, lactoferrin and immunoglobulins determined by polyacrylamide gel electrophoresis on a 12% gel. Presented an increased content of innate (albumin, lactoferrin) and acquired (immunoglobulins) immune system and with evidences for increased degradation of casein. This variation of protein fractions may be correlated with necessity to clear existing bacterial infection or to prevent infections during the dry period (Raimondo et al., 2013).
Another study aimed to determine the use of bovine colostrum as lyophilized bovine colostrum or in natura concluded that lyophilized colostrum could be an effective alternative source of passive immunity for goat kids, due to the variation pattern of protein fractions (Lima et al., 2013).
4.5 Electrophoresis studies in sheep
The scientific literature has a wide range of studies with different methods of electrophoresis in sheep (Chiaradia et al., 2012; Lamy et al., 2008; Piccione et al., 2009b), however, there was identified 6 fractions by zone electrophoresis on buffered agarose gel: albumin, α1-, α2-, β-, γ1- and γ2-globulins (Nagy et al., 2015) but, there was no study to elucidate the variation of the electrophoretic profile by capillary method at different ages and physiological states in same study.
The development of a reference map of two-dimensional electrophoresis gel of serum proteins in sheep, 2 to 3 years old nulliparous ewes were used, may be useful for the proteomic applications such as during monitoring the physiological and metabolic state until the early diagnosis of diseases (Chiaradia et al., 2012). Nevertheless, there are no studies evaluating the influence of age on the sheep, it was determined a variation of the protein bands in calves with different ages, the study confirmed a significant effect of days of life on profile of serum proteins (Piccione et al., 2009a).
Evaluation of the protein profile using cellulose acetate electrophoresis in sheep during the different physiological states showed a useful tool for the production system that aims at lower financial losses through the knowledge of the nutritional requirement in the different physiological stages (Piccione et al., 2012). These nutritional demands at different stages in sheep are known although it is necessary to be taken into consideration the different physiological states and seasonality to avoid errors during the interpretation of values of serum analysis (Yokus et al., 2006).
Protein electrophoresis in sheep is normally researched with serum blood, therefore the protein profile can be performed from parotid saliva, with aim of the study on the physiological function of saliva in different types of feeding under the use of sodium dodecyl sulfate-polyacrylamide gel electrophoresis (Lamy et al., 2008). Another study used milk protein to evaluate milk composition of five races or crossbred ewes with capillary electrophoresis, presenting the influence of breeds on milk composition and milk yield (Clément et al., 2006).
Electrophoresis can be a useful tool in the diagnosis of pathologies in sheep, using cellulose acetate electrophoresis it was possible to determine a significant variation between healthy sheep and naturally infected with Babesia ovis. The study concludes that total protein increase associated with decreased globulin fractions is a common finding in this pathology. (Esmaeilnejad et al., 2014). However, previously (Apaydin et al., 2010) used the same electrophoretic method in the same pathology presenting different results. Total protein and α-1 and 2 dramatically decreased in infected with Babesia ovis, 5 days after starting treatment, values increased with exception of α-2.
Evaluating the variation of the electrophoretic profile in chronic pneumonia caused by mycoplasma and bacteria, had lower albumins, higher α-1 and γ-globulins, and A / G ratio below 1.0. The authors state that the results are not specific disease but are a useful tool for early diagnostic and monitoring responses to therapy (Woolf et al., 1973).
During the use of pulsed field gel electrophoresis for analysis of Mycobacterium avium subsp. paratuberculosis in sheep showed a useful tool and combined with PCR based short sequence repeat provide meaningful epidemiological information (Sevilla et al., 2008).
18
5. The use of sheep as a large animal model for pre-clinical and translational studies Sheep have been used as an animal model in human and veterinary research mainly due to the widespread acceptance of their use as a large animal experimental model for pre-clinical and translational studies, and their low cost, easy housing and handling, and availability (Potes et al., 2008, Turner, 2007). The Churra-da-Terra-Quente is a typical sheep breed from the northeast of Portugal. This autochthonous breed is well adapted to wide seasonal variation and it provides high quality milk for Terrincho cheese and also lamb meat (Dias et al., 2010). The ovine species has a great diversity of breeds that are consequently allocated in varying climates and with different nutritional support. It is therefore difficult to establish blood reference values, such as total protein and electrophoretic serum protein fraction profile, for this species (Metson and Saunders, 1978).
Protein electrophoresis is a standard method for fractionation and quantification of serum proteins, and it has become a routine analysis in human clinical diagnosis. It has not been commonly used, however, in veterinary routine profiles. Serum protein electrophoresis can be an important and useful tool in flock veterinary medicine due to the correlations that can be made between protein profile changes and several pathologies. The protein fractions are basically grouped into five fractions; albumin and globulins (α-1, α-2, β-, and γ-globulins). Protein fractions are responsible for several crucial functions. Albumin, for instance, is osmotically active, and is essential for maintaining intravascular colloidal pressure, as well as for nutrition of the body (since it contains essential amino acids), and is also a carrier for many substances (e.g. fatty-acids, calcium ions, drugs). Alpha, and γ-globulins are responsible for immune responses (e.g. immunoglobulins or antibodies), for inflammatory response, for the transport of molecules (e.g. cholesterol, iron, vitamins, hormones); and fibrinogen is involved in hemostatic and fibrinolytic processes in plasma protein electrophoresis (Tothova et al., 2016).
Concerning the standardization of serum protein profiles, several factors may influence the creation of a reference range. Considering the possible intra-species variability, whether due to gender, age, physiological state, or breed, the interval could be wider than that seen in the literature (Piccione et al., 2009a,b; Chiaridia et al., 2012). Therefore, a detailed knowledge of this
interval could help farmers minimize financial losses by knowing the nutritional requirements of the animals and also provide researchers with more reliable numbers (Chiaridia et al., 2012).
Age (Fayos et al., 2005) and physiological state (Piccione et al., 2009b) are important factors when analyzing an animal’s protein profile since these variables may affect the concentration of serum protein fractions. The reported variation in ruminants, such as buffaloes (França et al., 2011) and calves (Piccione et al., 2009a), show that protein patterns can be influenced by age, as well as pregnancy and lactation, where metabolic functions vary considerably due to demands of the fetus or milk synthesis, which could affect blood serum chemistry values (Piccione et al., 2009b; Yokus et al., 2006).
Capillary electrophoresis is an advanced method compared to other conventional electrophoretic methods such as cellulose acetate or agarose gel, due to multiple factors, including ease, high speed, and high resolution separations, fully automated process and detection methods (based on analytic nature) that facilitates obtaining an analysis in a short period of time (Dipa et al., 2016). In this technique, lateral diffusion is minimized (as glass capillaries used usually have internal diameters of 200–500 μm), and there are temperature differences between the center of the capillary and the walls (Whatley, 2001).
Only a few studies have described reference values for the ovine species, and some of these studies did not consider age and physiological state as factors leading to variation.
6. Churra-da-Terra-Quente sheep
The origin of Churra-da-Terra-Quente breed (CTQ) is the crossed between Badana and Mondegueira breeds (Escudeiro, 1996) that occurred in the 19th century. CTQ is autochthone of Trás-os-Montes region in northeast of Portugal, there are more than 18000 animals (SPREGA, 2016), it presents good reproductive capacity and milk with reproductive cycles throughout the year with the spring as the main season of reproduction.
The CTQ is characterized by rusticity, with the presence of twin births. Puberty is reached at 10 months of age and the first parturition at 15 months of age. Although, it is animals with
20
triple aptitudes, currently have been used for milk, cheese and meat production. Both products present the DOP - Denomination of Protected Origin (CEE regulation nº1107/96) (Monteiro et al., 2005).
CTQ have been support by the National Association of Sheep Breeders of Churra-da-Terra-Quente (ANCOTEQ) through a set of actions helping breeders to improve and preserve the breed.
SectionII – Original Article 1. Aims
The main purpose of the present study was to characterize the physiological serum protein electrophoretic pattern for Churra-da-Terra-Quente sheep, and to describe the variation among different ages and physiological states such as lactation, gestation, and dry periods.
2. Material and Methods 2.1 Animals
Eighty heathy ewes (Churra-da-Terra-Quente sheep) from the same flock, located in Carrazeda de Ansiães, a municipality in the district of Bragança, in northern Portugal, were used. These animals were chosen from the flock based on their age or physiologic state and divided into 8 groups of 10 animals each. The groups were as follows: 6 months old, 1 year old, 2 years old, 3 to 5 years old (no pregnant or lactating ewes), 3 to 5 years old ewes with 2 or 3 months of pregnancy, 3 to 5 years old ewes with 2 or 3 months of lactation, 6 to 8 years old, and the last group with animals over the age of 8 years. The ewes were kept in a natural pasture during the day and housed overnight. The diet was composed of grass hay, supplemented with 0.250 kg of concentrate feed per animal per day, and water provided ad libitum. Dry matter and chemical composition of grass hay is made up of dry matter per kg feed (88.5 g), ash per kg dry matter (5.9 g), neutral detergent fiber per kg (73.3 g) dry matter and crude protein per kg dry matter (6.1 g). Dry matter and chemical composition of feed concentrate is made up of dry matter per kg feed (90.4 g), ash per kg dry matter (8.5 g), neutral detergent fiber per kg dry matter (31.6 g) and crude protein per kg dry matter (20.7 g).
All animal handling practices followed Directive 2010/63/EU of the European Parliament and of the Council on the protection of animals used for scientific purposes.
22 2.2 Blood sampling
Blood was drawn in December, during the Northern hemisphere Winter. Blood samples were drawn from the jugular vein and placed into serological tubes (S-Monovette®, SARSTEDT, Nümbrecht, Germany). Blood collection took place between 9:00 a.m. and 10:00 a.m., and the blood was immediately carried in a thermal box to the laboratory facilities. Blood was centrifuged (3000 g for 10 min) and the serum was stored in Eppendorf tubes at 20 °C until analysis.
2.3 Determination of total protein
The biuret method was used for quantitative determination of total protein concentration in serum using an automated analyzer (Mindray BS-380; Shenzhen Mindray Bio-Medical Electronics, Nanshan, China).
2.4 Separation of serum proteins by capillary electrophoresis
Electrophoresis was performed using an automated system (Capillarys 2; SEBIA, Paris, France) according to the procedures described by the manufacturer. The electrophoresis system uses the principle of capillarity in free solution to allow multiple simultaneous analyses. Electrophoretic mobility occurs due to charged molecules that are separated with the aid of an alkaline buffer. The pH of the electrolytes and the electro-osmotic flow are responsible for this separation.
2.5 Statistical analysis
Serum protein fractions and total protein values are presented as mean ± standard deviation (SD) and median ± interquartile range (IQR). Statistical normality was checked using the Shapiro-Wilk test for all groups. ANOVA and the post-hoc Tukey test were used for data with normal distribution. The Kruskal-Wallis test was used for testing the non-parametric
statistical hypothesis and the Kruskal-Wallis pairwise method for multiple comparisons. Statistical analyses were performed using SPSS software (version 23.0, SPSS, Inc., IBM Company, NY, USA). The level of significance was set at p≤0.05.
3. Results
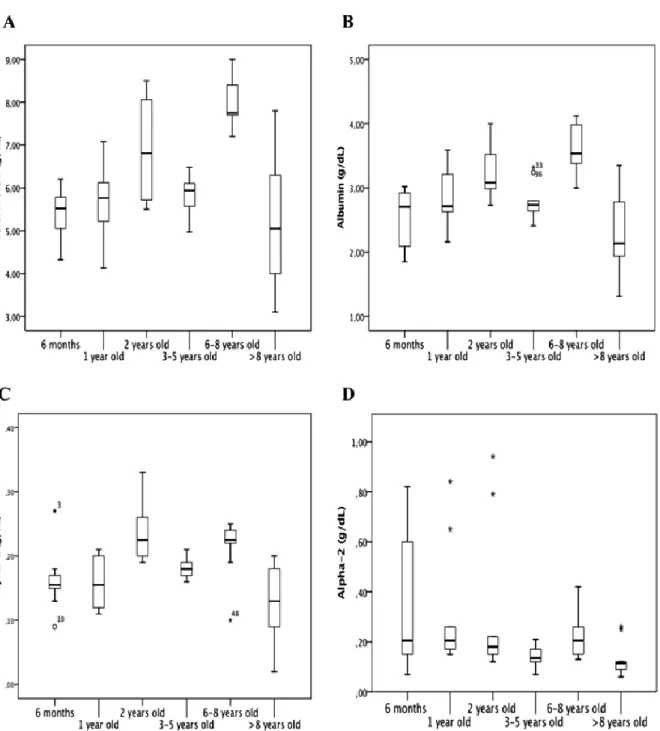
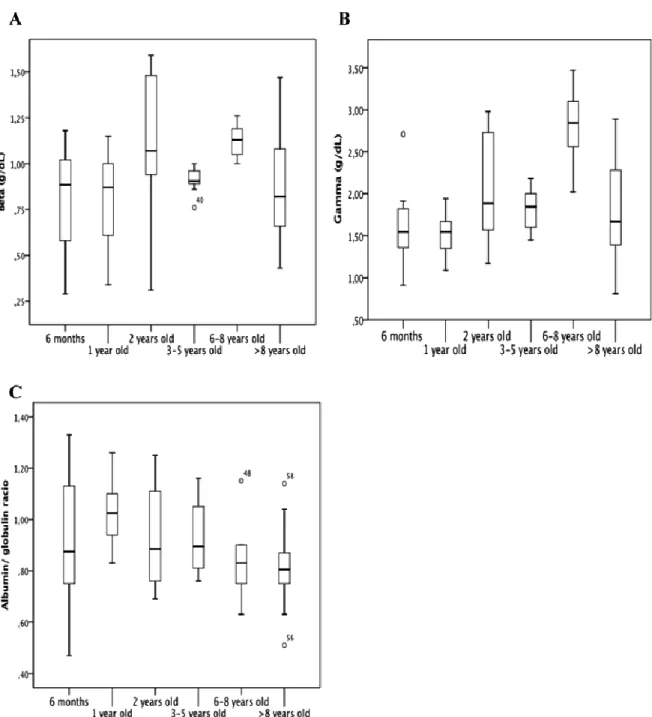
Table 1 shows mean values ± SD and median values ± IQR for studied parameters across different ages. ANOVA and the post-hoc Tukey test showed a significant difference (p<0.001) between age groups “6-8 years” and all others, except “3-5 years”, for total protein values (Fig. 5A, Table 1), with the “6-8 years” group having the highest values, and a significant difference (p<0.01) between the “6-8 years” group and the other age groups for gamma globulin (Fig. 5F). Regarding albumin (Fig. 5B), we observed a similar significance as that observed for total protein, with the highest values seen in the “6-8 years” group (Table 1), but there was no significant difference (p>0.05) between the different age groups for albumin/globulin ratio (Figure 5G). The Kruskal-Wallis test and pairwise method did not show a significant difference (p>0.05) between the groups with different ages for beta globulin (Fig. 5E). Alpha-1 (Fig. 5C) and alpha-2 globulins (Fig. 5D) presented a significant difference along the lifespan (p<0.01 and p<0.05, respectively).
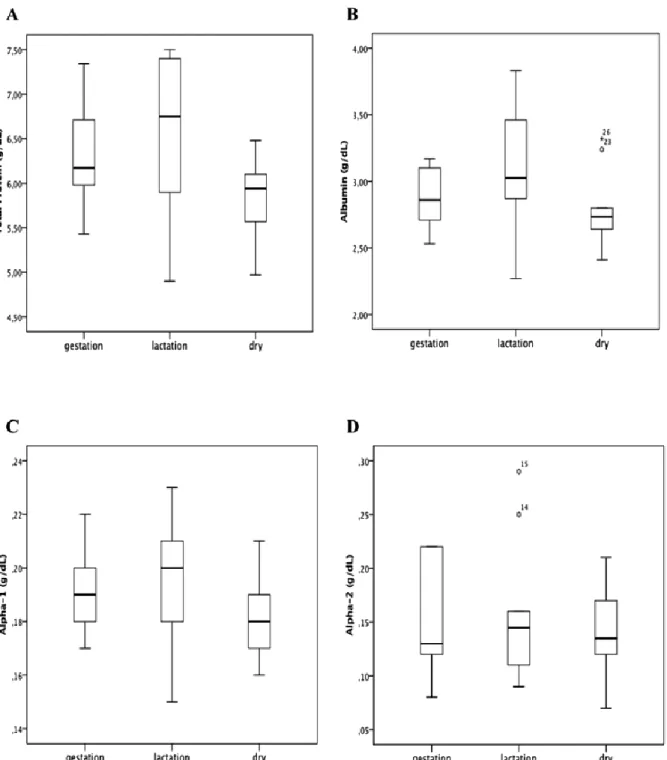
Regarding the analyses for the groups with animals between 3 and 5 years of age in different physiological phases, Table 2 shows mean values ± SD and median ± IQR for the parameters in this study. ANOVA and post-hoc Tukey test showed a significant difference (p<0.05) between the different physiological states for total protein (Fig. 6A). Albumin (Figure 6B), alpha-1 (Fig. 6C), alpha-2 globulins (Fig. 6D), and albumin/globulin ratio (Fig. 6G) did not present a significant difference (p>0.05). Kruskal-Wallis test and pairwise method showed a significant difference (p<0.05) between the different physiological states for beta globulins (Fig. 6E), but there was no significant difference for gamma globulins (Fig. 6F).
Table 1. Values for the studied parameters across the lifespan in sheep.
Parameters (g/dL) 6 months 1 year 2 years 3-5 years 6-8 years >8 years Total Protein 5.42±0.56c 5.64±0.85 6.85±1.14 5.84±0.43 7.99±0.55a 5.20±1.53c
24
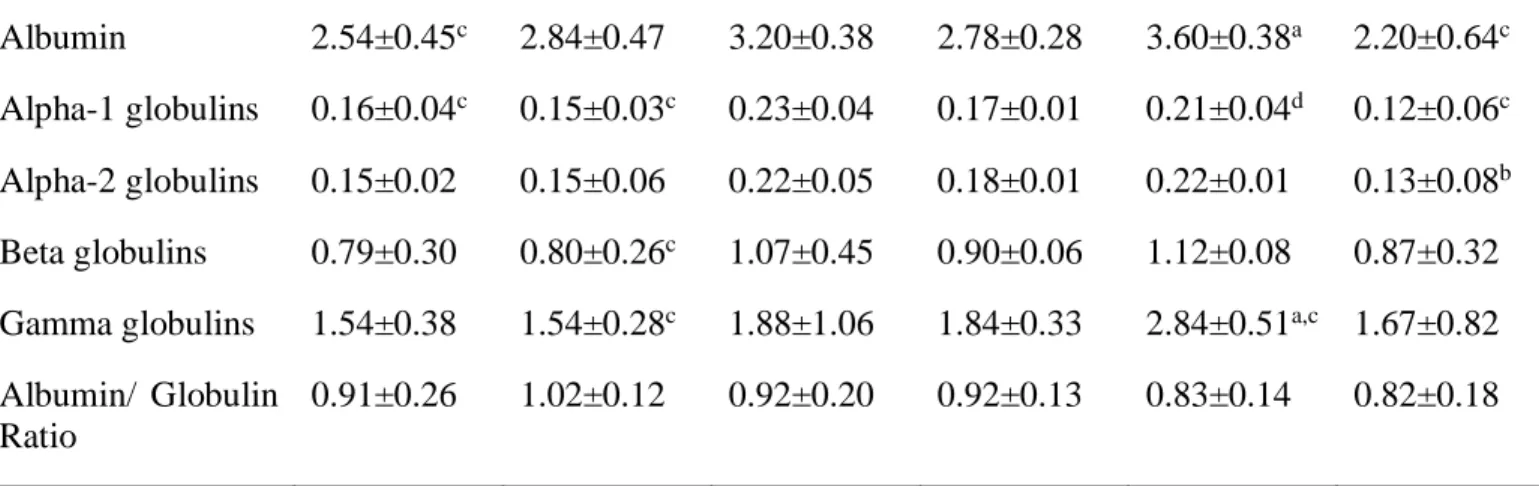
Albumin 2.54±0.45c 2.84±0.47 3.20±0.38 2.78±0.28 3.60±0.38a 2.20±0.64c
Alpha-1 globulins 0.16±0.04c 0.15±0.03c 0.23±0.04 0.17±0.01 0.21±0.04d 0.12±0.06c
Alpha-2 globulins 0.15±0.02 0.15±0.06 0.22±0.05 0.18±0.01 0.22±0.01 0.13±0.08b
Beta globulins 0.79±0.30 0.80±0.26c 1.07±0.45 0.90±0.06 1.12±0.08 0.87±0.32
Gamma globulins 1.54±0.38 1.54±0.28c 1.88±1.06 1.84±0.33 2.84±0.51a,c 1.67±0.82
Albumin/ Globulin Ratio
0.91±0.26 1.02±0.12 0.92±0.20 0.92±0.13 0.83±0.14 0.82±0.18 a Vs 6 months, 1 year, 3-5 years and >8 years.
b Vs 1 year. c Vs 2 years. d Vs >8 years.
Total Protein, albumin, alpha-1, beta and albumin/globulin Ratio have Mean ± SD; alpha-2 and Gamma globulins have Median ± IQR displayed.
Letters represent significant difference between groups for a same parameter (p<0.05).
Table 2.Values for the studied parameters per physiological stage in sheep.
Parameters (g/dL) Gestation Lactation Dry
Total Protein 6.32±0.59 6.62±0.86a 5.84±0.43 Albumin 2.86±0.23 3.09±0.47 2.78±0.28 Alpha-1 globulins 0.19±0.01 0.19±0.02 0.17±0.01 Alpha-2 globulins 0.15±0.05 0.15±0.06 0.14±0.04 Beta globulins 0.94±0.09 1.14±0.23a 0.90±0.06 Gamma globulins 2.14±0.74 2.04±0.39 1.84±0.33
Albumin/ Globulin Ratio 0.84±0.12 0.88±0.10 0.92±0.12 aVs dry.
Total Protein, Albumin, Alpha-1 and 2, Albumin/ Globulin Ratio have Mean ± SD; beta globulins, Gamma globulins have Median ± IQR.
Figure 5. Box plot presentations of serum concentrations of total protein and protein fractions by age. (A) Total Protein presented significant difference between 2 years vs. 6 months (p<0.05) and >8 years (p>0.01), between 6-8 years vs. 6 months (p>0.001), 1 year (p>0.001), 3-5 years (p>0.001), and >8 years (p>0.001). (B) Albumin presented significant difference between 2 years vs. 6 months (p>0.05) and >8 years (p>0.001), between 6-8 years vs. 6 months (p>0.001), 1 year (p>0.01), 3-5 years (p>0.01), and >8 years (p>0.001). (C) Alpha-1 globulins presented significant difference between 2 years vs. 6 months (p>0.01), 1 year (p>0.01), and >8 years (p>0.001), and between 6-8 years and >8 years (p>0.001). (D) Alpha-2 globulins presented significant difference between 1 year and >8 years (p<0.05). Outliers are identified with small circle for out values and star for extreme values.
26
Figure 6. Box plot presentations of serum concentrations of total protein and protein fractions by age. (A) Beta globulins, there was no significant differences between groups. (B) Gamma globulins presented significant difference between 1 year and 2 years (p>0.05), and between 6-8 years vs. 6 months (p>0.001), 1year (p>0.001), 2 years (p>0.05), 3-5 years (p>0,01), and >8 years (p>0,01). (C) Albumin/Globulin Ratio, there was no significant differences between groups. Outliers are identified with small circle for out values and star for extreme values.
Figure 7. Box plot presentations of serum concentrations of total protein and protein fractions by physiologic stages. (A) Total Protein presented significant difference between lactation and dry groups (p<0.05). (B) Albumin, there was no significant differences between groups. (C) Alpha-1 globulins, there was no significant differences between groups. (D) Alpha-2 globulins, there was no significant differences between groups. Outliers are identified with small circle for out values and star for extreme values
28
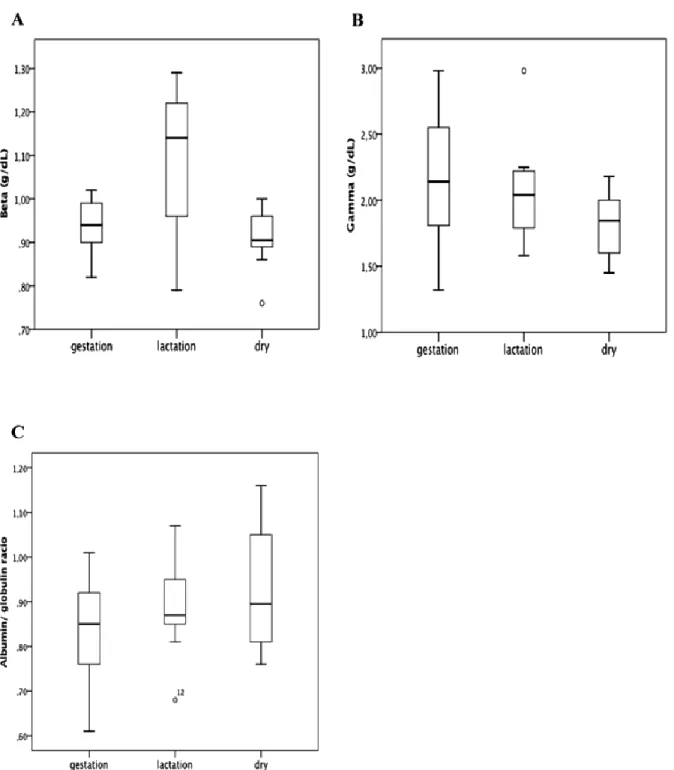
Figure 8. Box plot presentations of serum concentrations of total protein and protein fractions by physiologic stages. (A) Beta globulins presented significant difference between lactation and dry groups (p>0.01). (B) Gamma globulins, there was no significant differences between groups. (C) Albumin/Globulins Ratio, there was no significant differences between groups. Outliers are identified with small circle for out values and star for extreme values.
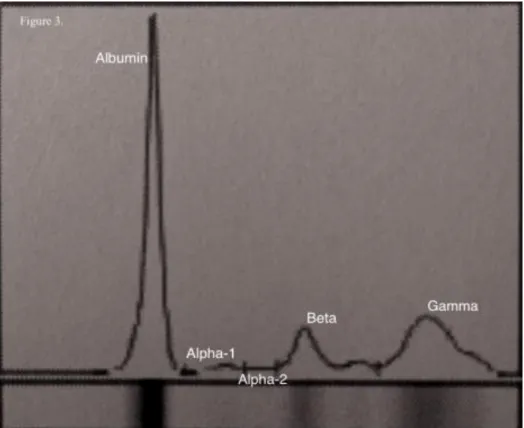
Figure 9. Representative serum protein electrophoretogram in ewe between 3 and 5 years old. 4. Discussion
The aim of our study was to determine the reference range for serum total protein and the corresponding protein fractions through electrophoresis analysis over the lifespan and different physiological stages in sheep. There are few scientific reports analyzing these protein fractions in sheep and there are no reports concerning the influence of age and physiological phases on protein fraction variations in sheep using the capillary electrophoresis method.
Evaluation of serum proteins and their electrophoretic pattern (Fig. 7) may be an important tool in diagnosing many diseases and metabolic states in veterinary medicine since this is an established method for clinical diagnosis in humans. The importance of a larger reference range, which considers not only the species, but other important factors, such as age and physiological state, enables a reduction of false positives in the diagnosis of pathologies.
Characterization of the electrophoretic pattern for sheep presents some obstacles, such as a wide variety of breeds, varying ages, physiological states, electrophoresis methods, and possibly also gender differences, which were not the focus of this study. These obstacles indicate
30
that further similar studies are needed for establishing a more reliable range for serum protein values for the species. In this study, the variation in protein bands between different ages and physiological states represents the difficulty in obtaining a range of values for ovines. Nagy et al. (2015) determined the serum protein electrophoretic pattern for Merino sheep at the age of 2-4 years old, however, the data presented by those authors do not correspond to the results obtained in the present study. This might be due to multiple factors, such as type of electrophoresis method used (Giordano et a., 2010), the different breed, and management conditions, such as feeding.
In the present study, serum total protein was found to be within the reference range (60 – 79 g/L) published by Kaneko et al. (2008), except for the 6 months old age group, which presented a slightly lower value.
The reference range for albumin presented by Kaneko et al. (2008) was 24 – 30 g/L, and in the present study, only the “6-8 years” old age group presented values outside that range. However, the range of values published by Nagy et al. (2015) for serum total protein, albumin, and beta and gamma globulin in Merino sheep (ages between 2-4 years old), were similar to those we encountered. Nevertheless, Nagy et al. (2015) reported higher values for alpha 1 and alpha 2 globulins in comparison with our study.
Regarding the analysis of the serum protein bands and total protein with respect to the different age groups, only beta and albumin/globulin ratio did not show statistical difference, with clear interference of age in the reference values for sheep, mainly evidenced by the highest values found in the “6-8 years” old age group.
In relation to the oscillation of values between different ages, with increasing values along the sheep lifespan until the “6-8 years” old age group and a decrease in the 8 years old age group for serum total protein, albumin, and beta and gamma globulins. This fact may be directly related to a continuous increase of serum protein parameters with age. Ahmadi-Hamedani et al. (2014) have also described this finding in other species, that is, higher values for adults in comparison with young individuals. However, the “3-5 years” old age group showed lower values than the 2 years old age group, with no explanation for this reduction.
During gestation and lactation, the mother organism undergoes physiologic changes (Yokus et al., 2006; Piccione et al., 2009b), the role of serum proteins during these phases is directly linked to productive performance and consequently to economic profit or loss. Analyzing the different protein bands in the different physiological stage groups, only the total serum proteins and beta globulins presented significantly different values (p<0.05 and p<0.01, respectively) between dry and lactation groups. The high serum protein value in the lactation group is probably due to the need for a large protein supply for milk production. Beta globulins presented the same variation as the total protein, with values increasing from dry to pregnant states, and also increasing from pregnant to lactating ewes, and decreasing from the lactating to the dry ewes. However, the results reported by Piccione et al. (2009b) in Comisana ewes, with 3±0.6 years old, reported slightly higher values for total protein during pregnancy, but similar for dry and lactation. We were unable to compare our findings to Piccione et al. ( 2009b)’s for beta-1 and beta-2 globulins since we did not obtain these electrophoretic bands, possibly due to variation in electrophoresis technique.
Analysis of different physiological states showed beta globulins and serum total protein with significant difference between dry and lactation states, nevertheless, a detailed month-by-month analysis would likely result in more accurate values. Nevertheless, our study confirmed the influence of the different physiological phases on protein metabolism in ewes.
The values collected from the different physiological stage groups remain within the range of values of the different age groups along lifespan. Therefore, during the formation of a general reference interval for the sheep, the different physiological stages should not influence this range.
Nevertheless, the presented data on the different physiological stages become an important financial tool to curb the excess or lack of protein in the feeding of sheep during different phases of their lives, leading to an increase in profit.
During the comparison of conventional electrophoresis methods for serum protein band assessment, agarose gel has been considered more accurate than cellulose acetate due to the relatively neutral characteristic of agarose, the minimal electroosmotic flow, the porosity, and the optical clarity (Rosenfeld, 1974). However, the capillary electrophoresis method compared with
32
agarose gel presents advantages such as higher sensitivity, full automation, ease of use, and rapidity; on the other hand, it has lower specificity (Lissoir et al., 2003). Advantages seen with the capillary method may increase its use, thus requiring new reference profiles to take into account the variation that could occur in the results obtained using agarose gel or cellulose acetate for capillary electrophoresis (Giordano et al., 2010).
Another important factor that was not evaluated in this study is the influence of diet. Although concentrate has a fixed nutritional value for protein, the use of grass hay needs a deeper analysis because it does not present a fixed value during the entire year, with higher values near the winter (Demanet et al., 2015). Therefore, future studies could investigate the influence of feeding compared to other factors, such as age and different physiological stages.
5. Conclusion
The results presented herein provide a variety of values detailing the serum protein profile of sheep of the Churra-da-Terra-Quente breed across its lifespan and different physiologic stages. This information may be a useful tool not just in animal and veterinary studies, but also in pre-clinical and translational research studies. Further studies are necessary to establish if there are significant variations between sheep breeds and thereby form a more reliable reference range for serum protein values and pattern in the ovine species.