Proceedings of 8th Transport Research Arena TRA 2020, April 27-30, 2020, Helsinki, Finland
Decision support for reliability improvement of multimodal public
transport services
Vítor Santos
a*, Tânia Fontes
a1
, Joel Ribeiro
a
, Jorge Pinho de Sousa
a,b, Jorge Freire de
Sousa
a,ba INESC TEC, Rua Dr. Roberto Frias, 4200-465 Porto, Portugal
bFaculty of Engineering, University of Porto, Rua Dr. Roberto Frias, 4200-465 Porto, Portugal
Abstract
A set of processes, including the collection of heterogeneous data and in-depth knowledge on multiple dimensions, are required to enhance multimodal public transport services and address traveller needs in an effective and efficient way. The main purpose of this paper is to use reliability data to drive the planning and operationalisation of a multimodal metropolitan-wide network of public transport, covering the needs of authorities, transport providers and travellers. This will be achieved by a methodology using data from current public transport lines and design process to find the best combination of hubs, stops and connections, fully controlled by the transport authority and with the assistance of transport providers. The expect result is a more “predictable” network that maximises schedule reliability, while providing better information for travellers.
Keywords: reliability; urban public transport; multimodal networks; decision support systems.
* Corresponding author. Tel.: +351-222-094-398;
1
1. Introduction
Planning and operationalising a public transport system requires a set of complex processes that include the collection of data from heterogeneous sources (Wang et al., 2018) and a deep knowledge of the system’s multiple dimensions. In practice, data and knowledge must be combined to support the design of public transport services that cover the entire transport network, with a high level of quality (Chowdhury et al., 2018).
There are multiple public transport quality indicators such as accessibility, comfort, security and reliability (EN 13816, 2002). According to Redman et al. (2013), reliability is one of the most studied aspects of public transport. In general, reliability reflects how well a service can produce or deliver outputs, according to a plan (Chang & Stopher, 1981; Prashker, 1979). Diab et al. (2015) define reliability as the availability and stability of public transport attributes that influence decision making by passengers and transport providers – reliability can also be defined by performance measurements. These perspectives can be considered in many areas of interest in public transport, in order for example to check if planned schedules are being fulfilled on time, if travel times are compliant with the plan, or if the offered service supply is adequate to the demand.
This paper is a contribution for the development of a decision support concept focused in the monitoring of schedule reliability, which can be viewed as a key issue for passengers, and for the promotion of public transport’s image and quality (Ashmore et al., 2019). A reliable public transport network leads to the creation of more economic opportunities for travellers, to the reduction of inefficiencies that create economic losses, to the improvement and stabilisation of the network itself, to a controlled and more transparent investment process in the sector, and to an overall improvement on the public opinion about public transport.
The next section presents a literature review conducted to determine how schedule reliability is currently being handled. Then, section 3 describes a methodology to evaluate the reliability of single lines and of the whole network, as well as an approach to generate more reliable public transport networks.
2. State of the Art
Public transport reliability is often impacted by a set of factors such as weather conditions (e.g. Miao et al., 2019), traffic congestion (e.g. Nguyen-Phuoc et al., 2019) and driver behaviour (e.g. Mokarami et al., 2019). Besides route compliance (Hrelja et al., 2018) and/or adequacy of service supply (Hirschhorn et al. 2019), these factors can significantly affect scheduling compliance of public transport (Canitez et al. 2019). Table 1 shows schedule reliability has been used to improve operational, tactical and strategic actions from multiple stakeholders, and by different modes of transport and data sources. As these stakeholders have particular, often conflicting interests and needs, reliability should always be considered as a holistic concept.
Many studies have dealt with the reliability of public transport, mainly in Europe (Cats et al., 2016; Weckström et al., 2019) and Asia (Canitez et al., 2019; Zhang et al., 2019). Several authors have compiled a set of operational (Kathuria et al., 2019) and strategic (Maxwell, 1999; Maxwell, 2003) solutions with impact on schedule reliability of a network, considering distinct public transport actors. Although these works have been conducted in order to improve the reliability of real-time operations (e.g. Börjesson & Rubensson, 2019, Diab et al., 2015, Zhang et al., 2019), other studies have been made to rather improve tactical (e.g. Chowdhury et al., 2018, Zhang et al., 2018, Thao et al., 2017) and strategic (Cats et al., 2016, Efthymiou & Antoniou, 2017) management decisions.
Throughout this review, four coordination mechanisms among public transport actors were identified: ownership/instruction, contracts, partnerships, and mutual understanding (Sørensen, 2018). These mechanisms guide formal and informal collaborations between different actors (Pettersson et al., 2018; Paulsson et al., 2018; Rye et al., 2018), sometimes providing the possibility of exerting control over a public transport authority (Hansson, 2010). In general, passengers and transport providers are the main focus of studies about reliability (Chowdhury et al., 2018; Diab et al., 2015): passengers have a higher awareness of the costs of unreliable public transport, and transport providers are the most accessible point of contact for the provision of public transport services. Moreover, transport authorities are also considered by some studies (Canitez et al., 2019; Cats et al., 2016), hoping to determine how they should function to guarantee the establishment of a reliable operation, especially when multiple operators are considered (Hensher & Prioni, 2002). Other research works are based on the idea that a transport authority has an adequate presence and jurisdiction (Hidalgo, 2009; Ibrahim, 2003):
2 to have a centralised operations centre to monitor how all major demanded stops and lines are performing,
thus checking if the metropolitan network operates as a single functioning body;
to check any imbalances and needs from all stakeholders, to maintain the network relevant; to have the power to drive actions to correct and improve the network operations and plan. Table 1. Public transport scheduling reliability assessment.
Ref Case Study
Ac ti o n t y p e Stake-holders Mode of Transport
Data sources Reliability
measures
P O T B M R S
AVL AFC APC S TT CL O
Börjesson & Rubensson, 2019 Stockholm (Sweden) O
Canitez et al., 2019 Istanbul (Turkey) S
Cats et al., 2016 Stockholm (Sweden) S (1)
Chowdhury et al., 2018 Auckland (New
Zealand)
T
dell’Olio et al., 2010 Santander (Spain) S
Diab et al., 2015 - O
Efthymiou & Antoniou, 2017 Athens (Greece) S
Filipović et al., 2009 Belgrade (Serbia) O (2) (8)
Freire de Sousa et al., 2015 - T (9)
Hensher & Prioni, 2002 Tyne and Wear
metropolitan area (UK)
O (3) (7)
Jang, 2014 Seoul (South Korea) T (10)
Parkan, 2002 Hong Kong O (4) (11)
Rietveld et al., 2001 Various cities (the
Netherlands)
S (5)
Soza-Parra et al., 2019 Santiago (Chile) O
Too & Earl, 2010 Gold Coast (Australia) S (6)
Thao et al., 2017 London (UK) T
Tyrinopoulos & Antoniou, 2008
Various cities
(Greece) T
Weckström et al., 2019 Helsinki (Finland) S
Zhang et al., 2018 Wuhan (China) T
Zhang et al., 2019 Various cities (China) O
Action type: O: Operational; S: Strategical; T: Tactical.
Stakeholders: P (Passengers); O (Public transport operator); T (Transport authority). Mode of Transport: B (Bus); M (Metro); R (Rail).
Data sources: S (Survey to passengers); AVL (Automatic Vehicle Location); AFC (Automatic Fare Collection); APC (Automatic Passenger Count); (1) usage of passenger numbers in rush hours; (2) filling from direct interviews with passengers; (3) on-board passenger survey; (4) surveys of customer satisfaction; (5) questionnaire on transport stations/stops; (6) on-line survey filled from current and potential passengers.
Reliability measures: S (Schedule); TT (Travel Time); CL (Crowding Levels); O (Others). (7) Schedule reliability: on time, 5-minutes late, 10-minutes late; (8) Comparison of features, regarding regularity, punctuality, expected travel time achieved; (9) Internal and external reliability issues. E.g.: route configuration and inappropriate scheduling (internal); accidents, traffic congestion or unsuitable parking (external); (10) Transfers; (11) Heavy rail reliability, peak-hours rail performance, safety, ticket reliability, escalator availability.
Several public transport modes have been used to study reliability, particularly in the cases of buses (Filipović et al., 2009; Freire de Sousa et al., 2015; Too & Earl, 2010), metro (Börjesson & Rubensson, 2019; Cats et al., 2016; Parkan, 2002) and rail (Parkan, 2002; Tyrinopoulos & Antoniou, 2008). The literature review reveals that different transport modes have distinct levels of reliability, since characteristics such as right of way, level of driving automation, and the possibility of on-board ticket sale will affect reliability in different dimensions (Vuchic, 2005). As buses are the most accessible way of implementing public transport (Vuchic, 2005), this transport mode is the most frequently studied.
Studies about reliability often use data from surveys of passengers, with values that reflect their opinions (Soza-Parra et al., 2019; Zhang et al., 2019). Nevertheless, travellers are in general treated as passive spectators that do not contribute directly to a better understanding of the problems. In fact, they only see the consequences of poor reliability without knowing precisely what is causing it, in a simple and coherent way. That makes the studies
3 based on travellers’ opinion not so objective and not really suitable for determining which solution should be applied to improve public transport reliability and who will supervise and execute that solution (Yap et al., 2018). To reduce this shortcoming, data from Automatic Vehicle Location – AVL (Börjesson & Rubensson, 2019; Diab et al., 2015), Automatic Fare Collection – AFC (Freire de Sousa et al., 2015; Parkan, 2002), and Automatic Passenger Count – APC (Diab et al., 2015; Weckström et al., 2019) is used to obtain further evidence that supports the case for reliability improvement – giving more precise information about possible reasons for unreliability. Studies on schedule reliability using GPS data open the possibility for new, different types of analysis. Schedule reliability should be perceived by passengers as an understandable measurement of quality in a public transport network – however, the literature does not specify how this measure is connected to transport operators’ reliability performance.
Several reliability measures were defined to quantify reliability in order to improve public transport services. In a recent literature review, Kathuria et al. (2019) specify four types of reliability measures: (i) headway regularity measures; (ii) waiting time measures; (iii) transfer time measures; and (iv) travel time measure. Based on these measures, the majority of the literature views schedule reliability as the primary target for improvements (Chowdhury et al., 2018; Freire de Sousa et al., 2015; Soza-Parra et al., 2019; Zhang et al., 2019), for different purposes – such as improving service quality perceptions for passengers or improving intermodality. Other studies have addressed travel time (Diab et al., 2015; Weckström et al., 2019) and crowding levels (Börjesson & Rubensson, 2019), analysing their impacts on schedule reliability. It is possible to say that schedule reliability is a very sensitive aspect of reliability, when evaluating the quality of public transport services.
In summary, one might say that many different measures for public transport reliability have been used in practice, as summarized in Table 1. Most of the studies are based on passengers’ opinions of what reliable public transport is – making information extraction more difficult and not easily generalizable. To our best knowledge, there is no research explaining how reliability issues propagate on a multimodal network. Complementing studies where multiple reliability levels are taken into account (Chowdhury et al., 2018; Diab et al, 2015), Ma et al. (2013) quantify reliability performance from a passenger perspective.
The work presented in this paper addresses these limitations by proposing a concept to understand how multiple factors can be included in the computation of schedule reliability, to improve the functioning of an intermodal public transport network, from tactical and strategic perspectives, as explained in what follows.
3. Methodology
For developing the concept proposed in this work, we assume that a public transport network is already in operation. The methodology described next will be, then, used to produce an improved version of that network. First a set of factors that determine the schedule reliability of a line will be defined, and then a set of solutions to improve schedule reliability will be established. These solutions will change the way the lines are related with each other – to maximize the number of feasible trips.
3.1. Line reliability
In general, reliability in public transport is associated to the level of service taking into account the expectations. Several reliability indicators can be found in the literature, as well as the factors that may influence reliability. In this paper, we focus on schedule reliability, i.e. the fulfilment of timetables (or frequencies) in multimodal public transport services.
The quantification of schedule reliability depends mainly on two types of data: (i) the specification of the public transport services as they should be performed; and (ii) the services as they were executed. The first is given by General Transit Feed Specifications (GTFS), while the latter can easily be derived from AVL streams. Using these data, several reliability indicators can be computed (Ma et al., 2013):
on-time performance, which is the capacity of an operation to be compliant with a planned time of arrival/departure of a vehicle – this information can be obtained by a combination of GTFS and AVL data, headway regularity, on-time performance, applied to services that are more frequent;
4 waiting time, which is, in general, the most important aspect for a passenger, being derived from a potential
waiting time, inferred from GTFS data;
transfer time, obtained from planned stop times or GTFS data;
buffer time, determined by the time passengers are expected to allocate, to compensate for longer than average travel times – conjugated with GTFS and AVL data, it is possible to determine a safe time range to get to a destination in time.
Ma et al. (2013) propose a framework for assessing the impact of different factors on schedule reliability. Weather, traffic conditions, available information and driver predictability are examples of factors that may affect the reliability of a public transport network. By identifying the factors that affect the service in terms of schedule reliability, it is possible to improve the public transport network at multiple levels:
stops, more oriented to transport users (passengers) – as an example, the journey planning time is about a vehicle being on time to pick the passengers in order to take them to their destinations on time;
lines, more oriented to transport providers – as an example, the buffer time establishes the difference between service strategy and reliability of operations;
network, more oriented to transport authorities – as an example, all travel times, delay times and unfulfilled intermodal connections will have an economic impact, that allows us to compute how much is being saved in terms of efficiency and ease of use, and how and where this impact must be improved.
In the next section, solutions to improve schedule reliability on multimodal public transport services will be presented.
3.2. Network reliability and design
A “composite concept” was defined for helping improve schedule reliability in an intermodal public transport network given that, in an intermodal network, the duly scheduling unsynchronised lines could allow improving the overall reliability of a public transport network. Such approach is based on the following synchronisation mechanisms: (i) close headways; (ii) mainline trunk with timed-transfer branch lines; (iii) hub and spoke systems; and (iv) pulse-hub networks (Maxwell, 1999; Maxwell, 2003). The definition, advantages, disadvantages and the best fit of each mechanism are presented in Table 2.
The concept proposed in this work aims to improve reliability in three situations. First, it will establish timetables to be fulfilled, by the hour – making the task of quantifying how schedules are being fulfilled easier. Second, it checks if operational travel times are right in terms of plan, and if transfers in hubs and transfer points are being effectively made possible. Third, the actual passenger capacity for a connection will be compared to the one planned. The concept will be applied to different areas of the network, based on different data types.
5 Table 2. Line schedule reliability improvement mechanisms.
Solution
name Definition Advantages Disadvantages Best fit Current Uses
Close headways
Routes with close headways that form a network, without consideration for scheduled transfers
Multiple transfer opportunities; high flexibility for schedule redefinition throughout the day and week
Only viable for dense urban areas during the day (due to short headways)
Urban areas with high demand and multiple interconnecting lines High density urban areas (Maxwell, 1999) Mainline trunk with timed-transfer branch lines A network where local feeder lines will serve a main line with passengers
Main line more cost-effective, removing that requirement from feeder lines; transfer from feeder to main line (and vice-versa) guaranteed
Intermodality between branch lines difficult, because they are unsynchronised; branch lines are dependent on the schedule reliability of the main line
Interurban areas, from the suburbs to an urban area – with transfers for lower density population centres
Access to city centre from its suburbs (Maxwell, 1999) Hub and spoke system
A single hub that dispatches all trips that share the same origin, at the same time
Multiple destinations provided, reducing delays for that intermodal transfer; passenger demand concentrated and more service and destinations offered
Indirect trips are necessary for some origin-destination pairs; some travel times have inconsistent variation, throughout the day and week Demand concentration at one point, to serve multiple destinations, in an economically viable fashion Aviation industry (Wei & Hansen, 2005) Radial public transport networks Pulse-hub network A network of multiple hubs, using a fixed or constant interval schedule that dispatches all lines to each hub’s adjacent hubs
Usage of various transport modes; connectivity between lines and modes of transport maximised; navigation improved for passengers making several transfers; express and local services can be present and synchronised in the same network
Schedule reliability is stricter, which affects transfers the most; synchronisation for very low headways (< 15 min) is very delay sensitive and considered not very impactful for passengers
Connecting disperse, moderately demanded areas with multiple types of service and modes available; mainline trunks and hub and spoke systems can feed it; very close hubs can be interconnected by close headways systems Swiss Federal Railways (Maxwell, 2003)
The proposed concept can be presented in terms of: (i) hubs; (ii) transfer points; (iii) stops; and (iv) connections. A hub is a network point where there is a large concentration of public transport demand and a headway synchronisation procedure will take place to guarantee trips with other hubs. A transfer point is a place where a passenger can transfer from one line to another, looking for headway synchronisation. This will occur for branch line transfers to their main line. A stop is a stop to board and/or alight passengers without possibility of transfers or without regard for headway synchronisation or large transfer waiting periods. This is the case for urban, close headway urban areas. A connection is a line that connects all previously described elements.
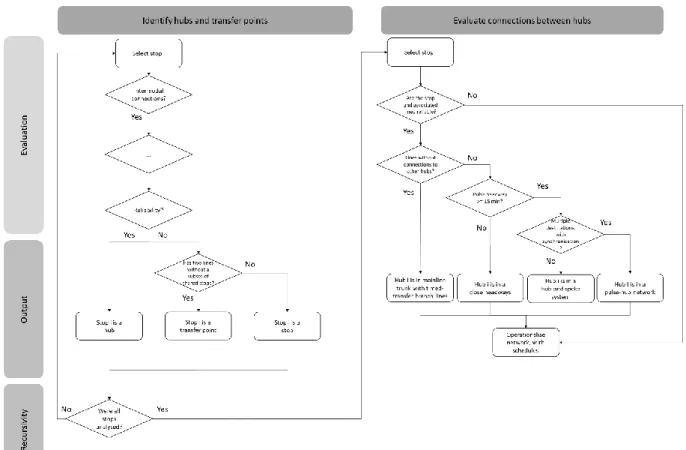
Based on this concept, the system will deliver a “hybrid” integrated network (see Figure \). A “close headways” approach can be applied to an urban area, where many stops exist and the lines have short headways, to be able to meet demand in that urban area. Moreover, in the example, a main line with branch lines was defined (see the right side of Figure 1), making part of the “hub and spoke” system – concentrated and powered by hub C. The “pulse hub network” is represented by four hubs (named A, B, C and D in Figure 2), with timed headways and with travel times compatible to those headways. Because of that timed headway and travel times, it is possible to create transfer points in the middle of the connection (when the passenger wishes to go back to his previous origin) or, when the opportunity is valid, to enter in new synchronised branch lines for local destinations.
6 Fig. 1 Processes to build a public transport network.
Fig. 2 The result of the methodology: a network and its constituents.
When this concept is implemented, a way to measure the public transport network operation reliability can be based on the aspects described above (see previous sub-section), thus quantifying how successful the network is on the improvement of public transport service. As referred, reliability will be measured in three perspectives:
if all vehicles in the network are leaving the hubs at the specified timetable; if trip times specified in each connection are being fulfilled;
7 by establishing timetables within an hour for each hub, to allow transfers between connections.
For the first situation, it is possible to infer departure times from ticket validation, fare collection and vehicle geolocation using AFC and AVL data. Analysing the set of validations in the initial stop of a given connection, situations of a departure before or after schedule can be detected. If these situations are recurrent, there is a need to check what is causing this unreliability problem. Some possibilities are problems with vehicles or an inability to comply with the schedule by the driver. To determine the real causes, data about the status of the vehicles, will be analysed.
Regarding the second point, for all public transport modes without exclusive right-of-way, traffic will be an impactful factor for determining how reliable a mode is, in terms of its schedule. This traffic can be predictable, as in the case of a busy intersection in a rush hour period, or not, when an accident occurs or road infrastructure works are being performed. In this situation, schedule reliability will be determined by sections between stops, to check in which part of the connection traffic condition makes operations more difficult. Having those sections identified, solutions such as exclusive right-of-way (in form of bus lanes, for buses) or traffic prioritisation for may be adopted.
Finally, concerning the third item above, an expected level of vehicle occupancy is defined during the planning of public transport services. Vehicle occupancy is an example of a key performance indicator that measures how a connection is “serving” travellers, determining how healthy and useful its operation is. Otherwise, it is necessary to investigate what is causing higher or lower levels of patronage than the ones predicted. The data to use in this case is the same used to determine vehicle or driver reliability.
4. Conclusion
This paper presents a concept to improve schedule reliability for a metropolitan public transport network. The literature review supports the idea, by a description and analysis of multiple use cases and the similarities between those cases. The concept will assign a value for reliability, and determine, in each context, which type of solution is best suited to enhance schedule reliability. This work seems to be a sound basis for re-designing mobility services, at a metropolitan or regional level. Moreover, integrating planning and monitoring operations into a single approach will allow a better, centralised control of public transport urban networks, making them more reliable and efficient.
Acknowledgements
This work is partially financed by the ERDF - European Regional Development Fund through the Operational Programme for Competitiveness and Internationalisation - COMPETE 2020 Programme and by National Funds through the Portuguese funding agency, FCT - Fundação para a Ciência e Tecnologia within project opti-MOVES (PTDC/ECI-TRA/32053/2017 - POCI-01-0145-FEDER-032053). The work of Tânia Fontes is financed by FCT scholarship SFRH/BPD/109426/2015.
References
Ashmore, D. P., Pojani, D., Thoreau, R., Christie, N., Tyler, N. A., 2019. Gauging differences in public transport symbolism across national cultures: implications for policy development and transfer. Journal of Transport Geography 77, 26–38.
Börjesson, M., Rubensson, I., 2019. Satisfaction with crowding and other attributes in public transport. Transport Policy 79, 213–222. Canitez, F., Alpkokin, P., Black, J. A., 2019. Agency costs in public transport systems: Net-cost contracting between the transport authority
and private operators - impact on passengers. Cities 86, 154–166.
Cats, O., West, J., Eliasson, J., 2016. A dynamic stochastic model for evaluating congestion and crowding effects in transit systems. Transportation Research Part B: Methodological 89, 43–57.
Chang, Y. B., Stopher, P. R., 1981. Defining the perceived attributes of travel modes for urban work trips. Transportation Planning and Technology 7(1), 55–65.
Chowdhury, S., Hadas, Y., Gonzalez, V. A., Schot, B., 2018. Public transport users’ and policy makers’ perceptions of integrated public transport systems. Transport Policy 61, 75-83.
Diab, E. I., Badami, M. G., El-Geneidy, A. M., 2015. Bus Transit Service Reliability and Improvement Strategies: Integrating the Perspectives of Passengers and Transit Agencies in North America. Transport Reviews 35(3), 292–328.
dell’Olio, L., Ibeas, A., Cecín, P., 2010. Modelling user perception of bus transit quality. Transport Policy 17(6), 388–397.
Efthymiou, D., Antoniou, C., 2017. Understanding the effects of economic crisis on public transport users’ satisfaction and demand. Transport Policy 53, 89–97.
8 Filipović, S., Tica, S., Živanović, P., Milovanović, B., 2010. Comparative Analysis of the Basic Features of the Expected and Perceived Quality
of Mass Passenger Public Transport Service in Belgrade. Transport 24(4), 265–273.
Freire de Sousa, J., Mendes-Moreira, J., Moreira-Matias, L., Gama, J. 2015. Reliability metrics for the evaluation of the schedule plan in public transportation. Assessment Methodologies: Energy, Mobility and Other Real World Application, 151–169.
Goverde, R. M. P., 1999. Improving Punctuality and Transfer Reliability by Railway Timetable Optimization. Proceedings of the 5th TRAIL Annual Congress.
Guihaire, V., Hao, J. K. 2008. Transit network design and scheduling: A global review. Transportation Research Part A: Policy and Practice 42(10), 1251–1273.
Hidalgo, D., 2009. Citywide Transit Integration in a Large City. Transportation Research Record: Journal of the Transportation Research Board 2114(1), 19–27.
Hirschhorn, F., Paulsson, A., Sørensen, C. H., Veeneman, W. 2019. Public transport regimes and mobility as a service: Governance approaches in Amsterdam, Birmingham, and Helsinki. Transportation Research Part A: Policy and Practice 130, 178–191.
Hansson, L., 2010. Solving procurement problems in public transport: Examining multi-principal roles in relation to effective control mechanisms, Research in Transportation Economics 29(1), 124-13.
Hensher, D. A., Prioni, P., 2002. A Service Quality Index for Area-wide Contract Performance Assessment. Journal of Transport Economics and Policy 36(1), 93–113.
Hrelja, R., Rye, T., Mullen, C., 2018. Partnerships between operators and public transport authorities. Working practices in relational contracting and collaborative partnerships. Transportation Research Part A: Policy and Practice 116, 327–338.
Ibrahim, M. F., 2003. Improvements and integration of a public transport system: The case of Singapore. Cities 20(3), 205–216. Jang, W. 2010. Travel time and transfer analysis using transit smart card data. Transportation Research Record (2144), 142–149.
Jenelius, E., 2018. Public transport experienced service reliability: Integrating travel time and travel conditions. Transportation Research Part A: Policy and Practice 117, 275–291.
Kathuria, A., Parida, M., Sekhar, C. R., 2019. A Review of Service Reliability Measures for Public Transportation Systems. International Journal of Intelligent Transportation Systems Research, 1–13.
Ma, Z., Ferreira, L., Mesbah, M., 2013. A framework for the development of bus service reliability measures. Australasian Transport Research Forum, ATRF 2013 - Proceedings.
Maxwell, R. R., 1999. Intercity rail fixed-interval, timed-transfer, multihub system: applicability of the Integraler Taktfahrplan strategy to North America. Transportation Research Record (1691), 1–11.
Maxwell, R. R., 2003. Converting a Large Region to a Multimodal Pulsed-Hub Public Transport Network. Transportation Research Record: Journal of the Transportation Research Board 1835(1).
Mokarami, H., Alizadeh, S. S., Rahimi Pordanjani, T., Varmazyar, S. 2019. The relationship between organizational safety culture and unsafe behaviors, and accidents among public transport bus drivers using structural equation modeling. Transportation Research Part F: Traffic Psychology and Behaviour 65, 46–55.
Miao, Q., Welch, E. W., Sriraj, P. S., 2019. Extreme weather, public transport ridership and moderating effect of bus stop shelters. Journal of Transport Geography 74, 125–133.
Nguyen-Phuoc, D. Q., Currie, G., De Gruyter, C., Young, W., 2018. Congestion relief and public transport: An enhanced method using disaggregate mode shift evidence. Case Studies on Transport Policy 6(4), 518–528.
Parkan, C., 2002. Measuring the operational performance of a public transit company. International Journal of Operations and Production Management 22(5–6), 693–720.
Paulsson, A., Isaksson, K., Sørensen, C., Hrelja, R., Rye, T., Scholten, C., 2018. Collaboration in public transport planning – Why, how and what?. Research in Transportation Economics, 377-385.
Pettersson, F., Westerdahl, S., Hansson, J., 2018. Learning through collaboration in the Swedish public transport sector? Co-production through guidelines and living labs, Research in Transportation Economics 69, 394-401.
Prashker, J. N., 1979. Direct Analysis Of The Perceived Importance Of Attributes Of Reliability Of Travel Modes In Urban Travel. Transportation 8, 329–346.
Redman, L., Friman, M., Gärling, T., Hartig, T., 2013. Quality attributes of public transport that attract car users: A research review. Transport Policy 25, 119–127.
Rietveld, P., Bruinsma, F., van Vuuren, D., 2001. Coping with unreliability in public transport chains: A case study for Netherlands. Transportation Research Part A: Policy and Practice 35(6), 539–559.
Rye, T., Monios, J., Hrelja, R., Isaksson, K., 2018. The relationship between formal and informal institutions for governance of public transport, Journal of Transport Geography 69, 196-206.
Sørensen, C.H., 2018. A typology of inter-organisational coordination in public transport: The case of timetable planning in Denmark, Research in Transportation Economics 69, 411-419.
Soza-Parra, J., Raveau, S., Muñoz, J. C., Cats, O., 2019. The underlying effect of public transport reliability on users’ satisfaction. Transportation Research Part A: Policy and Practice 126, 83–93.
Thao, V. T., Wegelin, P., von Arx, W., 2017. Are statutory passenger watchdogs effective in representing passenger interests in public transport? Transport Policy 58, 1–9.
Too, L., Earl, G., 2010. Public transport service quality and sustainable development: A community stakeholder perspective. Sustainable Development 18(1), 51–61.
Tyrinopoulos, Y., Antoniou, C., 2008. Public transit user satisfaction: Variability and policy implications. Transport Policy 15(4), 260–272. Vuchic, V., 2005. Urban transit : operations, planning and economics. Hoboken, N.J: J. Wiley & Sons.
Vuchic, V. R., Clarke, R., Molinero, A., 1981. Timed Transfer System Planning, Design and Operation. U.S. Department of Transportation. Wang, Y., Correia, G., van Arem, B., Timmermans, H., 2018. Understanding travellers’ preferences for different types of trip destination based
on mobile internet usage data. Transportation Research Part C: Emerging Technologies, 247-259.
Weckström, C., Kujala, R., Mladenović, M. N., Saramäki, J., 2019. Assessment of large-scale transitions in public transport networks using open timetable data: case of Helsinki metro extension. Journal of Transport Geography 79.
Wei, W., Hansen, M. (2006). An aggregate demand model for air passenger traffic in the hub-and-spoke network. Transportation Research Part A: Policy and Practice 40(10), 841–851.
9 Transport Policy 61, 84–95.
Zhang, C., Liu, Y., Lu, W., Xiao, G., 2019. Evaluating passenger satisfaction index based on PLS-SEM model: Evidence from Chinese public transport service. Transportation Research Part A: Policy and Practice, 120, 149–164.
Zhang, X., Zhang, Q., Sun, T., Zou, Y., Chen, H., 2018. Evaluation of urban public transport priority performance based on the improved TOPSIS method: A case study of Wuhan. Sustainable Cities and Society 43, 357–365.