Casos
de Marketing Público y No Lucrativo
Vol 2, pp: 45-56
de Marketing Público e Não Lucrativo
LEIGOS PARA O DESENVOLVIMENTO: DONATIONS OPTIMIZATION
THROUGH PRIVATE SEGMENTATION
Raul M. S. Laureano
Rui Vinhas da Silva (Instituto Universitário de Lisboa (ISCTE-IUL), Portugal)
Joana Pereira Sandrina Martins David Rodrigues
Resumo:
Os Leigos para o Desenvolvimento (LD) são uma ONGD (Organização Não Governamental para o Desenvolvimento) cujo financiamento resulta, em grande parte, de donativos obtidos junto da comunidade. Neste contexto e com o objectivo de optimização de recursos alocados à recolha de donativos e da maximização de receitas daí decorrentes, pretende o presente estudo avaliar da eficácia relativa de técnicas de segmentação de doadores na consecução desse objectivo. No sentido de informar o processo e estratégia de angariação de donativos optimizando-o, confrontam-se os méritos de soluções intuitivas e baseadas na experiência com técnicas de segmentação com substrato empírico e validadação estatistica. Conclui-se que não existe uma única técnica de segmentação adequada ao problema, sendo que cada caso é um caso.
Abstract:
Leigos para o Desenvolvimento (LD) are a NGOD (Non-Governmental Organization for Development) whose financing derives from donations obtained in the wider community. In this context and with the purpose of optimizing resource allocation in donations collection and the maximization of revenue thereof, the current study aims to assess the relative effectiveness of segmentation tools in donations with that purpose in mind. In informing the process and strategy of donations and thus optimizing organizational revenue, we aim to confront the merits of intuitive and experiential solutions with those that result from empirical data gathered and statistical techniques applied to segmentation tools and techniques. We conclude that there exists no one segmentation solution for sorting out the problem, opting instead for claiming that each case should be treated as unique and evaluated on its own.
1. Introduction
Leigos para o Desenvolvimento (LD), founded in 11 April 1986, are recognized as a NGOD (Non Governmental Organization for Development) and Catholic Association. Their mission is to foster the comprehensive and integrated development of people and communities in developing countries and Portugal, in regards to their autonomization and empowerment, through training, of the winessing and preferential intervention of qualified volunteers. As such, they are an organization whose approach to action is firmly settled in local, participative, sustainable and humane development, through the the responsible and commited action of qualified and long-term (whether of one, two or more years) volunteers.
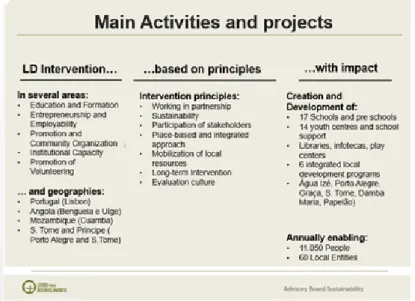
The organization purposefully uses their website (www.leigos.org) and Facebook page (https://www.facebook.com/leigosparaodesenvolvimento?fref=ts) to promote their activity and as a means of communicating with their stakeholders. A quick browsing of the pages allows for a fast understanding of their value and principles, as well as their mission and vision. Viewers will be able to see the organization’s current development projects, which occur in S. Tomé e Príncipe, Angola and Mozambique, and a few projects in Portugal (Figures 1 and 2). A more extensive browsing of the pages allows for a better understanding of the projects in which the LD are involved in, as well as their impact (Figure 3).
Figure 1. LD webside
Source: [http://www.leigos.org]
Figure 2. LD Facebook page
Source: [http://www.facebook.com/leigosparaodesenvolvimento]
Figure 3. LD’s main activities and projects.
In recent years a number of factors, including (CCS, 2014:5) “the national and international economic and financial crisis; cutbacks in national and European public investment in development cooperation; individual and collective entities being less receptive and willing to invest in support of projects outside of Portugal; excessive private short-term financing without renewal, not compatible with medium- and long-term development projects; and the increase in competition in third sector players" have led the LD to seriously consider their sustainability. In view of that, in mid-2014, the Sustainability Advisory Board was created. This Board is comprised of both scholars and professionals with a vast knowledge of the non-profit sector of the economy.
Its purpose is to successfully attain the two defined priority strategic objectives: to promote financial sustainability through the diversification of funding sources and the generation of their own revenue: ii) to strengthen the LD’s external credibility and notoriety.
The LD’s funding sources, although diverse (private benefactors, private and public entities, merchandising, provision of services), are indeed neither sufficient nor predictable in the mid-term for the execution and growth necessities of their projects (Figure 4).
Figure 4. LD’s income sources.
Source: CSS (2014:8).
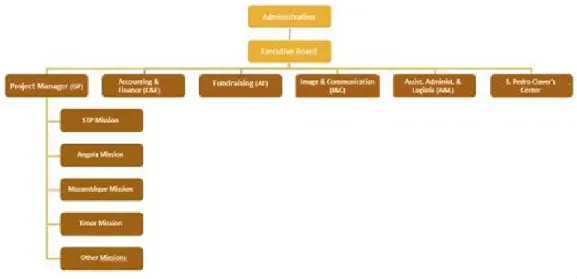
At the same time, the LD's executive team has begun to include a person responsible for fundraising and a person responsible for image and communication, two areas that are now considered primordial for the sustainability of the organization (Figure 5). Among the objectives of the person in charge of fundraising is the investment in the benefactors/private donors, which include (CCS, 2014): i) the implementation of a CRM; ii) regular and customized communication; and iii) gathering new benefactors. The LD intend to hire a fundraising intern whose main function will be updating the donors and donations databases, which are currently missing many details, namely those pertaining to the socio-demographic characterization of the donors.
Figure 5. LD’s executive team structure.
In this context, the LD seek to answer the question of which marketing strategies for raising funds from private donors should the LD favour?
2. The case: inputs
Given the lack of financial resources which provide support for teams during assignments, but also given the skilled human resources, although in limited number, and other resources, especially regarding information systems, the LD intend to extract information, and therefore knowledge, from the data they have stored in their databases. In particular, they intend to: target private donors according to their disposition for donation; ii) identify the donor profile with greater propensity to donate when facing a request to support a project; and iii) identify dormant donors, but who have the potential to donate.
The person responsible for fundraising has decided to request help from researchers from a university’s research centre, given the key importance of short-term fundraising, especially with private donors. In this way he plans to develop an alternative action plan to the one he himself will propose to the organization's executive team, as well as analyse the solutions and help establish a future plan of action together.
Available data
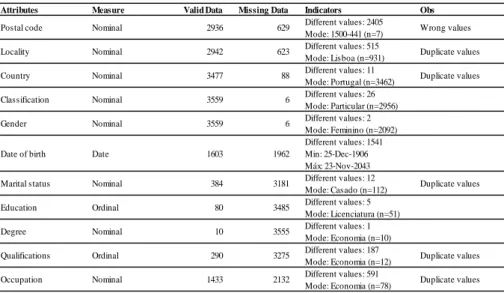
The available data refer to private donors and their donation, having been extracted from the information system to two Excel spreadsheets. The connection between donors and donations is established through a field in both tables named ‘ID’. Table 1 shows there are 3565 registered donors and their main sociodemographic traits. However, a closer analysis has allowed several flaws to be identified, such as duplicate values (for example, the same marital status in upper and lower case), inaccurate dates (birth dates that would only happen in the future), wrong values (non-existent postal codes or lacking digits), and above all else, a large amount of missing data.
Table 1. Structure of the LD’s donor (benefactor) data table.
Attributes Measure Valid Data Missing Data Indicators Obs
Postal code Nominal 2936 629 Different values: 2405
Mode: 1500-441 (n=7) Wrong values
Locality Nominal 2942 623 Different values: 515
Mode: Lisboa (n=931) Duplicate values
Country Nominal 3477 88 Different values: 11
Mode: Portugal (n=3462) Duplicate values
Classification Nominal 3559 6 Different values: 26
Mode: Particular (n=2956)
Gender Nominal 3559 6 Different values: 2
Mode: Feminino (n=2092)
Date of birth Date 1603 1962
Different values: 1541 Min: 25-Dec-1906 Máx: 23-Nov-2043
Marital status Nominal 384 3181 Different values: 12
Mode: Casado (n=112) Duplicate values
Education Ordinal 80 3485 Different values: 5
Mode: Licenciatura (n=51)
Degree Nominal 10 3555 Different values: 1
Mode: Economia (n=10)
Qualifications Ordinal 290 3275 Different values: 187
Mode: Economia (n=12) Duplicate values
Occupation Nominal 1433 2132 Different values: 591
Mode: Economia (n=78) Duplicate values Total of donors / benefactors: 3565
In regards to the donation table (Table 2), there are 10970 donations registered, received between 31 December 1995 and 16 September 2014, with the most common donation value being 25 euros.
Table 2. Structure of the LD’s received donations data base.
Attributes Measure Valid Data Missing Data Indicators Obs
Donation date Date 10964 6
Different values: 2245 Mode: 31-Dez-1997 (n=120) Min: 31-Dez-1995 Máx: 16-Set-2014
Donation value Contínuous 10958 12
Different values: 288 Mean: 98,78 Euros Mode: 25,00 Euros (n=2375) Min: 0,00 Euros Máx: 10692,90 Euros
Donation origin Nominal 10970 0 Different values: 12
Mode: Donativos (n=5064) Total donations: 10970
Associated fundraising concepts
Although there are several definitions of donations, the LD consider a donation to be something given by private donors or companies to help the LD in their fields. That help can take many forms, such as monetary, project patronage, special support, volunteering, campaigns and merchandising. Donations of money, from private donors in particular, can be either sporadic or regular. These can be made through ATM machines, e-banking services, sending checks or through the consignment of 0.5% of the Income Tax (IRS).
Regarding the LD, private donors are essential, since they provide the largest monetary assistance. It is for this reason that it is important to get to know the sociodemographic traits that have the greatest influence on donor’s donation behaviour. Several fundraising studies have considered the explanatory sociodemographic attributes to be primarily gender, age, income and number of children (Table 3). To mention but a few examples, it was concluded that female donors donate more frequently and in larger amounts; that older donors tend to donate larger amounts and with greater frequency (although these behaviours tend to wane after the age of 65), but are less likely to respond positively to door-to-door requests; that donors with higher income have a tendency to donate frequently and in greater values, although the inverse has also happened; and also that donors with children (especially of a younger age) tend to donate in larger amounts and greater frequency, perhaps incentivized by their children, who were, in turn, induced by the associations in which they practice their extracurricular activities.
Table 3. Explanatory factors of donations.
Sociodemographic traits Srnka et al . (2003) Lee & Chang (2007) Kim et al . (2010) Oliveira et al . (2010) Sargeant & Jay (2010) Bekkers & Wiepking (2011) Wiepking & Bekkers (2012) Zhao (2013) Number of times it is mentioned Gender 7 Age 7 Education 3 Ocupation 2 Marital status 1 Number of childrens 6 Income 6 Household 5
Associated marketing concepts
The purpose of segmentation is to group individuals into uniform groups, according to their sociodemographic traits (usually). This process allows for more adequate and effective communication between organization and donor. (Carmona, 2013).
Despite the diverse techniques and criteria for segmentation, as of yet there isn’t a consensus between the various authors about methods. The most commonly used methods are based in sociodemographic or psychographic data, or data pertaining to past behaviours (Srnka, Grohs, & Eckler, 2003).
Donor sociodemographic segmentation is the method most commonly used by NGODs, due to the ease with which donor traits such as gender, age, marital status, academic qualifications, income and number of children, are measured. These organizations tend to favour this type of segmentation since they don’t normally have the capacity to collect further data from their donors. NGODs can, however, evaluate how these donor traits influence donor behaviour regarding their donations, namely in amount and frequency of donation (Webb, Green, & Brashear, 2000).
The psychographic analysis method helps to understand the reason that leads people to donate, as well as donation benefits from a donor’s perspective and what motivates them. Contrary to sociodemographic traits, these are difficult to measure given their subjectivity (Srnka et al., 2003), which makes this method rarely used. The first study about donor motivation in Portugal included and evaluation, by mans of a long questionnaire, of the level of selfishness, altruism, voluntarism, compassion, social and religious desirability of 612 donors registered in several non-profit organization’s databases (Abreu, 2012). Regarding the method based on donation history, it’s interesting to group individual donors according to their latest donation, that is, its recency, the frequency of the donations and the monetary value of the donation. This approach is known as RFM, and mostly used in direct marketing issues, making it an essential instrument in the identification of the best (active) donors. However, if the objective is to increase the number of donors by attracting individuals that have never donated to the organization, this approached cannot be used (Srnka et al., 2003).
The RFM method is used in generating scores based on each donor. This is assumes that donors who donate who donate larger amounts are more attractive than those that donate smaller amounts, that donors who donate frequently have a greater chance to respond positively to a campaign when compared to those who don’t and that donors who have donated in the last six months are more likely to donate again than those who have not donated in the last two years. To sum up, this approach reflects private donor behaviour and allows the organization to know who should be targeted for a given campaign. (Sargeant & Jay, 2010)
The growth and improvement of these approaches are what made segmentation desirable. It allows organizations to customize their message to distinct groups of donors and also to identify the most promising private donors, thus optimizing campaign success (Srnka et al., 2003).
There are, however, a few disadvantages to using segmentation as a marketing tool. On the one hand, NGODs who aren’t capable or don’t have the knowledge to implement a segmentation process are injured. On the other, donors tend to become confused by requests from several organizations that use segmentation to choose their campaigns audience. This leads to a decrease in the number of donors who donate to a single organization, which, consequently, leads to the value of the donation to be shared between the various organizations. In addition, donors who are used to being targeted by segmentation practices end up not trusting the efficiency of an organization with a more generalistic approach.
After the groups have been formed, it becomes possible to identify the donor profile of each group, whether regarding the traits that lead to their formation or any other traits. For example, it is possible to group donors first according to their sociodemographic traits, and then identify their donation practices (frequency of the donations, amounts donated, and others), that is, to know their comportmental profile regarding the organization. In addition, it also becomes possible to identify each group’s probability (propension) to respond positively to a given request as part of a fundraising campaign.
Figure 6 illustrates the possible phases to be followed in order to maximize the value creation from available data. The longer the donation between donor and organization, the greater the amount of data available regarding the donor and their behaviour, which leads to a greater information and knowledge generation from that same data.
Figure 6. Value creation stages in a segmentation process
Associated data analysis concepts
Simply put, explanatory data analysis includes the preparation and validation of the data. Of the activities that can be carried out in that regard, of highest note is the descriptive analysis of each available attribute, with the objective of identifying non-answers, extreme values (outliers) or data entry error, and of knowing the distribution of the attribute. This, on the one hand, allows to detect the necessity to transform that attribute (generally speaking, to substitute non-answers and creating levels or to create logarithms of measurable attributes), and on the other facilitates the decision of including the attribute in the following phase of the analysis, the modeling phase, or not to.
After being validated and understood, the available data becomes necessary within the scope of a bivariate descriptive analysis which first analyses the relations between independent variables (explanatory attributes) and then analyses the relations between each independent variable and each dependent variable (explained attributes). These analyses allow for the detection of redundancies in the explanatory attributes and, thus, make it possible to reduce these attributes so as to facilitate model construction, or to help selecting which explanatory attributes should be included in the models.
The next phase is the modeling phase, which, besides explaining what was observed, has the objective of generating knowledge to help in future decision making. Modeling can be descriptive or predictive. Descriptive modeling includes algorithms of segmentation (group) and of common association rules
Propensities Profile
Classification Segmentation
- Number of available variables + New Donor Antiquity Very old
which aim to describe the past. Predictive modeling, on the other hand, includes classification and regression algorithms which aim to predict an existing trait, based on other traits that are also present in the data tables. Both have the objective of estimating the most likely value of the target trait, once the values of input traits are known.
Segmentation techniques aim to group individuals that are close in regard to certain traits and techniques which produce association rules aim to, for example, identify events which occur simultaneously, that is, they aim to describe relations between categories. On the other hand, classification techniques aim to predict a qualitative trait and regression techniques aim to predict a quantitative trait.
To sum up, every data analysis should a basis that guarantees success. In other words, it should answer positively to the problem that prompted it. In this manner, it becomes crucial to adopt a methodology while in a process of discovery, with the CRISP-DM (Cross-Industry Standard Process for Data Mining) methodology being one of the most commonly used (Figure 7). Six phases can be identified, as well as the possibility of regressing to an earlier phase from a later one. The objective always remains to generate knowledge that is useful to those responsible for making decisions. In this stage the intention is to: Understanding of the business problem – properly define the objective; ii) understanding the data – identify and understand the meaning of available data; iii) data preparation – transform and validate the data so as to ensure that they are essential to the problem; iv) modeling – construct models that are adequate to the problem; v) evaluation – evaluate different constructed models, taking into account the objectives and their interpretation and usefulness; and vi) implementation – include the models chosen as the most adequate in the systems of support to the decision, so that these can be used by those responsible for making decisions.
Finally, Figure 8 illustrates the relation between the complexities of analytical techniques (or problems to be solved) and value creation for the organizations.
Figure 7. CRISP-DM methodology phases.
Source: Adapted from IBM (2013: 1).
Figure 8. Value creations and complexities of data analysis.
3. The case: outputs, proposed solutions
Given the available data, two solutions were proposed: one of a more analytic nature, that is, that explores the available data in order to generate knowledge useful for the decision making, and another based more on the intuition of the fundraising professional, which results from their vast experience in the field in general, and within the organization in particular.
Research centre researchers
The donors were segmented according to their previous donor behaviour regarding to recency, number of days since the last donation, frequency, number of donations made in the last two years, and monetary value, total donation value in known record (1996). The score was calculated for each aspect of RFM segmentation (recency, frequency and monetary value), within five ranges. The donors were sorted within each aspect in descending order. The 20% of donors with the lowest recency value and highest frequency and monetary value were scored 5 on each aspect. Those below the 20% with highest recency and lowest frequency and value were scored 1. In this way, a donor with a RFM score of 555 is one who is within the 20% that donated more recently, who has a high number of donations in the last two years and who, since 1996, made donations which accumulate to a high value.
Based on the three scores, the donors were grouped in four homogeneous groups using the k-means algorithm. The results are shown in Table 4.
Table 4. Donor groups obtained with the k-means algorithm.
Days Score Nº Score Total values Score
G1 1039 2829,46 2,57 0,00 1,00 515,03 3,99 ?
G2 1153 3593,09 2,14 0,00 1,00 37,21 1,68 ?
G3 476 263,12 4,78 3,88 4,63 1023,71 4,62 ?
G4 360 337,61 4,65 1,31 4,15 47,69 1,98 ?
Total 3028 2420,55 3,00 0,77 1,95 357,49 2,97
Group Dimension Recency (mean) Frequency (mean) Monetary value (mean) Donor type
Afterwards a classification tree was created with the CART algorithm to classify donors within each group, and thus identify each group profile. Different models were considered, until finally the model chosen was the one that best classifies the sample donors, but also better allows for the generalization of the results (evaluated through the 10-fold cross-validation method). The model was based on the following explanatory traits: donor age on the day of the last donation as well as on the day of the first donation, gender, marital status (single, married, divorces, widowed and won't answer), place of residence (within Lisbon or without), country of residence (Portugal or foreign country), employment status (active, retired, won’t answer) and donor classification (private with a special relationship with the LD, or private without a special relationship). The results obtained from the model with 8 depth levels and a minimum number of 20 donors in the parent nodes and 5 in the child nodes lead to the conclusion that this model correctly classifies 54.5% of the donors (Table 5) and that, when applied to new donors, correctly classifies 50.2%, with group 2 producing the best results (86.5% correctly classified), and group 1 the worst (only 27.8% correctly classified).
Model analysis allows for certain conclusion to be reached, such as:
• If a donor has a special relationship with the organization, is married, is aged from 27.5 years up to, and including 29.5 years on the day of the first donation, and on the day of the last donation is aged from 31.5 years up to, and including, 39.5 years, then the donor has a chance of being part of group 1 of 0.9;
• If a donor is private but without a special relationship with the organization, is male and single, is aged from 31.5 years up to, and including 39.5 years on the day of the first donation, and on the day of the last donation is aged up to, and including, 34.5 years, and doesn’t live in Lisbon, then the donor has a chance of being part of group 2 of 1;
• If a donor is private but without a special relationship with the organization, is single, is aged up to, and including, 75.5 years on the day of the first donation, and on the day of the last donation is aged over 82.5 years, then the donor has a chance of being part of group 3 of 0.875;
• If a donor has a special relationship with the organization, is single, is aged over 43.5 years on the day of the first donation, then the donor has a chance of being part of group 4 of 0.8.
These kinds of rules allow for donor profiles in each group to be identified, although with the knowledge that the model only correctly classifies over half the cases in groups 2 and 4.
Table 5. Classification tree quality.
G1 G2 G3 G4 % correct G1 289 620 70 59 27,8% G2 77 997 12 67 86,5% G3 84 153 181 58 38,0% G4 25 131 20 184 51,1% % Total correct 15,7% 62,8% 9,3% 12,2% 54,5% Observed group Foreseen group
The results also showed that donor age is the most important trait in the classification, followed by marital status and donor classification. Tables 6 to 8 allow for each segment to be characterized regarding these three traits. It is interesting to note that donors from group 3 are the oldest (with an average age of 61.3 years on the day of their last donation), tend to be married (51.9%) and usually don’t have any special relationship with the organization (only 13.7% of the donors do). It is equally interesting to verify that over half (50.8%) of the donors in group 4 have a special relationship with the organization and tend to be single (60%) aged, on average, under 50 years on the day of the last donation.
Table 6. Age average per group.
Group Age First donation Age Last donation G1 47,1 51,4 G2 45,3 45,9 G3 51,7 61,3 G4 46,2 48,1 Total 47,6 51,8
Table 7. Group percentage distribution according to marital status and donor classification.
Married Divorced Single Widow Private
Private with special relationship G1 42,4 33,3 40,0 33,3 36,6 18,3 G2 25,6 50,0 23,3 0,0 41,1 17,8 G3 21,6 16,7 19,2 33,3 15,6 16,8 G4 10,4 0,0 17,5 33,3 6,7 47,2 Total 100,0 100,0 100,0 100,0 100,0 100,0 Grupo Classification Marital status
Table 8. Percentage distribution of marital status and donor classification according to group.
Married Divorced Single Widow Private
Private with special relationship G1 51,0 1,9 46,2 1,0 93,2 6,8 G2 50,8 4,8 44,4 0,0 94,0 6,0 G3 51,9 1,9 44,2 1,9 86,3 13,7 G4 37,1 0,0 60,0 2,9 49,2 50,8 Total 49,2 2,4 47,2 1,2 87,2 12,8 Grupo
Marital status Classification
Based on the results, the researchers advise the LD to select groups 3 and 4 as the target of a future campaign, by means of a segmentation based on past donor behaviour. Additionally, they advise the LD to set an appealing campaign intended to recover dormant donors (that is, donors that are no longer helping the LD), and target donors from group 1.
Person in charge of fundraising
Given his experience, the person in charge of the LD’s fundraising proposes a segmentation of private donors, based on their past behaviour (Table 9). He also defines retained donors as those who have donated in the last two years, and monthly donors as those who have donated at least six times in the past year. Table 10 shows the number of donors by segment.
Table 9. Private donor segmentation.
Table 10. Donor number progression.
The analyses of a few of the numbers show a liquid gain of 47 donors in 2013. However, in that same year 121 repeating donors were lost. Additionally, it was found that new donors represent about 25% of all active donors, but only represent 14% of the total amount donated, indicating a low average value per donation (Table 11).
Table 11. Performance indicators of private donors in 2013 (losses and gains).
Category Donations % Donations %
Nº Donors Donation values
New 141 25,0% 8 609 € 14,0%
Recuperated 119 21,1% 11 549 € 18,8%
Donated value increase 108 19,1% 21 967 € 35,7%
Same value 107 19,0% 11 075 € 18,0%
Donated value decrease 89 15,8% 8 368 € 13,6%
Total 564 100,0% 61568 100,0% 2013 2013
In this context, the person in charge of fundraising intends to select 304 retained donors as the target for the new campaign. However, due to the high cost of sending letters, these will be restricted to a maximum of 200 donors. As such, the intention is to send letters to female donors over 50 years, as these are the ones who tend to donate most and with the highest frequency. On the other hand, the person in charge of fundraising intends to have a team in the main churches of Lisbon, on the two Sundays that precede the campaign deadline, in order to ensure the necessary funding for the project. This idea is based on the intuition that religious people tend to be more generous and, consequently, to donate more.
The person in charge of fundraising also plans to send customized letter to dormant donors (considered lost), especially to those repeating donors who were lost, trying to take advantage of past experience in recuperating donors and the fact that their involvement with the organization lasted at least two years.
Questions for discussion:
Given what was previously stated, and context of the organization, answer the following questions: Question 1. Is the stored data enough to make decisions on strategies for fundraising?
Question 2. Given the solution proposed by the researchers:
a) Was the RFM segmentation criteria and the definition of its dimensions the most appropriate to the objectives outlined?
b) Can you assign a name (donor type) for each of the segments proposed by researchers?
c) Which segment should be focused on in next direct marketing campaign in order to obtain a donation for a new mission?
d) Are the four donor profiles that were found of interest to the LD, i.e. can they be the target of fundraising campaigns?
e) Can the results be improved using other data analysis techniques, including data mining techniques, such as neural networks?
Question 3. Do you consider solution proposed by the person in charge of fundraising to be a valid one? Question 4. Do you believe that organizations should opt for a data-driven strategy? That is, should they adopt methodologies, tools, techniques and analytical solutions to convert existing data in organizations or outside them into useful information to business and decision-making, leading to the value creation (knowledge) that is reflected in the increased competitiveness of organizations?
Question 5. Which marketing strategies for raising funds from private donors should the LD favour? Question 6. If you were the head of the organization, which solution would you implement: the researchers’, the person in charge of fundraising’s, or a combination of both?
4. Conclusiones
The organizations are faced with complex problems that require, on the one hand, vast knowledge about the organization and its means, and on the other hand, available data and knowledge of analytical techniques that can help the decision making process. Organizations have only recently begun channelling funding into information systems, and must now offer formation in the field of statistics and data analysis to their collaborators and, eventually, invest in hiring consultants from the fields. In this way, the option of asking for help from a research centre enables organizations to gain know-how with the academics, as well as allowing them to know the reality of organizations and conduct part of their research applied to real cases.
There are usually no right or wrong answers in organizations, and only rarely is it possible to understand afterwards if the decision that was made was the optimal solution. Frequently, it is only possible to state, given the information and knowledge available, that the decision made was a good decision or a decision that was adequate to the problem. In addition, it is well known that the best decisions tend to be supported by numbers, interpreted based on the experience of decision-makers, and often on their intuitions. In this age, it seems clear that organizations must walk towards a data-driven strategy, so as to improve their competitive edge.
Furthermore, past positive results do not guarantee positive ones in the future. Also, statistical models, such as segmentation and classification should be periodically adjusted to make them actually useful for decision-making. For example, in the case of RFM segmentation, a donor can change groups in a month, so the segmentation must be dynamic.
Given what was stated, it isn’t possible to say that there exists a single segmentation technique that is adequate to the problem. In the past, sociodemographic segmentation of individuals has shown positive results for organizations, but it is also possible to say that new segmentation criteria, based, for example, on past behaviour or on donor personality traits, have yielded good results is some organizations. Organizations should thus analyse different segmentation solutions and combinations of targeting criteria in order to identify the model that best meets the objectives outlined.
On the other hand, segmentation is crucial to marketing, the scientific area to which fundraising belongs. Since financial resources in organizations aren’t high, the direct marketing and relational marketing approaches can potentiate results when compared to a more traditional, generalistic approach. Only with new approaches can organizations ensure their sustainability, by maximizing their revenue from private donations.
In this case, both proposed solutions are interesting. Firstly, the use of statistical techniques allows, in a way, for the analysis not to be bias. Secondly, the experience and intuition of the person in charge of fundraising led to the identification of religiosity as one of the motivations to donate, so this feature can be incorporated in the statistical models, so long as it is possible to measure donor religiosity in a relatively easy manner. It is of further note that the models obtained don’t allow to understand why donors change their behaviours, why they donate more or less, stop donating, to mention but a few. In short, both the informed decision (from the researchers) and informed decision complemented by intuition (from the person responsible for fundraising) are acceptable solutions, although the second one is better. In fact, intuition is trained through the interaction over an error and further improved with the incorporation of the information provided by the data. There is no a priori intuition!
Referencias
Abreu, M. E. (2012). Drivers of Donations Practices: Altruism and Religiosity Revisited. PhD, Lisboa: Instituto Universitário de Lisboa (ISCTE-IUL).
Bekkers, R., & Wiepking, P. (2011). Who gives? A literature review of predictors of charitable giving part one: Religion, education, age and socialisation. Voluntary Sector Review, 2(3), 337-365.
Carmona, T. (2013). Angariação de donativos nas ONGD portuguesas em período de crise (2008-2011). Instituto Universitário de Lisboa (ISCTE-IUL). https://repositorio.iscte-iul.pt/handle/10071/7008. Consultado em 10/10/2014.
CCS. (2014). Angariação de fundos nos Leigos para o Desenvolvimento: contextualização. Conselho Consultivo de Sustentabilidade, Leigos para o Desenvolvimento.
Halo BI. (2013). Advanced Analytics and Business Intelligence. Youtube. http://www.youtube.com/watch?v=oNNk9-tmsZY. Consultado em 15/11/2014.
IBM (2013). IBM SPSS Modeler CRISP-DM Guide. Modeler 16. Armonk, NY: IBM.
Kim, M., Gibson, H., & Ko, Y. J. (2011). Understanding donors to university performing arts programs: who are they and why do they contribute?. Managing Leisure, 16(1), 17–35.
Leigos. (2014). Página web oficial dos Leigos para o Desenvolvimento. http://www.leigos.org. Consultada em 10/10/2014.
Leigos. (2014). Página Facebook dos Leigos para o Desenvolvimento. https://www.facebook.com/leigosparaodesenvolvimento. Consultada em 10/10/2014.
Lee, Y. K., & Chang, C. T. (2007). Who Gives What to Charity ? Characteristics affecting donation behavior. Social Behavior and Persinality, 35(9), 1173–1180.
Oliveira, A., Cronson, R., & Eckel, C. (2011). The giving type: Identifying donors. Journal of Public Economics, 95(5), 428-435.
Sargeant, A., & Jay, E. (2010). Fundraising Management: Analysis, Planning and Practice (2nd Edition). London, UK: Routledge.
Srnka, K. J., Grohs, R., & Eckler, I. (2003). Increasing fundraising efficiency by segmenting donors. Australasian Marketing Journal, 11(1), 70–86.
Webb, D. J., Green, C. L., & Brashear, T. G. (2000). Development and validation of scales to measure attitudes influencing monetary donations to charitable organizations. Journal of the Academy of Marketing, 28, 299–309.
Wiepking, P., & Bekkers, R. (2012). Who gives? A literature review of predictors of charitable giving. Part Two: Gender, family composition and income. Voluntary Sector Review, 3(2), 217–245.