r b e
REVISTA BRASILEIRA DE ECONOMIA DOI 10.5935/0034-7140.20180023ISSN 1806-9134 (online) FUNDAÇÃO GETULIO VARGAS
Grants and Marginal Cost of Public Funding:
Empirical Evidence for Local Governments
in Brazil
Enlinson Mattos* Rafael Cardim† Ricardo Politi‡
Contents
1. Introduction ...479
2. Theoretical background ....481
3. Methodology ...484
4. Result ...488
5. Conclusion ...492
Appendix. ...495
Keywords
Price effect, income effect, transfers, taxes, fiscal federalism JEL Codes
H2, H7, H25
Abstract·Resumo
This paper documents empirical evidence on price-effect caused by lump-sum grants for local governments in Brazil between 2006 to 2010.Dahlby
(2011) demonstrates theoretically that lump-sum grants can reduce the cost of public goods provision (price-effect), in addition to the traditional income effect. Our contributions are threefold. First we estimated semi-elasticity of the effects of tax rate changes on tax base (−0.016). Second, we calculate the MCF of the local tax imposed on the supply of services (ISS) for Brazilian municipalities (average of 0.04). Finally, we estimate the price-effect estimation for ISS tax. Our results suggests that for the entire sample, that an increase in R$ 1.00 in per capita unconditional transfers reduces the local price effect (MCF) around 0.07%, but this result is not consistently estimated across all subsamples.
1. Introduction
An important topic in the Public Finance literature is the discussion about the cost of raising additional resources from private sector to fund public provision. As discussed in the tax burden literature, in a true non-distortionary tax system, tax revenue is distributed directly from the private to the public sector, in such a manner that the income loss for the private sector is equivalent to the income earning for the public sector (Hakonsen,1998). In this scenario, the marginal dead weight loss from taxation is null.
In a different formulation,Dahlby(2011), followingHamilton(1986), approaches tax burden in a model in which local governments are financed by distortive taxes. Under this scenario, the marginal loss caused to society by a tax rate increase is captured by the idea of marginal cost of public fund (MCF). The MCF can be stated as the ratio between the social marginal value of a monetary unit (i.e. $1 Real) raised by the government and its counterpart
*Fundação Getúlio Vargas, Escola de Economia de São Paulo (FGV/EESP). Rua Itapeva, 474, Bela Vista, São Paulo, SP, CEP 01332-000, Brasil.
†Mestre em economia. Fundação Getúlio Vargas, Escola de Economia de São Paulo (FGV/EESP).
‡Universidade Federal do ABC, Centro de Engenharia, Modelagem e Ciencias Sociais Aplicadas (UFABC/SECS). Avenida dos Estados, 5001, Santa Terezinha, Santo André, SP, CEP 09210-580, Brasil.
§[email protected] [email protected] [email protected]
This is an open-access article distributed under the terms of the Creative Commons Attribution License.
Revista Brasileira de Economia Vol. 72, No. 4 (Out–Dez 2018) 479–496 479
in the private sector (the social marginal value of a monetary unit in the private sector). According toJacobs(2018), the MCF is a measure of the scarcity of the public resouces in society.
In fact, the MCF aims to measure the distortion in the allocation of resources in an economy resulting from a response to a non lump-sum tax, such as the labor supply, consumption, and investment decisions. Beyond tax distortion, additional resources from intergovernamental grants can also affect the cost of public funds. In theDahlby’s (2011) model, lump-sum intergovernmental grants have both an income effect, which is widely reported in the “flypaper” literature (Gramlich,1977;Fisher,1982;Wyckoff,1991;Inman, 2008), and a price effect. The mechanism that such price-effect works is via a decrease in the marginal cost of public fund.
This price effect refers to the situation in which additional resources from intergover-namental grants can impact negatively the local cost of public provision, as it allows the local government to decrease the tax rate and still to maintain the same level of public goods. Following this debate, the main objective of this paper is to estimate the price-effect in lump-sum grants using data from 5,173 Brazilian municipalities between 2006 and 2012 (seven years sample). In this article we (i) estimate the effects of tax rate changes on tax base (number of fims); (ii) calculate the MCF of the local business tax imposed on the supply of services for Brazilian municipalities; and (iii) estimate the effect of grants on the estimated MCF.
The fiscal federalism literature has provided considerable attention to the intergovern-mental grants schemes, which are important tools for correcting fiscal imbalances caused by disequilibrium of taxation sources between government levels and by differences in local fiscal need.
Lump-sum grants seem to stimulate more the local public spending than increases in local private income, reinforcing the expression “money sticks where it hits”. The idea is that the revenues raised by the public sector remains in that sector. Hines and Thaler(1995) charactherize as an anomaly the larger propensity of grants to increase public spending compared to private income resources and there seems to have many theoretical explanations for that.1 More related to our work,Hamilton(1986) claims that the flypaper effect might
be due to tax distortion, which is captured by the deadweight loss of taxation (Hakonsen, 1998), as also by the difference between income and grants effects.
This issue is further explored inDahlby(2011) that argues that grants can reduce the cost of taxation for local governments through a change in the MCF. In particular, the author shows that lump-sum grants allow the recipient government to reduce its tax rate, which in turn, decreases the MCF in order to keep the same level of public service. Whether local MCFs are larger than national average counterpart, additional resources from grants could increase consumer welfare. According toBrowning(1987) tax-response can produce very disperse estimates (1% increase of a particular tax can trigger a marginal loss in well-being between 9.9 and 300%).2
1For a detailed survey, seeInman(2008) andGamkhar and Shah(2007). For Brazil,Siqueira, Nogueira, Souza,
and Carvalho(2010) found 0.002 to 2.2 using 27 groups of goods.Lanzer and Porto(2011) estimated the MCF
for the whole Brazilian tax system in between 1.167 and 1.173. See alsoCossio(2002) andCossio and Carvalho (2001).
2RecentlyAuriol and Warlters(2012) estimated a mean MCF of 1.21 for 38 African countries using a general
Mattos et al.: Grants and Marginal Cost of Public Funding: Empirical Evidence for Local Governments in Brazil 481
As discussed inDahlby(2011, p.309), Brazil offers a interesting case to discuss the flypaper effect as also the cost of public fund as the Brazilian system of intergovernmental grants is broad; it accounts for 12% of gross domestic product (GDP) and it corresponds about 70% of local revenue streams in 2008. Thus, it is relevant to use Brazilian data in order to provide empirical evidence of the price-effect of transfers.
Overall, our main results indicate that the tax base (number of firms) reacts negatively to a local tax rate increase. Moreover, we find limited evidence that grants pushes down the marginal cost of public fund. Interestingly, our results suggest that this price effect seems greater for larger cities. We argue that this finding is associated to greater distortionary taxation found in larger municipalities. Considering the entire sample, our estimates suggests that an increase in R$ 1.00 in per capita unconditional transfers reduces the local price effect (MCF) around 0.00003 (0.07% of the average MCF).
In addition to this introduction, this paper is organized in four sections. Section 2 presents a modified version ofDahlby’s (2011) model that allows to compare the price effect of grants to the price effect of income. Additionally,section 3describes the empirical approach and the data used. Section 4discusses our main findings. Finally,section 5 concludes the paper.
2. Theoretical background
2.1 Marginal Cost od Public Finance (MCF) Model
In this section, in order to develop an empirical approach to obtain the price effect of unconditional grants, we exploreDahlby’s (2011) model of Marginal Cost of Public Funds (MCF). First, we assume that all local governments have a homogeneous, fixed population that may be represented by a single agent. The local government is in charge of choosing a tax rate𝜏that affects the tax base,𝐵, and the amount of public services provided,𝑔, at a constant production cost per capita𝑐. The local government receives a lump-sum transfer
𝑇. Therefore, the government’s budget constraint follows𝜏𝐵 + 𝑇 = 𝑐𝑔.
The utility of the representative resident is𝑈 = 𝑢(𝑥, 𝐵) + 𝑤(𝑔), where𝑥is the private consumption of goods (price equal to1),𝑢(⋅) is a quasi-concave function,𝑤′ > 0, and 𝑤″ < 0. In our case, the tax base (𝐵) depends only on the local tax rate,𝜏. Thus, it follows
𝐵 = 𝐵(𝜏).Dahlby(2011, equation (1), p.307) derives MCF as
MCF𝜏𝑖= 𝐵d𝑅𝑖 d𝜏𝑖
= 𝐵𝑖
𝐵𝑖+ 𝜏𝑖d𝐵𝑖
d𝜏𝑖
= 1 + 𝜏1
𝑖𝜂, (1)
where𝜂 = 𝜕ln𝜕𝜏𝐵 < 0is the elasticity of the tax base with respect to the tax rate and𝑅stands for local tax revenue. Because of tax avoidance by firms, it is expected a negative association (elasticity) between the tax base and the tax rate, captured by the term 𝜂. Equation (1) indicates that the MCF is a measurement that reflects the cost of a tax rate increase in terms of tax revenue, or equivalently, how much it costs to obtain an additional R$ 1 in terms of tax revenue. For example, if the tax base is not affected by the increase in tax rate (i.e.,𝜂 = 0), then an increase in the tax rate reflects the same measurement in tax revenue. However, it is expected that the tax base shrinks with a tax rate increase (as we expect that 𝜂 < 0), which leads to MCF greater than one (MCF> 1).3
3Furthermore, the municipalities are assumed to be in the increasing segment of the Laffer Curve, i.e.,1+𝜏
Assuming that local government intends to maximize the well-being of the residents, the provision of public goods goes up to the point at which the marginal benefit of public goods equals the effective price,𝑃; e.g.,𝑃 ≡MCF⋅ 𝑐, where𝑐is the constant cost of provision of the public good per capita. If this government receives a lump-sum grants,𝑇from the central government, the provision of public goods could increase and the tax rate might decrease. Then, the MCF decreases because tax rate has decreased, which in turn, allows for a reduction in the effective price of providing the public good. Deriving the effective price in relation to𝑇and keeping𝑔constant (𝜕𝜏𝑖
𝜕𝑇 = −𝐵−1MCF), the effect of an increase in
grants to the relative price effect to may be expressed as
𝜕𝑃
𝜕𝑇 = 𝜕𝑃𝜕𝜏 𝜕𝑇 =𝜕𝜏 (1 + 𝜏𝜂)𝑐𝜂 31 + 𝐸𝐵 , (2)
where𝐸 = (d𝜂𝑖
d𝜏𝑖)(𝜏𝜂𝑖𝑖), which corresponds to the change of the elasticity of the tax base in relation to the tax rate. If the local government is financed with lump-sum taxes we have
MCF = 1. If𝐸 = −1, then there would be no price effect for lump-sum grants. Supposing thatMCF> 1and𝐸 > −1, a lump-sum grant presents a greater price effect compared to the ratio between the lump-sum grant over the local tax revenue, as well as that of the local MCF.
To find the expression that reflects the relationship between those two forms of variation in the price-effect (grants and income), we first have to completely differentiate the budget constraint, while keeping𝑔constant, then one has to derive𝑃with respect to𝑌and to𝜏. After some algebra, one can find the price effect of income as indicated in function
𝜕𝑃
𝜕𝑌 = (1 + 𝜏𝜂)𝑐𝜂 31 + 𝐸𝐵 𝐵𝑦𝜏. (3)
Function (3) represents the change in the price of the public good resulting from the variation in income.4 Comparing the price-effects of income (3) to its counterpart of the
grants’ function (2), we have:
𝜕𝑃
𝜕𝑇 = (1 + 𝜏𝜂)𝑐𝜂 31 + 𝐸𝐵 = 𝜕𝑌𝜕𝑃𝜏𝐵1𝑦. (4)
Equation (4) shows that if1 > 𝜏𝐵𝑦> 0, one has 𝜕𝑃𝜕𝜏 > 𝜕𝑌𝜕𝑃. This means that
intergovern-mental grants have a greater ability compared income to decrease the effective price of the public good. Thus, we should expect a negative relantionship between grants and MCF. To summarize, in our empirical approach, we investigate two main hyphothesis derived from our analytical framework: i) if the the association between tax rate and tax base is negative or not; ii) if the effect of grants in MCF is also negative and its magnitude. Next, we related the MCF model with Brazilian institutional framework.
4For example, if we consider𝑐 = 1,𝐸 = 0(i.e., there is no variation in the elasticity of the tax base),𝐵 = 100,
Mattos et al.: Grants and Marginal Cost of Public Funding: Empirical Evidence for Local Governments in Brazil 483
2.2 Local tax revenues and unconditional transfers in Brazil
Regarding local tax revenues, the tax on business services (ISS) is the main source of public funding. This tax is collect over services acivities (excluding any type of manufactured activity) as small retail stores, hairdressers, repair services, restaurants, financial and educa-tional services. The statutory business tax rate ranges from 2% to 5%.5Some sectors are tax
exempt. Additionally, municipalities also obtain resources from local property tax (IPTU, in Portuguese). However, statutory tax rate in property tax in Brazil are historically low. In fact, average tax rate is less than 2% and most households live in areas or houses that are tax free.6According toCarvalho(2006), only 30% of the households collect property
tax and property tax revenues represents only approximatelly 0.5% from Gross Domestic Product (GDP). In our sample, the local business tax revenues represent on average twice the revenue collected in local property tax. Thus, it is appropriate to consider the business tax as the main source of local tax revenue and source of potential distortionary taxation.
Regarding intergovernamental grants, municipalities obtain resources from States and from the Federation. Each State return approximatelly from 20% to 25% of the Valeu Added Tax (VAT) and of the Vehicle Tax revenue to the locality where the tax was collected.7
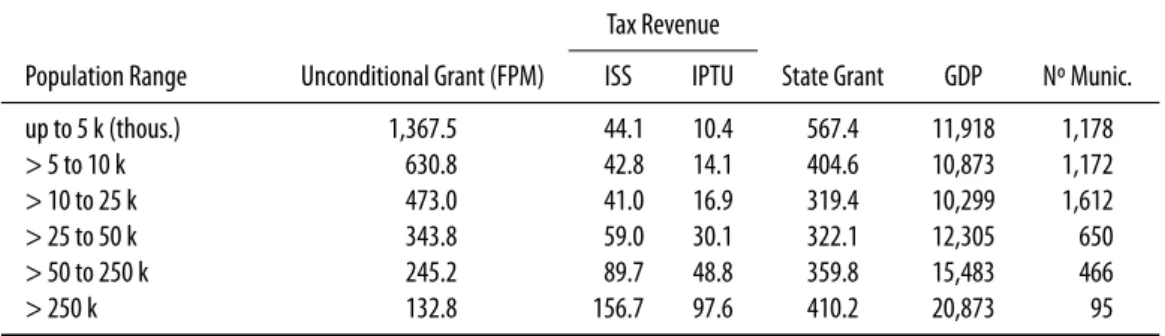
However, it is noteworthy to clarify that the main source of revenues for local governments in Brazil are unconditional grants. Table 1shows that meanwhile intergovernmental grants from the Municipalities Participation Fund (FPM, in Portuguese) accounts for on average 60% of total revenue resources, local tax revenue corresponds on average to only 20% of fiscal resources for municipal jurisdictions. Because of this large share in municipalities’ budgets, it is important to comprehend the effect of unconditional grants on the MCF.
Finally, it is important to remind that very small firms in Brazil collect tax in a differenti-ated regime. In the “Simples Nacional” tax regime, firms collect local, State and National tax
Table 1.Fiscal variables by populational ranges – per capita in 2010 R$.
Tax Revenue
Population Range Unconditional Grant (FPM) ISS IPTU State Grant GDP Nº Munic.
up to 5 k (thous.) 1,367.5 44.1 10.4 567.4 11,918 1,178
> 5 to 10 k 630.8 42.8 14.1 404.6 10,873 1,172
> 10 to 25 k 473.0 41.0 16.9 319.4 10,299 1,612
> 25 to 50 k 343.8 59.0 30.1 322.1 12,305 650
> 50 to 250 k 245.2 89.7 48.8 359.8 15,483 466
> 250 k 132.8 156.7 97.6 410.2 20,873 95
Note:Number of observations is 36,211.
5It follows Lei Complementar 116/2003 and Emenda Constitucional 37/2002.
6SeeCarvalho(2006) for a comprehensive discussion in Portuguese.
7There are two other additional types of intergovernmental transfers: Federal Support for Education Fund
in a unified way.8 The implication of this tax regime for this paper is that is that a share of the
business tax revenue, mostly in small cities, is collect in this special tax regime. On average, around 33% of the tax collect in the “Simples” regime was redistributed to municipalities as local business tax. In our methodological approach, we try to circumvent this issue including a variable to control for fiscal capacity (seesection 3.3). It is important to note that the “Simples” has reached more economic activities and firms after 2014 (as a consequence of Lei Complementar 147/2014), and because of that our sample should be less affected by this tax regime.
An important characteristic of FPM transfers is that it follows exogenous criteria based on populations cutoffs. Excluding the 27 State capitals and some large cities, munici-palities which follows different distributive rules (based on both population and income inverse rules), municipalities with less than 142 thousands inhabitants receive FPM different amounts based only on populational ranges. Those ranges are onTable A-1inAppendix. What makes this interesting for our methodological approach is that it allow us to explore this legal framework in a regression discontinuity design9as discussed in further detail in
the next section.
3. Methodology
3.1 Empirical strategyAs discussed byDahlby(2008), there are several methodologies to calculate the MCF. The method we follow consists of estimating the sensitivity of the tax base in relation to the tax rate as in equation (1).10 Thus, the parameter of interest is the sensivity of the tax base to tax
rates as depicted in function (5):
log𝐵𝑖,𝑡= 𝛼𝑖+ 𝜂𝜏𝑖𝑡+ 𝜋𝑋𝑖𝑡+dtime𝑡+municipalities+ 𝜉𝑖, (5)
where𝐵𝑖,𝑡 is the tax base of municipality𝑖at time𝑡;𝜏corresponds to the tax rate;𝜉is a
vector of control variables; anddtimeare time dummies. Therefore, the coefficient of the tax rate in this regression is the semi-elasticity of the tax base in relation to the tax rate (𝜂). From our analytical discussion insection 2, we expect a negative coefficient for𝜂as a tax rate increase should present a negative effect on tax base.
The next step is to identify whether the increase in grants and income acts to reduce the municipal MCF according to the equation below:
MCF𝑖𝑡= 𝛼𝑖+ 𝛽grants𝑖𝑡+ 𝛾𝑌𝑖𝑡+ 𝜌𝑋𝑖𝑡+dtime𝑡+municipalities+ 𝑢𝑖𝑡, (6) whereMCF𝑖𝑡 corresponds to MCF of municipality 𝑖 at time 𝑇; grants𝑖𝑡 is the transfers received by the municipalities; 𝑌captures exogenous income; and𝑋 includes the same vector of control variables used in equation (5). Regarding our empirical approach, since
8It follows Lei Complementar number 123/06 and Lei Complementar 155 (2016). For example, in year 2010
firms were shared in 20 different groups according their total revenue. Statutory tax rate varied from 4.5% to 16.85%.
9We should note that this fact has being previously explored by andBrollo and Nannicini(2012) in a regression
discontinuity design (RDD).
10There is a large literature on the determination of the response of the tax base in relation to a tax variation.
Gruber and Saez(2002) perform this estimation for the USA, andMintz and Smart(2004) do so for Canada.
Mattos et al.: Grants and Marginal Cost of Public Funding: Empirical Evidence for Local Governments in Brazil 485
we have obtained the MCF from equation (5) we should calculate standard errors using bootstrapping technique.
According to public finance literature, we should expect that municipalities decisions over local tax rate (tax revenue) and revenues on intergovernamentals grants are jointly determined which might bias the estiation of equation (6). For this reason, Ordinary Least Squares (OLS) regression would produce inconsistent and biased coefficient estimates. In order to obtain valid estimates of MCF, we explore the fact that the FPM grants follow popu-lationonal ranges and build binary variables based on FPM populational cutoffs. Thus, to estimate the effect of the grants on the municipalities’s MCF, we use a regression discontinuity design approach.
3.2 FPM thresholds
The most important transfer to Brazilian Municipalities is called the Municipalities’ Partici-pation Fund (Fundo de Participação dos Municípios, FPM). It is a mandatory, unconditional, nonmatching, revenue-sharing grant. According to Law nº 5.172/1966, out of the total amount of FPM transfers, 10% belongs to the capitals, 86.4% belongs to the municipal-ities of the countryside, and the remaining 3.6% constitutes the Reserve Fund, which is distributed among countryside municipalities with more than 142,633 inhabitants (Decree Law nº 1.881/1981 and Complementary Law nº 91/1997, art. 3).
Because the amount that must be allocated to each municipality is clearly established, FPM transfers are transparent and can be separated from political pressure. Furthermore, local governments have autonomy in spending those transfers.11 On one hand, such
autonomy is desirable because the municipality can allocate the transferred resources according to local needs and preferences, which they are in a better position to understand. On the other hand, this autonomy can lead to diminished returns to scale in spending and less tax effort. The Brazilian Census measures the official number of inhabitants in any particular municipality every ten years, and Instituto Brasileiro de Geografia e Estatistica (IBGE) provides annual estimates of local populations between census years. The central government then uses these estimates to distribute FPM funds to municipalities. We explore the yearly fluctuation of local populations across thresholds to quantify the causal effects of government spending on economic activity.
One important aspect of government expenditures and budget resources is that they can be simultaneously determined (Dahlberg, Mörk, Rattsø, & Ågren,2008). To circumvent this issue, the empirical approach reconciles two exogenous aspects of categorical and block grants using a two-stage least squares (TSLS) method. Regarding block grants, the distribution rules based on the population threshold can used as IV in the first-stage regression.
More specifically, the method uses a regression discontinuity strategy in which each population cut-off is used to build a binary variable that denotes the unconditional transfer range. This allows us to build 17 variables to use as instruments in the first-stage regression, as follows: 𝐷𝑖= 1ifPopulation𝑖>Cutoff𝑟 at each cutoff𝑟and municipality𝑖.
11Although Litschig and Morrison(2013) shows that the population measure could be manipulated by
municipalities in the 1990s, such manipulation has not been observed since 2000, when the federal governments started to use census data and IBGE estimates for the population. See alsoBrollo, Nannicini,
As discussed byLitschig and Morrison(2013), there is no reason to believe that sorting around cut-offs (manipulations of the true size of the population, creation of new munici-palities above the cut-offs or incentive effects to migrate) affects the identification strategy. Thus, TSLS estimations use selected cut-offs as excluded instruments to obtain consistent estimates of the causal effect of grants on per pupil spending (Van der Klaauw,2002).
Equation (7) provides the first-stage regression for a IV approach in which FPM grants are treated as an endogenous regressor. It uses the population dummies (17 population dummies𝑍) as valid instruments for the unconditional grant. All other variables are used as valid instruments for themselves:
FPM𝑖𝑡= 𝛼0+ 𝛽1𝑍1+ 𝛽2𝑍2+ ⋯ + 𝛽17𝑍17+ 𝜌𝑋𝑖𝑡+dtime𝑡+municipalities𝑖+ 𝑢𝑖𝑡, (7)
whereFPM is instrumented by the population dummies (𝑍); all other controls (𝑋), time effects;municipalities, fixed effects; and𝑢𝑖𝑡is an error term clustered at the municipality level.
The causal effect that we are identifying is local for two reasons: first, the RDD identifies the effect only to observations around the thresholds; and second, the to compliers (that is, municipalities that received larger transfers because of the exogenous FPM revenue-sharing mechanism). However, the identification of compliers neglects a subpopulation that may also be of interest: the always-takers, or municipalities that receive larger transfers independently of their position above or below each population threshold.
Next we run this instrumented FPM on the computed MCF to identify the price effect and equation (6) would modify to:
MCF𝑖𝑡= 𝛼0+ 𝛿1FPM̂1+ ⋯ + 𝛿17FPM̂17+ 𝜌𝑋𝑖𝑡+dtime𝑡+municipalities𝑖+ 𝑣𝑖𝑡
We should note that this formulation of the MCF relies on the following hypotheses: i) changes in ISS rates produce very small effect over IPTU tax revenues; ii) each municipality’s ISS tax burden is supported only by the its own; iii) there is no interaction between the tax bases—which makes sense for services in small municipalities; iv) the elasticity of the tax base may be the same in all of the local governments.
3.3 Data
Regarding local tax and revenue information, we note that annual data is available in a systematic way until year 2012 from Brazilian Treasury (Secretaria do Tesouro Nacional, STN). Data on number of service firms (which compound ISS tax base), and their number of employes and firms’s payroll total costs is available in the Brazilian Bureau of Geography and Statistics’ reports on Services Firms Census (Cadastro Central de Empresas) from 2006 to 2015.12 Considering the time period availability of both datasets, our sample includes
data for 5,173 (from a total of 5,565) municipalities in Brazil from year 2006 to 2012 (seven years period). We also collect data on demographic variables as describedTable 2.13 We
note that all monetary variables are deflated to year 2010 in Brazilian currency (R$ Reais) values.
12Availabe athttps://sidra.ibge.gov.br/pesquisa/cempre/tabelas/brasil/2015as in January 2018.
13Datasus data is available athttp://www2.datasus.gov.br/DATASUS/index.php?area=0206and HDI athttp://
Ma
tt
os
et
al.
:G
ran
ts
an
d
M
arg
ina
lCos
to
fP
ub
lic
Fu
nd
ing:
Em
pir
ica
lE
vide
nce
for
Loc
al
Go
ver
nm
en
ts
in
Brazil
487
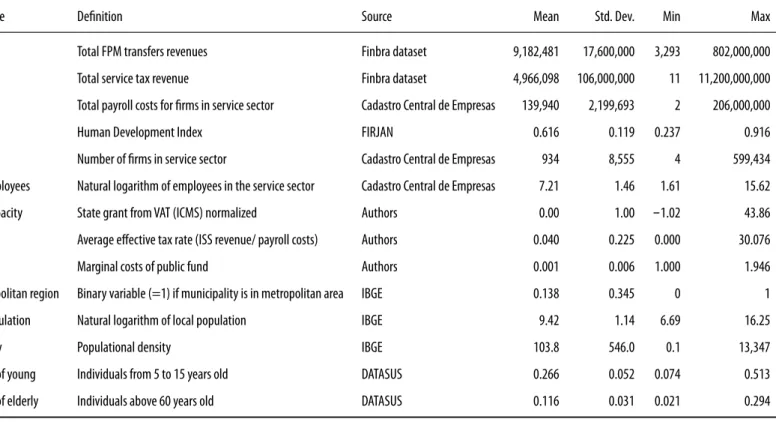
Table 2.Descriptive statistics of observable variables from municipalities – from 2006 to 2012, in R$, year 2010.
Variable Definition Source Mean Std. Dev. Min Max
FPM Total FPM transfers revenues Finbra dataset 9,182,481 17,600,000 3,293 802,000,000
ISS Total service tax revenue Finbra dataset 4,966,098 106,000,000 11 11,200,000,000
Payroll Total payroll costs for firms in service sector Cadastro Central de Empresas 139,940 2,199,693 2 206,000,000
HDI Human Development Index FIRJAN 0.616 0.119 0.237 0.916
Firms Number of firms in service sector Cadastro Central de Empresas 934 8,555 4 599,434
Ln Employees Natural logarithm of employees in the service sector Cadastro Central de Empresas 7.21 1.46 1.61 15.62
Tax capacity State grant from VAT (ICMS) normalized Authors 0.00 1.00 -1.02 43.86
AETR Average effective tax rate (ISS revenue/ payroll costs) Authors 0.040 0.225 0.000 30.076
MCF Marginal costs of public fund Authors 0.001 0.006 1.000 1.946
Metropolitan region Binary variable (=1) if municipality is in metropolitan area IBGE 0.138 0.345 0 1
Ln Population Natural logarithm of local population IBGE 9.42 1.14 6.69 16.25
Density Populational density IBGE 103.8 546.0 0.1 13,347
Share of young Individuals from 5 to 15 years old DATASUS 0.266 0.052 0.074 0.513
Share of elderly Individuals above 60 years old DATASUS 0.116 0.031 0.021 0.294
As previously debated by several authors (seeHakonsen(1998) for a discussion), one of the main limitations of the applied literature is to identify a feasible measure of tax base for local tax to properly approach the marginal cost of public funds. One reasonable measure of firms tax burden would be the local business tax (ISS). However, there is not systematic data available for ISS tax rates across municipalities. Differently, we have information available about the payroll expenses (firms expenses with employee earnings) by municipality. Based on this information, we build a measure of effective average tax rate (AETR) as suggested byHayashi and Boadway(2001). Thus, instead of using statutory tax rates, our measure of AETR follows the ratio between ISS tax revenues and annual payroll of firms services under the municipalities in the analysis. The idea is that in the service sector, firms’ revenue is strongly correlated to firms’ labor spending or to payroll spending. The main advantage of using a AETR approach is that it is less rigid than statutory tax rate and provides more variation in time and across units. Additionally, it should capture better the effect of tax rate changes on number of firms and firms revenues.
Finally, following previous work on tax competition literature, we include a covariate to control for fiscal capacity. We build a measure of relative fiscal capacity based on the amount each municipality obtains from Value Added Tax (ICMS,14in Portuguese). We
explore the conception that fiscal capacity is positively associated to VAT collection at the municipal level (see alsosection 2). We normalize the revenues originated from this devolutive grant to obtain a national average of zero. The idea is that if a municipality present a VAT refund revenue above (below) the national average it should present a higher (lower) fiscal capacity compared to their counterparts. This covariate should account for local fiscal capacity as also should minimize a potential measurement error in AETR in smaller cities, originated from the “Simples Nacional” tax regime. It should also account for informality in the municiplaities. Next Section brings our main findings.
4. Result
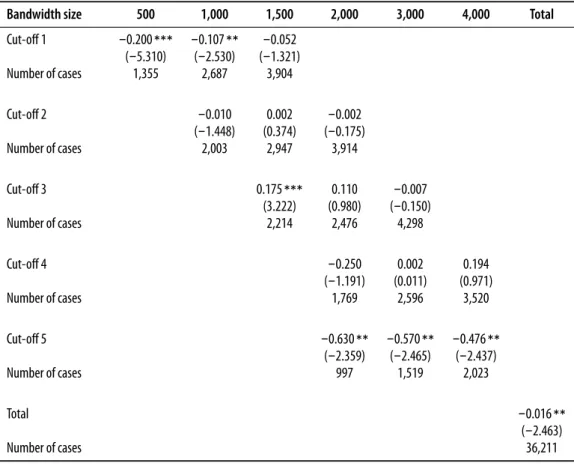
4.1 Tax baseWe first estimate the tax base elasticity as described in equation (5). We consider as measure of tax base the natural logarithm of the number of firms in the service sector. As discussed in section 2, it is expected a negative correlation between the average effective tax rate (AETR) and the tax base (𝜂 < 0).Table 3brings the results for the RDD approach for 5 cutoffs with three different bandwhidth ranges and for the total of observations in our sample. We note that after the 5thcutoff the number of cases around the cutoff is small. RDD approach would be possible only with very large bandwidths. All regressions include demographic variables (population, squared population, population density, share of younger and share of elderly, and a binary variable indicating if the municipality is in a metropolitan region or not) as covariates.
Overall, as expected, results onTable 3shows that a tax rate increase has a negative effect on the number of firms in the municipalties. In column I, results in RDD on the first cutoff indicate that an one standard deviation increase in average tax rate reduces in 4.5% (0.2×0.225×100) the number of service firms. Interestingly, results inTable 3 suggests that the negative effect is neither homogenous nor linear around the different cutoffs. Estimated coeffcients suggests that the results are negative and significant for the smaller (first
Mattos et al.: Grants and Marginal Cost of Public Funding: Empirical Evidence for Local Governments in Brazil 489
Table 3.Regression on tax base elasticity. Dependent variable: Ln of number of firms.
Bandwidth size 500 1,000 1,500 2,000 3,000 4,000 Total
Cut-off 1 -0.200∗∗∗ -0.107∗∗ -0.052
(-5.310) (-2.530) (-1.321)
Number of cases 1,355 2,687 3,904
Cut-off 2 -0.010 0.002 -0.002
(-1.448) (0.374) (-0.175)
Number of cases 2,003 2,947 3,914
Cut-off 3 0.175∗∗∗ 0.110 -0.007
(3.222) (0.980) (-0.150)
Number of cases 2,214 2,476 4,298
Cut-off 4 -0.250 0.002 0.194
(-1.191) (0.011) (0.971)
Number of cases 1,769 2,596 3,520
Cut-off 5 -0.630∗∗ -0.570∗∗ -0.476∗∗
(-2.359) (-2.465) (-2.437)
Number of cases 997 1,519 2,023
Total -0.016∗∗
(-2.463)
Number of cases 36,211
Notes:All regressions include fixed effect and time effects. In parentheses are robust𝑡statistics. ∗∗∗𝑝 < 0.01,∗∗𝑝 < 0.05,
∗𝑝 <0.1.
cutoff) and larger (fifth cutoff) municipalities in our sample. Those cutoffs corresponds to municipalities with approximatelly 10 and 30 thousand inhabitants, respectively. Differently, coefficients in cutoff 3 and 4 suggest (municipalities with approximately 16 and 23 thousand inhabitants, respectively) that a tax rate increase present a positive on the number of firms in those jurisdictions (although this positive effect is significant only in one out of fifteen regression).
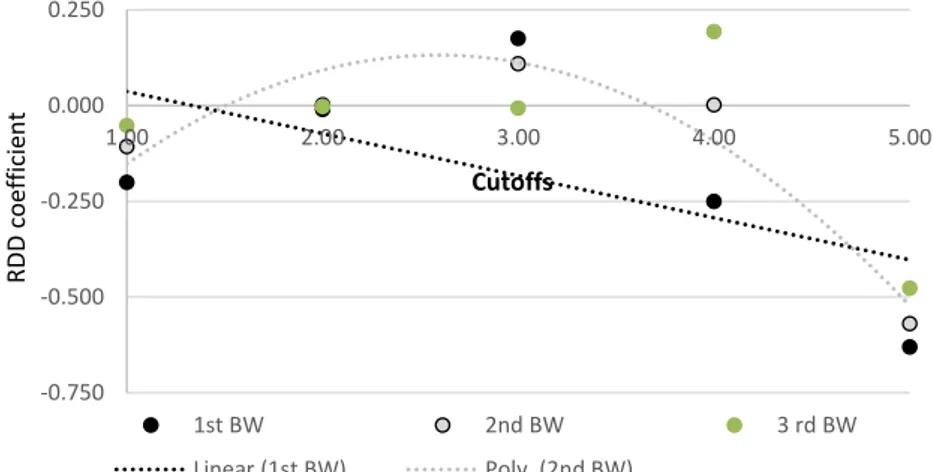
This trend is depicted inFigure 1which brings the scatter plot between tax rate and the logarithm of the number of firms for three different bandwidth ranges for the five cutoffs as inTable 3. If someone depicts a linear trend line, she will note that the effect on tax base is negative as expected. Contrastingly, if someone depicts a polynomial trend line, she will obtain an inverted U shape relationship. Importantly, results suggest that, after the 2ndcutoff, the negative tax rate effect on tax base increases as municiplaities gets larger. One possible explanation for those findings is that the most populated municipalities presents the largest firms which are more affected by a tax rate increase. On the other hand, as developed by Carbonnier(2008), the effect of tax competition can be greater for smaller jurisdictions with less fixed factor, as land for example. The idea is that very small jurisdictions can be more affected by tax rate spill-over if the externality is driven by a fixed factor.
-0.750 -0.500 -0.250 0.000 0.250
1.00 2.00 3.00 4.00 5.00
RDD
coef
fi
ci
e
n
t
Cutoffs
1st BW 2nd BW 3 rd BW
Linear (1st BW) Poly. (2nd BW)
Figure 1.Tax Rate Effect on Tax Base.
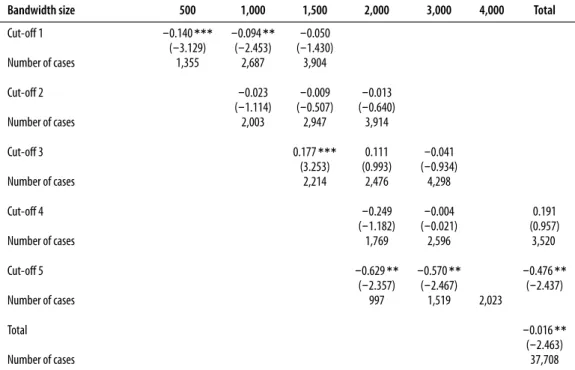
the results in smaller municipalities could be biased because of this tax regime, we include in all regresions a covariate to control for tax capacity. Interestingly, if someone compare the results of the RDD regression with and without this variable (Table 3andTable A-2in Appendix, respectivelly), she will note that the inclusion of this variable leads to similar coefficient in most regressions but to a greater coefficient in the first cutoff. This result suggests that our measure of tax rate could not capture all the effects of tax rate on tax base because of this differentiated tax regime. However, this limitation seems circumnscrit to the smallest municiplaities (1stcutoff) in our sample, since the estimated coefficient over the other cutoffs are similar with or without this covariate.
Finally, we also report results for a standard panel fixed effect model. We note that regression on our total sample (column VI) seems to reflect the relantionship between tax rate and number of firms in the smaller and greater municipalities, and the estimated coefficient on the tax rate indicates that one standard deviation increase in tax rate reduces 0.36% the number of firms in the municipality. It is important to remind that, as discussed insection 2, we use the estimated coefficient of tax rate on tax base to build our measure of Marginal Cost of Fund (MCF) as described in function (1). In the next section, we discuss the results over this dependent variable.
4.2 MCF’s Price-effect
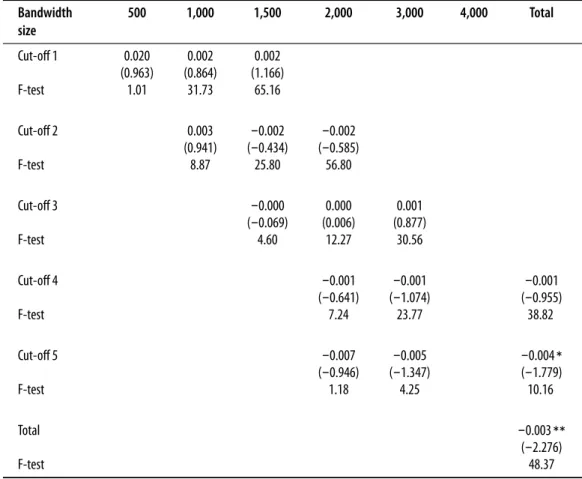
In this section we estimate the unconditional grants price effect on the MCF using our model described insection 2. We expect that FPM grants present a negative effect on the MCF since this should reduce the price of public provision as discussed inDahlby(2011).Table 4 brings the results for our RDD approach around the same five cutoffs as inTable 3and for two stage least squares instrumental variable (2SLS-IV) with bootstrapping standard errors (last columnTable 4). We note that, as inTable 3, all regressions control for demographic variables as also for Human Development Index (HDI) indicator, and fixed and time effects.
Mattos et al.: Grants and Marginal Cost of Public Funding: Empirical Evidence for Local Governments in Brazil 491
Table 4.Regression on tax price effect. Dependent variable: Ln of number of firms. Dependent variable: Marginal Cost of Public Fund (MCF).
Bandwidth size
500 1,000 1,500 2,000 3,000 4,000 Total
Cut-off 1 0.020 0.002 0.002
(0.963) (0.864) (1.166)
F-test 1.01 31.73 65.16
Cut-off 2 0.003 -0.002 -0.002
(0.941) (-0.434) (-0.585)
F-test 8.87 25.80 56.80
Cut-off 3 -0.000 0.000 0.001
(-0.069) (0.006) (0.877)
F-test 4.60 12.27 30.56
Cut-off 4 -0.001 -0.001 -0.001
(-0.641) (-1.074) (-0.955)
F-test 7.24 23.77 38.82
Cut-off 5 -0.007 -0.005 -0.004∗
(-0.946) (-1.347) (-1.779)
F-test 1.18 4.25 10.16
Total -0.003∗∗
(-2.276)
F-test 48.37
Notes:All regressions include fixed effect and time effects. In parentheses are robust bootstrapped𝑡statistics.∗∗∗𝑝 <0.01,∗∗𝑝 < 0.05,∗𝑝 <0.1.
last column (total)15inTable 4indicates that each R$ 1 increase in unconditional grants
is associated with a reduction in the cost of public fund about 0.003 (1% of its standard deviation).
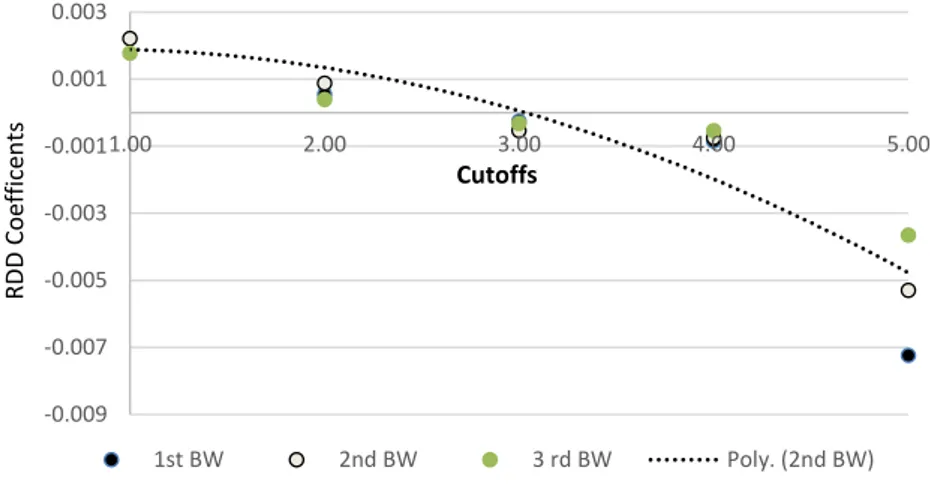
To examine if the effect of grants on MCF presents some trend, we plot a graph with the five cutoff and the three different bandwidths. Interestingly,Figure 2suggests that, although not very large, the negative effects of grants on MCF increases the larger is the municipality. This seems a counter-intuitive result, since small communities tend to present higher marginal cost of public fund and they should present a stronger reaction to additional grants resources (Buettner & Fabritz,2011).
However, there two possible explanations for our results inTable 4. First, the negative effect of tax rate increase on tax base could be greater in larger cities (Buettner & Holm-Hadulla,2008), as we have previously observed in the results inTable 3. Second, grants effects on MCF tend to be larger in recipients communities with a large distortionary taxation. For example, using data for Argentinian Provinces. Vegh and Vuletin(2015) show that the
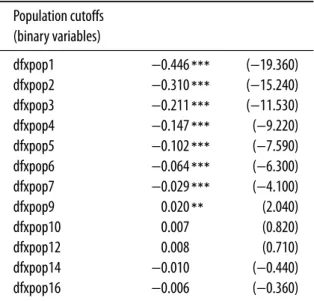
15Table A-3in Appendix brings the coefficents for the first stage regression and it shows that all binary variables
-0.009 -0.007 -0.005 -0.003 -0.001 0.001 0.003
1.00 2.00 3.00 4.00 5.00
RDD
Coe
ff
ice
n
ts
Cutoffs
1st BW 2nd BW 3 rd BW Poly. (2nd BW)
Figure 2.Grant Effect on MCF.
flypaper effect (and the stimulative effect of grants on public spending) is larger in localities with tax rate above the national average. In our sample although the average tax rate (AETR) is similar accross municipalites, larger municipalities tend to host larger firms, in terms of number of employees and total revenues (seeFigure A-1inAppendix).
Thus, overall, our results reflects most of the public funding scheme in Brazil, where public provision in smaller cities are financed mostly by grants (this resource accounts for 80% of total public resources) and in larger cities mostly by local taxes. Results in total sample could be capturing this higher price effect of grants on municipalities that present higher distortionary taxation over business services.
5. Conclusion
This paper investigates the effect of unconditional grants on the Marginal Cost of Public Funding (MCF) using Brazilian local governments data. In particular, we explore the model proposed in Dahlby(2011), to design a theoretical extension that shows the difference between the price effect resulting from grants and from income attempt to show how these different methods of increasing income change the effective price of public goods.
Using data from Brazilian national Treasury for the years 2006 to 2012 we construct average effective ISS local taxes and unconditional (FPM – the recipient government has complete freedom to decide on the allocation of the resources) transfers to estimate such difference.
We first estimate the effect of tax rates on tax basis in order to construct MCF estimations. That estimated semi-elasticity (−0.016) is used to calculate the MCF, representing the price of the public good for each municipality.
Mattos et al.: Grants and Marginal Cost of Public Funding: Empirical Evidence for Local Governments in Brazil 493
References
Auriol, E., & Warlters, M. (2012). The marginal cost of public funds and tax reform in Africa.
Journal of Development Economics,97(1), 58–72.
http://dx.doi.org/10.1016/j.jdeveco.2011.01.003
Brollo, F., & Nannicini, T. (2012). Tying your enemy’s hands in close races: The politics of federal transfers in Brazil.American Political Science Review,106(4), 742–761.
http://dx.doi.org/10.1017/S0003055412000433
Brollo, F., Nannicini, T., Perotti, R., & Tabellini, G. (2013). The political resource curse. American
Economic Review,103(5), 1759–1796. http://dx.doi.org/10.1257/aer.103.5.1759
Browning, E. K. (1987). On the marginal welfare cost of taxation. The American Economic Review,
77(1), 11–23.https://www.jstor.org/stable/1806725
Buettner, T., & Fabritz, N. (2011, June 30). Responses to grants and the marginal cost of public funds. InIV Workshop on Fiscal Federalism, Barcelona.
Buettner, T., & Holm-Hadulla, F. (2008, November). Cities in fiscal equalization(CESifo Working Paper No. 2447). Munich, Germany: CESifo Group. http://www.cesifo-group.de/ifoHome/ publications/docbase/DocBase_Content/WP/WP-CESifo_Working_Papers/wp-cesifo-2008/ wp-cesifo-2008-11/12012008002447.html
Carbonnier, C. (2008, February). Fiscal competition between decentralized jurisdictions,
theoreti-cal and empiritheoreti-cal evidence(Documents de travail No. 2008-17). Cergy-Pontoise: THEMA –
Université de Cergy-Pontoise.http://thema.u-cergy.fr/IMG/documents/2008-17.pdf
Carvalho, P. H. B. d., Jr. (2006, December). IPTU no Brasil: Progressividade, arrecadação
e aspectos extra-fiscais (Texto para Discussão No. 1251). Brasília, DF: Instituto de
Pesquisa Econômica Aplicada (IPEA).http://www.ipea.gov.br/portal/index.php?option=com _content&view=article&id=4814
Cossio, F. A. B. (2002). Ensaios sobre federalismo fiscal no Brasil(PhD Thesis, PUC-Rio, Rio de Janeiro). http://dx.doi.org/10.17771/PUCRio.acad.3712
Cossio, F. A. B., & Carvalho, L. M. d. (2001). Os efeitos expansivos das transferências intergover-namentais e transbordamentos espaciais de despesas públicas: Evidências para os municípios brasileiros – 1996.Pesquisa e Planejamento Econômico,31(1), 75–124.http://ppe.ipea.gov.br/ index.php/ppe/article/view/161
Dahlberg, M., Mörk, E., Rattsø, J., & Ågren, H. (2008). Using a discontinuous grant rule to identify the effect of grants on local taxes and spending.Journal of Public Economics,92(12), 2320–2335. http://dx.doi.org/10.1016/j.jpubeco.2007.05.004
Dahlby, B. (2008). The marginal cost of public funds: Theory and applications. Cambridge, MA: MIT Press.
Dahlby, B. (2011). The marginal cost of public funds and flypaper effect. International Tax and
Public Finance,18(3), 304–321. http://dx.doi.org/10.1007/s10797-010-9160-x
Ferraz, C., & Finan, F. (2011). Electoral accountability and corruption: Evidence from the audits of local governments.American Economic Review,101(4), 1274–1311.
http://dx.doi.org/10.1257/aer.101.4.1274
Fisher, R. C. (1982). Income and grants effects on local expenditure: The flypaper effect and other difficulties.Journal of Public Economics,17(3), 324–345.
Gamkhar, S., & Shah, A. (2007). The impact of intergovernmental transfers: A synthesis of the conceptual and empirical literature. In R. Boadway & A. Shah (Eds.),Intergovernmental
fiscal transfers: Principles and practice(pp. 225–258). Washington, DC: World Bank. http://
hdl.handle.net/10986/7171
Gramlich, E. (1977). Intergovernmental grants: A review of the empirical literature. In W. E. Oates (Ed.),The political economy of fiscal federalism. Lexington Press.
Gruber, J., & Saez, E. (2002). The elasticity of taxable income: Evidence and implications. Journal
of Public Economics,84(1), 1–32. http://dx.doi.org/10.1016/S0047-2727(01)00085-8
Hakonsen, L. (1998). An investigation into alternative representations of the marginal cost of public funds.International Tax and Public Finance,5(3), 329–343.
http://dx.doi.org/10.1023/A:1008686227749
Hamilton, J. H. (1986). The flypaper effect and the deadweight loss from taxation.Journal of Urban
Economics,19(2), 148–155. http://dx.doi.org/10.1016/0094-1190(86)90036-7
Hayashi, M., & Boadway, R. (2001). An empirical analysis of intergovernmental tax interaction: The case of business income taxes in Canada. Canadian Journal of Economics,34(2), 481–503. http://dx.doi.org/10.1111/0008-4085.00085
Hines, J. R., & Thaler, R. H. (1995). The flypaper effect. Journal of Economic Perspectives,9(4), 217–226. http://dx.doi.org/10.1257/jep.9.4.217
Inman, R. P. (2008, December). The flypaper effect(Working Paper No. 14579). National Bureau of Economic Research (NBER). http://dx.doi.org/10.3386/w14579
Jacobs, B. (2018). The marginal cost of public funds is one at the optimal tax system.International
Tax and Public Finance,25(4), 883–912. http://dx.doi.org/10.1007/s10797-017-9481-0
Lanzer, B. N., & Porto, S. d. S., Jr. (2011, December). A economia informal e o custo marginal da trib-utação no Brasil. In39º Encontro Nacional de Economia da ANPEC, Foz do Iguaçu.http://anpec .org.br/encontro/2011/inscricao/arquivos/000-614536d09ffbc91573943c164f21ad09.pdf Litschig, S., & Morrison, K. M. (2013). The impact of intergovernmental transfers on education
out-comes and poverty reduction.American Economic Journal: Applied Economics,5(4), 206–240. http://dx.doi.org/10.1257/app.5.4.206
Mintz, J., & Smart, M. (2004). Income shifting, investment, and tax competition: Theory and evidence from provincial taxation in Canada.Journal of Public Economics,88(6), 1149–1168. http://dx.doi.org/10.1016/S0047-2727(03)00060-4
Siqueira, R. B. d., Nogueira, J. R. B., Souza, E. S. d., & Carvalho, D. B. (2010, December). O custo marginalsocialdatributaçãoindiretanoBrasil: Identificandodireçõesdereforma. In
38ºEncon-tro Nacional de Economia da ANPEC, Salvador, BA. http://www.anpec.org.br/encontro2010/
inscricao/arquivos/271-8dbd10a9e0435a7e286905e9dda8141a.doc
Van der Klaauw, W. (2002). Estimating the effect of financial aid offers on college enrollment: A regression-discontinuity approach.International Economic Review,43(4), 1249–1287. http://dx.doi.org/10.1111/1468-2354.t01-1-00055
Vegh, C. A., & Vuletin, G. (2015). Unsticking the flypaper effect in an uncertain world. Journal of
Public Economics,131, 142–155. http://dx.doi.org/10.1016/j.jpubeco.2015.09.001
Mattos et al.: Grants and Marginal Cost of Public Funding: Empirical Evidence for Local Governments in Brazil 495
Appendix.
Table A-1.Population cutoffs for FPM (transfers) distribution.
Population Range Factor
Up to 10,188 0.6
From 10,189 to 13,584 0.8
From 13,585 to 16,980 1.0
From 16,981 to 23,772 1.2
From 23,773 to 30,564 1.4
From 30,565 to 37,356 1.6
From 37,357 to 44,148 1.8
From 44,149 to 50,940 2.0
From 50,941 to 61,128 2.2
From 61,129 to 71,316 2.4
From 71,317 to 81,504 2.6
From 81,505 to 91,692 2.8
From 91,693 to 101,880 3.0 From 101,881 to 115,464 3.2 From 115,465 to 129,048 3.4 From 129,049 to 142,632 3.6 From 142,633 to 156,216 3.8
> 156,216 4.0
Note:Law by Decree nº 1.881/1981.
Table A-2.Regression on tax base elasticity (without tax capacity covariate). Dependent variable: Ln of number of firms.
Bandwidth size 500 1,000 1,500 2,000 3,000 4,000 Total Cut-off 1 -0.140∗∗∗ -0.094∗∗ -0.050
(-3.129) (-2.453) (-1.430)
Number of cases 1,355 2,687 3,904
Cut-off 2 -0.023 -0.009 -0.013
(-1.114) (-0.507) (-0.640)
Number of cases 2,003 2,947 3,914
Cut-off 3 0.177∗∗∗ 0.111 -0.041
(3.253) (0.993) (-0.934)
Number of cases 2,214 2,476 4,298
Cut-off 4 -0.249 -0.004 0.191
(-1.182) (-0.021) (0.957)
Number of cases 1,769 2,596 3,520
Cut-off 5 -0.629∗∗ -0.570∗∗ -0.476∗∗
(-2.357) (-2.467) (-2.437)
Number of cases 997 1,519 2,023
Total -0.016∗∗
(-2.463)
Number of cases 37,708
Notes:All regressions include fixed effect and time effects. In parentheses are robust𝑡statistics. ∗∗∗𝑝 < 0.01,∗∗𝑝 < 0.05,
Table A-3.First Stage (IV) regression results.
Population cutoffs (binary variables)
dfxpop1 −0.446∗∗∗ (−19.360)
dfxpop2 −0.310∗∗∗ (−15.240)
dfxpop3 −0.211∗∗∗ (−11.530)
dfxpop4 −0.147∗∗∗ (−9.220)
dfxpop5 −0.102∗∗∗ (−7.590)
dfxpop6 −0.064∗∗∗ (−6.300)
dfxpop7 −0.029∗∗∗ (−4.100)
dfxpop9 0.020∗∗ (2.040)
dfxpop10 0.007 (0.820)
dfxpop12 0.008 (0.710)
dfxpop14 −0.010 (−0.440)
dfxpop16 −0.006 (−0.360)
Notes: All regressions include fixed effect and time effects. In parentheses are𝑡statistics. Number of obs is 36,211. ∗∗∗𝑝 <0.01,
∗∗𝑝 <0.05,∗𝑝 <0.1.