www.scielo.br/rbg
CONTRIBUTIONS OF DIGITAL IMAGE ANALYSIS
TO SEDIMENTARY ROCK CHARACTERIZATION
José Agnelo Soares, Paula Rayane Lopes de Andrade and
Juliana Trajino Batista
ABSTRACT.This article presents results achieved by a series of studies aiming to evaluate petrophysical properties from digital images of sedimentary rocks. This characterization from digital images occur in the pores and grain scale, but it is confronted with the same properties as they are conventionally measured on the centimeter scale of laboratory rock samples. The properties evaluated were the porosity of macro and micro pores, mineral composition, the size distribution of grains and pores, sphericity and roundness of the mineral grains, permeability, the quality of grain-grain contacts, elastic wave velocities and electrical properties of the rocks. Predictive models for permeability and elastic velocities of carbonate rocks are presented for the estimation of these properties from the extracted parameters of rocks’ digital images. Beyond of elastic properties (e.g. VP and VS), important parameters for estimation of hydrocarbon reserves, such as tortuosity factor and saturation and cementation coefficients, are evaluated through the digital models of rock.
Keywords: X-ray microtomography, rock characterization, petrophysics, carbonate, sandstone, shale.
RESUMO.Este artigo apresenta os resultados de estudos realizados com o objetivo de avaliar propriedades petrofísicas de rochas sedimentares a partir de suas respectivas imagens digitais. Essa caracterização a partir de imagens digitais ocorre na escala de poros e grãos, mas ela é confrontada com as mesmas propriedades medidas de forma convencional na escala de amostras de rochas com dimensões centimétricas. As propriedades avaliadas foram a porosidade de macro e de micro poros, a composição mineral, a distribuição de tamanhos de grãos e de poros, a esfericidade e o grau de arredondamento dos grãos minerais, a permeabilidade, a qualidade dos contatos intergrãos, as velocidades das ondas elásticas e as propriedades elétricas das rochas. Modelos preditivos para a permeabilidade e as velocidades elásticas de rochas carbonáticas são apresentados para a estimativa dessas propriedades a partir de parâmetros extraídos de imagens digitais de rochas. São avaliadas criteriosamente, através dos modelos digitais de rocha, propriedades elásticas (como VP e VS), além de parâmetros importantes para a estimativa de reservas de hidrocarbonetos, tais como o fator de tortuosidade e os coeficientes de saturação e de cimentação.
Palavras-chave: microtomografia de raios X, caracterização de rochas, petrofísica, carbonato, arenito, folhelho.
Universidade Federal de Campina Grande, Rua Aprígio Veloso, 882, Bairro Universitário, Bloco BY, 58429-900 Campina Grande, PB, Brazil – E-mails: [email protected], [email protected], [email protected]
INTRODUCTION
The geophysical methods used for the exploration of underground natural resources, especially applied in sedimentary environments, are sensitive to variations in physical and compositional properties of rocks and sediments, pore fluids and the environmental conditions under which the rocks lie (Bourbié et al., 1987; Mavko et al., 2003; Avseth et al., 2005). For this reason, to decrease the exploration risk, it is necessary to characterize the porous space and the grains that make up sedimentary rocks. The more you know about the mineral composition, porosity, fluid flow, and the parameters that control these properties, better these rocks can be evaluated as reservoirs or mineral deposits of economic importance.
Several techniques are used in the imaging of rocks. Some generate two-dimensional images, as is the case of thin section examined in petrographic microscope, and other generate three-dimensional images, such as X-ray computed tomography (Mees et al., 2003; Andrä et al., 2013a). Both types of image can be analyzed in order to characterize the rocks. However, the techniques that provide three-dimensional images allow you to evaluate aspects such as the topology of the grains, pore connectivity, and the spatial distribution of grains and pores.
X-ray tomographic images register differences in the degree of attenuation of the X-rays, which under high energy, is controlled mainly by the density of the imaged object. There is a strong contrast between the mineral grain density and the density of the fluid contained in the pores of rocks. Therefore an important application of microCT is in the study of porosity (Perret et al., 1999; Van Geet et al., 2000). Andrä et al. (2013a) demonstrated the influence of the image segmentation process on the estimated porosity of carbonate rocks, sandstones and of a numeric package of solid spheres. Andrä et al. (2013b) used these digital images to calculate physical properties of rocks, such as permeability, electrical resistivity and elastic moduli. They have shown that, although there is a variation in estimated values depending on the algorithm and parameters used, the petrophysical properties calculated from digital images of rocks are compatible with those laboratory measured in samples of rocks.
Berg et al. (2017) presented the state of the art in industrial applications of digital petrophysics (DRP-Digital Rock Physics) for the analysis of several rock properties from two-dimensional and three-dimensional digital images. They showed DRP applications on analysis of mineral composition, effective porosity and microporosity, pore and grain size distribution,
capillary pressure curves, irreducible water saturation and absolute and relative permeabilities.
Archilha (2015) has shown DRP is a powerful tool to investigate the internal structure of carbonate rocks, especially those with grainstone texture. According this author, in order to estimate the acoustic velocity it is important to describe two geometric parameters of porous space: gamma (a function of the surface area of the pores normalized by spheres of equivalent volumes) and dominant pore size. These two parameters combined with the model of Kuster & Toksöz would explain more than 90% of the measured rock acoustic velocity. Arns et al. (2001) and Dvorkin et al. (2011) showed that it is possible to obtain electrical properties of rocks from images of X-ray microCT.
Saxena et al. (2018) investigated how determine the representative elementary volume necessary to determine the permeability of siliciclastic rocks. They propose that if the dimension of the image is greater than five times the effective grain size, the digitally estimated permeability of fine to coarse sandstones is reliable and comparable to that measured in conventional laboratory tests.
In this article is demonstrated the applicability of rock digital image analysis to characterize several important rock features for mineral and energy prospecting activities. Here is showed a summary of the results achieved by a series of DRP studies developed for estimation of: porosity (macro and micro pores), mineral composition analysis, grain size and distribution of pores, analysis of mineral grain sphericity and roundness, absolute permeability, quality of grain-grain contacts, elastic wave velocities (P and S), electrical properties of rocks and, finally, a digital petrophysical model is proposed for the estimation of absolute permeability and elastic velocities of carbonate rocks.
METHODOLOGY
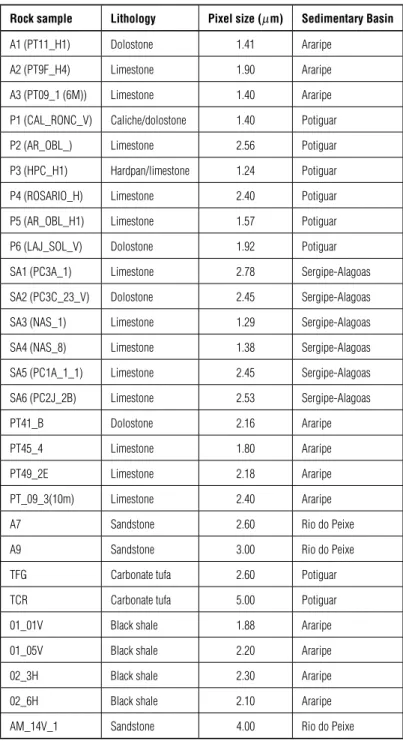
The digital images used in this article were obtained from rock samples extracted of outcrops or well cores of sedimentary basins in the Northeast region of Brazil. Most analyses were carried out from three-dimensional models of rock obtained by X-ray microCT. A minority quantity of analyses was conducted from two-dimensional digital photographs retrieved from thin sections. A total of 29 rock samples was investigated in this article, whose lithological types, image resolutions (pixel sizes) and sedimentary basin of origin are listed in Table 1.
Table 1 – Rock sample, lithology, image resolution (pixel size) and sedimentary basin of origin. Rock sample Lithology Pixel size (µm) Sedimentary Basin
A1 (PT11_H1) Dolostone 1.41 Araripe
A2 (PT9F_H4) Limestone 1.90 Araripe
A3 (PT09_1 (6M)) Limestone 1.40 Araripe
P1 (CAL_RONC_V) Caliche/dolostone 1.40 Potiguar
P2 (AR_OBL_) Limestone 2.56 Potiguar
P3 (HPC_H1) Hardpan/limestone 1.24 Potiguar
P4 (ROSARIO_H) Limestone 2.40 Potiguar
P5 (AR_OBL_H1) Limestone 1.57 Potiguar
P6 (LAJ_SOL_V) Dolostone 1.92 Potiguar
SA1 (PC3A_1) Limestone 2.78 Sergipe-Alagoas
SA2 (PC3C_23_V) Dolostone 2.45 Sergipe-Alagoas
SA3 (NAS_1) Limestone 1.29 Sergipe-Alagoas
SA4 (NAS_8) Limestone 1.38 Sergipe-Alagoas
SA5 (PC1A_1_1) Limestone 2.45 Sergipe-Alagoas
SA6 (PC2J_2B) Limestone 2.53 Sergipe-Alagoas
PT41_B Dolostone 2.16 Araripe
PT45_4 Limestone 1.80 Araripe
PT49_2E Limestone 2.18 Araripe
PT_09_3(10m) Limestone 2.40 Araripe
A7 Sandstone 2.60 Rio do Peixe
A9 Sandstone 3.00 Rio do Peixe
TFG Carbonate tufa 2.60 Potiguar
TCR Carbonate tufa 5.00 Potiguar
01_01V Black shale 1.88 Araripe
01_05V Black shale 2.20 Araripe
02_3H Black shale 2.30 Araripe
02_6H Black shale 2.10 Araripe
AM_14V_1 Sandstone 4.00 Rio do Peixe
Petrophysical analysis of digital images generally occurs in three steps: pre-processing, processing and simulation. Shortly after the acquisition of microCT data preprocessing step occurs, which consists of preview, possible application of filters to remove artifacts and extraction of a subvolume (in the case of two-dimensional images, sub-area). In the initial stage of processing the subvolume needs to be segmented. Segmentation
consists in recognizing the different phases that make up the sample of rock, such as pores and possibly several minerals. Soon after the segmentation you can quantify properties such as porosity and mineral components.
The simulation step is used to investigate more complex petrophysical processes like fluid flow, propagation of elastic waves or electrical fields in rocks. For this step you build
a three-dimensional rock model represented by a numerical mesh, and then the simulation is done resolving the differential equations governing the particular physical process through a numerical method. The steps of preprocessing and segmentation, as well as the simulation of fluid flow, were carried out in the software Avizo Fire®, while the simulation of elastic wave
propagation and electrical fields were carried out in the software Comsol Multiphysics®.
In this work the porosity of rocks was analyzed in terms of the contributions of macro pores and micro pores, being the total porosity the sum of macroporosity and microporosity. Here the macro pores are defined as those that can be clearly identified in digital images, while the micro pores are below the image resolution, appearing in the images as part of gray stains, here called as intermediate phase, which is darker than the mineral components, but lighter than the macro pores.
The macro pores are identified by the adoption of a maximum threshold of gray tone. The microCT tomograms consist of pixels, each of which has a gray tone, which varies between 0 (absolute black) and 255 (white). Components of lower density, as the pores, are darker, so the pixels that make up the pores present grayscale closer to 0 than 255. Pore segmentation using the threshold technique determines the maximum gray tone presented by pore pixels. This technique is suitable for the quantification of macro pores, which feature well-defined contours, but inappropriate for quantification of micro pores.
For the quantification of macro pores it was adopted the procedure proposed by Al Ratrout et al. (2013). This procedure estimates an index of microporosity for the intermediate phase, which varies between approximately one (for pixels with gray tones very close to the upper threshold of the macro pores) and zero (for pixels with gray tones close to the minimum threshold of the solids). The average index of microporosity for the intermediate phase is multiplied by the volume of the intermediate phase and divided by the total volume of the analyzed subvolume. Thus the microporosity of the subvolume is estimated.
The mineral composition analysis presented here is based on identifying the density of the various mineral components of the rock, in addition to the expected mineral associations for each lithotype, as suggested by the Sena (2017). This procedure begins by segmenting the different mineral phases, in addition to the macro pores, and the definition of the gray tone characteristic of each phase. This procedure assumes that the pores and at least two mineral phases are known, so that one can fit a nonlinear function between the grayscale and the density values
characteristic of known phases. For the mineral phases initially unknown, put their gray values on the fit function and get their density values. Crossing these density values with the mineral associations expected for the type of mineral rock in analysis, these mineral phases are then recognized.
The pore size distribution is based on the principle of segmentation of pores, the quantification of the volume of each pore and calculating the volume of a sphere with diameter equal to that of every pore, getting the distribution of equivalent diameter of pores. The determination of size and shape parameters of grains is a little more complex because you need to map the contours of grains. Grain boundaries are mapped by the application of the Watershed transform (Beucher & Meyer, 1992) and then the distributions of grain size (equivalent diameter) and grain shape parameters (sphericity, roundness and aspect ratio) are calculated.
The estimation of absolute permeability done in this work solves the Navier-Stokes equation system through the finite volume method. It is necessary to inform inlet and outlet pressure values, in addition to the dynamic viscosity of the fluid. The fluid velocity and pressure fields within the rock digital model are the outputs obtained. The rock permeability is directly dependent on the effective porosity and on the degree of pore connectivity. In this article the pore connectivity is estimated by calculating the Euler number for the macro pores and for the micro pores.
The quality of grain-grain contacts is analyzed in this paper according to the methodology proposed by Soares & Coura (2017). The method consists in locating the contact regions between grains, similarly to the case of the analysis of the distribution of grain sizes, followed by the generation of three-dimensional models of these contact volumes with increasing levels of smoothing. The smoothing of the grain-grain contact model promotes the volume reduction of those surfaces, and this reduction is larger for surfaces of low rounding degree and small aspect ratio, compared to contacts in the form of points. A quality index for grain-grain contacts is calculated as the difference between the percentages of contact surfaces volumes with minimum and maximum smoothing.
Numerical adaptive meshes composed of tetrahedral elements have been generated for the simulation of elastic dynamic and electric fields. Such meshes were generated in Avizo Fire®software and exported to the Comsol Multiphysics®
software. The methodology applied in the simulation of P and S elastic wave propagation is that described in detail by Sousa (2017) and the electric field propagation is as discussed in
Figure 1 – A) Original microCT image in grayscale. B) The same image after segmentation. Black regions are macro pores, light blue are micro pores and dark blue are mineral matrix.
Figure 2 – Porosity values of macro and micro pores estimated through digital image analysis for a set of 16 carbonate rock samples (Table 1).
Leal (2018). Finally, predictive models are proposed to the permeability and elastic velocities of carbonate rocks. These models were built by applying multivariate nonlinear regression functions of piecewise type.
RESULTS
Figure 1 presents, as an example, the result of the segmentation process applied to a microCT image with the objective to recognize three components: macro pores, intermediate phase (containing micro pores) and mineral matrix. In Figure 2 are shown the values of porosity of macro and micro pores for a set of 16 samples of carbonate rocks (Leal, 2018). It is seen that, with the exception of samples P1 and SA3, the microporosity of these samples is greater than the macroporosity. This set of samples is quite heterogeneous, being composed of such disparate facies as packstones, grainstones, caliches and carbonate tufa. The sample P1 is a caliche and SA3 is a packstone.
Figure 3 shows the relationship between the densities of the mineral phases of sample A1 against their respective gray tones presented in microCT images (Sena, 2017). Pores, dolomite and pyrite are initially the known phases. The regression function between the density and the gray tone level (GTL) was established for these phases. Then, the GTL value of the unknown phase was introduced in the fitted function, providing a density value compatible with limonite.
Figure 4 presents the recognized mineral phases by analysis of digital images of microCT for the set of 16 samples of carbonate rocks. It presents the joint effect of mineral composition, total porosity, percentage of microporosity and the type of porosity (if intergrain or vugular) on compressional elastic wave velocity measured in laboratory. Note that samples with high total porosity present low P-wave velocity (SA3, A4 and P1). In the case of the sample SA4 the total porosity is a median value and VP
increases compared to the previous samples. All these samples have porosity of the intergranular type, whereas the other samples have vug pores. Higher levels of denser minerals tend to increase the P-wave velocity, while higher levels of less dense phases, like clay minerals, tend to reduce the VP value. Rock samples with similar mineral composition and same total porosity tend to have smaller values of VP when there are higher microporosity values.
Figure 3 – Relationship between phase densities and gray tone levels for microCT images of rock sample A1. Black dots are the initially known phases. The red dot indicates the new recognized mineral phase.
Figure 5 shows the recognized mineral phases, macro pores and organic matter in a digital image (nanoCT) of a black shale sample from the Araripe basin (Rodrigues, 2018) Table 2 quantifies the phases of this sample. In Figure 6 only the pyrite phase was left visible, in yellow, for the three-dimensional model of the same sample. The red circles highlight crystals
Figure 4 – Relationship among lab measured P-wave velocity and mineral matrix composition, total porosity and microporosity for a set of 16 carbonate rock samples. The last three properties were estimated by microCT digital image analysis.
Figure 5 – A) Original nanoCT digital image; B) Mineral phases, pores and organic matter recognized in image A of the black shale sample 01_01V from the Araripe basin.
with a typical habit of pyrite. Figure 7 shows the equivalent pore diameter distribution for the SA3 carbonate sample as done by microCT digital image analysis (Vidal, 2015).
Figure 8 presents the segmentation result (mineral matrix and pores) from a digital image of a sandstone thin section, with the corresponding individual mineral grains (Vasconcelos et al., 2016). From the picture 8B the distribution of grain sizes and
parameters regarding sphericity, rounding and aspect ratio of the grains are estimated.
Figure 9 shows a histogram with the distribution of grain sizes of the sample AM_14V_1. The class 2 corresponds to grains of clay, class 3 to silt, 4 to very fine sand, 5 to fine sand, 6 to medium sand, 7 to coarse sand and 8 to very coarse sand. Figure 10 shows a histogram with the mineral grains sphericity
Figure 6 – Only the mineral phase pyrite is visible in this 3D nanoCT model of the black shale sample 01_01V. Red circles highlight typical crystalline habits of pyrite.
Table 2 – Volumetric fractions for the nanoCT black shale sample 01_01V. Phase (%) Porosity 1.4 Organic matter 22.9 Clay+Calcite 60.9 Limonite 11.7 Pyrite 2.8
Figure 7 – Equivalent pore diameter distribution for the SA3 carbonate rock sample according microCT digital image analysis.
Figure 8 – A) Segmented image in mineral matrix and pores of AM_14V_1 sandstone thin section; B) Corresponding image showing individual mineral grains.
Figure 9 – Grain size histogram for the sandstone sample AM_14V_1. Figure 10 – Histogram of grain sphericity degrees for the sandstone sampleAM_14V_1.
for the sample AM_14V_1. The class 1 corresponds to very poor sphericity, 2 to poor, 3 to medium, 4 to good and 5 to the very good.
Figures 11 and 12 show, respectively, the histograms for grain rounding and grain aspect ratio for the sample AM_14V_1. The class 1 indicates sub-angular grains, 2 indicates angular ones, 3 sub-rounded grains and the class 4 indicates rounded grains. A spherical grain has aspect ratio equal to 1, while lamellar grains present aspect ratio much lower than 1.
Soares & Andrade (2017) estimated the absolute permeability of the macro and of the micro pores of a set of 16 carbonate rock samples, based on microCT digital image analysis. In addition, it was estimated the porosities and connectivity of the macro and of the micro pores. Connectivity is quantified by the logarithm of the absolute value of the Euler number. The sign of the Euler number is returned after the calculation of its logarithm. This artifice circumvents the impossibility to calculate logarithms of negative numbers. Well-connected pores present strongly negative values for the Euler number, while poorly-connected pores present strongly positive numbers. Table 3 presents the permeability measured conventionally and porosity, permeability and the logarithm of the number of Euler, for macro and for micro pores, estimated from the digital images of microCT.
Figure 13 displays the spatial arrangement of macro and micro pores of the black shale sample 01_01V. Neighboring interconnected pores are displayed as a same color cloud of
pores. Not connected pores are in different color clouds of pores. The left image shows that the macro pores are connected along to shale bedding planes and that they are poorly connected in the direction perpendicular to the bedding planes. The logarithm of the Euler number for the macro pores is 4.777. The image on the right shows that the micro pores of this shale sample are very well connected, because almost all of them form a single red cloud. The logarithm of the Euler number for the micro pores is equal to -5.481.
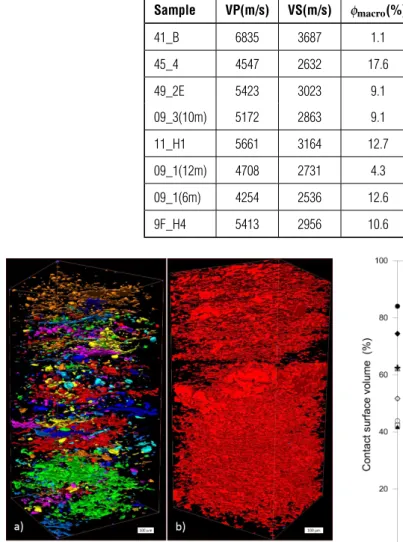
Soares & Coura (2017) estimated from digital images of microCT, a quality score for the grain-grain contacts of a set of eight samples of carbonate rocks from the Araripe basin, Brazil. Figure 14 shows how the volume of grain-grain contacts for each rock sample is reduced with the increased smoothing applied during the generation of three-dimensional model of such samples. Table 4 presents the elastic velocities conventionally measured in the samples, in addition to the porosity of the macro and of the micro pores and quality index of grain-grain contacts (QIGC), these estimated digitally. Figures 15 and 16 show the volume reduction of the grain-grain contacts of two samples, the first with high QIGC, so with predominance of planar surfaces, and another with low QIGC, in which contacts in the form of points predominate.
Apolinário (2016) simulated the P-wave propagation in rock digital models by applying a finite element algorithm for the transient solution of acoustic pressure. Sousa (2017) applied other finite element algorithm that performs the analysis
Figure 11 – Grain rounding histogram for the sandstone sample AM_14V_1. Figure 12 – Grain aspect ratio histogram for the sandstone sample AM_14V_1.
Table 3 – Conventionally measured absolute permeability and other petrophysical properties estimated through microCT digital image analysis for a set of 16 carbonate rock samples.
Sample KLAB(mD) φmacro(%) φmicro(%) Kmacro(mD) Kmicro(mD) Log (ENmacro) Log (ENmacro)
CAL_RONC_V 2.026 19.1 14.6 65.2 53.0 -3.371 -4.539 PC3C_23_V 0.199 8.1 11.2 99.2 183.2 -3.391 -3.755 NAS_1 1.348 8.1 17.1 19.7 107.8 +2.780 -3.323 PC3A_1 0.009 24.7 14.4 530.5 355.5 -3.057 -3.033 AR_OBL_V3 0.296 16.5 12.3 110.8 175.2 -3.020 -3.257 ROSARIO_H 0.477 5.6 6.0 64.6 105.3 -2.676 +3.126 LAJ_SOL_V 0.109 9.9 5.5 37.3 40.5 -2.507 -4.137 PC2J_2B 0.149 4.5 2.2 77.2 58.0 +2.338 +2.464 HPC_H1 0.013 6.6 3.7 40.1 20.6 +2.505 +2.546 PC1A_1_1 0.153 10.4 14.4 81.1 120.3 +2.573 +1.968 AR_OBL_H1 0.008 11.6 6.6 33.0 31.8 +3.119 -3.015 PT9F_H4 1.813 2.6 6.8 27.2 43.4 +3.357 -4.154 NAS_8 0.023 11.7 21.6 19.5 157.3 +3.356 -4.477 PT09_1(12M) 0.001 6.2 18.6 15.2 80.9 +3.723 -4.545 PT09_1(6M) 0.007 4.4 11.5 13.0 30.3 +3.832 -4.134 PT11_H1 0.041 4.8 11.5 13.3 35.4 +3.862 -4.295
Table 4 – Conventionally measured elastic velocities and porosity and quality index of grain-grain contacts estimated through digital image analysis.
Sample VP(m/s) VS(m/s) φmacro(%) φmicro(%) QIGC(%)
41_B 6835 3687 1.1 0.4 83.5 45_4 4547 2632 17.6 7.7 61.6 49_2E 5423 3023 9.1 1.9 48.2 09_3(10m) 5172 2863 9.1 3.8 74.0 11_H1 5661 3164 12.7 11.5 37.8 09_1(12m) 4708 2731 4.3 18.6 39.4 09_1(6m) 4254 2536 12.6 11.5 59.8 9F_H4 5413 2956 10.6 6.8 32.0
Figure 13 – Connectivity of a) macro pores and of b) micro pores for the shale sample 01_01V. Interconnected pores are shown in the same color. The logarithm of the Euler number for the macro pores is 4.777 and for the micro pores is -5.481.
Figure 14 – Volume reduction in grain-grain contacts with the increased smoothing applied during the 3D rock model generation.
of transient wave propagation in rock masses caused by the application of an explosive charge. This second algorithm allows to assess both the P-wave velocity (VP) but also the S-wave velocity (VS) in digital models of rocks.
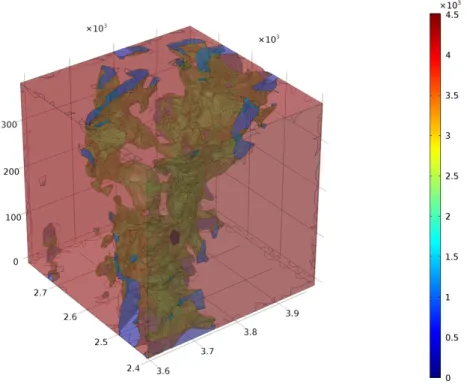
Figure 17 presents, as an example, the distribution of S-wave velocity at each point of the mesh that represents the digital model of the sample A7. In table 5 are listed the VP and VS values measured in laboratory (the S-wave velocity is measured for two mutually orthogonal polarization directions: VS1and VS2) and the elastic velocities estimated from rock digital
models. In the case of computationally estimated VP the algorithm
of Apolinário (2016) was used, which resulted in VP1, and the
algorithm of Sousa (2017), which resulted in the values of VP2
and VS (digital). Note the values of computationally estimated VP by Sousa (2017) were closer to the values of the lab measured VP than those estimated by Apolinário (2016). Additionally, the VS values estimated by digital analysis were also very close to the mean of the measured VS values.
Leal (2018) applied the Electric Currents module of Comsol Multiphysics software for studying the passage of an electric current along the digital rock samples, having estimated the current density in those samples. From the current density,
Figure 15 – Volume reduction of the grain-grain contacts with increased smoothing (from A to E) for the dolostone rock sample 41_B. The QIGC for this sample is 83.5%.
Figure 16 – Volume reduction of the grain-grain contacts with increased smoothing (from A to E) for the limestone rock sample 9F_H4. The QIGC for this sample is 32.0%.
Figure 17 – Spatial distribution of S-wave velocity values on the digital model of the A7 rock sample. Table 5 – Elastic velocities measured by the conventional method and estimated by the digital approach for the A7 rock sample. VP1values were estimated by the Apolinário (2016) algorithm, while VP2ones were estimated by the
Sousa (2017) algorithm.
Sample VP lab (m/s) Digital (m/s) Lab (m/s) VS (m/s) mean VS (m/s) digital VP1 VP2 VS1 VS2
A7 3786 4129 3863 2372 2310 2341 2363
A9 3319 3405 3392 2052 2018 2035 2104
TFG 5898 6382 6026 2399 3570 2984 3062
TCR 4490 4800 4616 2401 2323 2362 2382
and using the procedure described in detail by Leal (2018), were estimated the formation factor, the rock resistivity, and the Archie´s coefficients (tortuosity factor and coefficients of saturation and cementation). All samples were simulated as 100% saturated with water. Table 6 presents the simulation results for electrical properties of 16 carbonate rock samples.
Applying the piecewise multivariate nonlinear regression method in order to find a function relating conventionally measured rock permeability and P- and S-wave velocities with
the digitally estimated rock properties, Soares & Andrade (2017) and Soares & Coura (2017) proposed the following petrophysical models for carbonate rocks:
KLAB(mD) = 0.1448950.022618log(ENMACRO)+
0.001008KMICRO0.003402φMICRO
−0.000881KMACRO+ 0.012953log(ENMICRO)
+0.000229φMACRO
Table 6 – Conventionally measured elastic velocities and porosity and quality index of grain-grain contacts estimated through digital image analysis.
Sample Currentdensity Formationfactor Resistivity(ohm.m) Cementingexponent Saturatingcoefficient Tortuosityfactor
A1 23.96 515 103 2.28 1.84 3.67 A2 0.10 74905 14981 4.88 5.42 4.27 A3 0.14 74082 14816 4.80 2.72 5.67 A4 0.13 86990 17398 4.69 2.90 5.40 P1 60.87 494 99 1.83 1.15 2.22 P2 0.09 111605 22321 4.14 2.46 3.23 P3 0.16 32914 6583 8.23 3.90 9.26 P4 0.08 50745 10149 5.76 6.27 5.38 P5 0.13 86125 17225 4.52 1.04 4.89 P6 27.20 305 61 1.75 10.59 4.11 SA1 0.08 75259 15052 4.93 9.95 4.54 SA2 18.33 384 77 2.08 13.94 4.53 SA3 31.34 1152 230 1.96 8.19 2.40 SA4 0.15 195581 39116 3.76 10.45 2.70 SA5 0.09 92537 18507 4.26 8.24 5.33 SA6 0.08 46654 9331 6.28 5.95 9.09 if KLAB≤ 0.417mD, and
KLAB(mD) = 0.297013 + 0.274073log(ENMACRO)
−0.092001KMICRO+ 0.787456φMICRO
+0.098193KMACRO+ 0.569993log(ENMICRO)
−0.407271φMACRO
(2)
if KLAB > 0.417mD, where KLAB is the permeability value
measured in laboratory, log(ENMACRO) and log(ENMICRO) are
the logarithms of the Euler numbers for the macro pores and for the micro pores, KMACROand KMICROare the permeability values,
in mD, estimated for the macro pores and for the micro pores, andφMACROandφMICROare the porosity values (in%) estimated
for the macro pores and for the micro pores, respectively. Data used for the regression are listed in Table 3.
Similarly, Soares & Coura (2017) proposed a model for the estimation of P- and S-wave elastic velocities of carbonate rocks
using the data listed in the Table 4. The proposed model is given by: V P= 11330 − 73.7828φmacro −203.73φmicro− 287.848QIGC (3) if V P ≤ 5251.6 m/s, and if V P > 5251.6 m/s V P= 5640 − 124.223φmacro +87.2933φmicro+ 15.5092QIGC (4)
For the case of S-wave, if V S ≤ 2949 m/s equation may be applied V S= 5167.85 − 28.449φmacro −73.777φmicro− 23.882QIGC (5) while if V S > 2949 m/s V S= 2569 − 30.569φmacro +40.4868φmicro+ 13.6057QIGC (6)
Similar models for the estimation of permeability and elastic velocities of black shales were proposed by Oliveira & Soares (2018).
CONCLUSIONS
In this work were presented results of the application of digital image analysis in order to characterize sedimentary rocks about their physical properties on the scale of grains and pores. In addition, relations were established between petrophysical lab measured properties and petrophysical properties estimated from digital images. The digital rock models enable evaluate topological aspects and spatial distribution of grains and pores and their interrelationship, as the quality of the grain-grain contacts and the connectivity of macro and micro pores. Physical properties important for the exploration of natural resources, like water and hydrocarbons, can be evaluated from digital rock models, such as the porosity and the permeability, which control the production and storage capacity of fluid, elastic velocities, which are at the base of the seismic method – main method for oil and gas exploration – and the electrical properties that allow to evaluate the fluid type and saturation. Predictive models for the estimation of permeability and elastic velocities were presented for the estimation of these properties from extracted parameters of digital rock images. Important parameters for estimation of hydrocarbon reserves, and of difficult evaluation, such as the tortuosity factor and the saturation and cementing coefficients were assessed carefully by means of digital rock models. The main contribution of digital rock images is that they give rise to digital models that preserve the original characteristics of the rock and enable an integrated research of a large number of physical properties, offering the opportunity to establish robust relationships and reliable predictive models.
ACKNOWLEDGEMENTS
The authors thank PETROBRAS and ANP (Brazilian Petroleum Agency) for financial support through several R&D agreements and permission for publication of these results.
REFERENCES
AL RATROUT AA, KALAM MZ, GOMES JS & JOUINI MS. 2013. Narrowing the loop for microporosity quantification in carbonate reservoirs. In: SPE Reservoir Characterization and Simulation Conference and Exhibition. Abu Dhabi. UAE, SPE-166055-MS, Society of Petroleum Engineers.
ANDRÄ H, COMBARET N, DVORKIN J, GLATT E, HAN J, KABEL M, KEEHM Y, KRZIKALLA F, LEE M, MADONNA C, MARSH M, MUKERJI
T, SAENGER EH, SAIN R, SAXENA N, RICKER S, WIEGMANN A & ZHAN X. 2013a. Digital rock physics benchmarks—Part I: Imaging and segmentation. Computers & Geosciences, 50: 25–32.
ANDRÄ H, COMBARET N, DVORKIN J, GLATT E, HAN J, KABEL M, KEEHM Y, KRZIKALLA F, LEE M, MADONNA C, MARSH M, MUKERJI T, SAENGER EH, SAIN R, SAXENA N, RICKER S, WIEGMANN A & ZHAN X. 2013b. Digital rock physics benchmarks—Part II: Computing effective properties. Computers & Geosciences, 50: 33–43.
APOLINÁRIO FDO. 2016. Influência da saturação fluida nas propriedades elásticas de rochas carbonáticas. Master’s dissertation. Programa de Pós-Graduação em Exploração Petrolífera e Mineral, Universidade Federal de Campina Grande. Brazil. 137 pp.
ARCHILHA N. 2015. Quantificação de parâmetros geométricos do sistema poroso por tomografia de raios X e análise da influência em propriedades físicas de rochas carbonática. Ph.D. thesis. Universidade Estadual do Norte Fluminense Darcy Ribeiro, Campos dos Goytacazes. Brazil. 122 pp.
ARNS CH, KNACKSTEDT MA, PINCZEWSKI MV & LINDQUIST W. 2001. Accurate estimation of transport properties from microtomographic images. Geophysical Research Letters, 28(17): 3361–3364.
AVSETH P, MUKERJI T & MAVKO G. 2005. Quantitative seismic interpretation. Applying rock physics tools to reduce interpretation risk. Cambridge University Press. 359 pp.
BERG CF, LOPEZ O & BERLAND H. 2017. Industrial applications of digital rock technology. Journal of Petroleum Science and Engineering, 157: 131–147.
BEUCHER S & MEYER F. 1992. The morphological approach to segmentation: the watershed transformation. In: DOUGHERTY ER (Ed.). Mathematical Morphology in Image Processing. Marcel Dekker AG, chapter 12, p. 433–481.
BOURBIÉ T, COUSSY O & ZINSZNER B. 1987. Acoustics of porous media. Editions Technip. 334 pp.
DVORKIN J, DERZHI N, DIAZ E & FANG Q. 2011. Relevance of computational rock physics. Geophysics, 76(5): E141–E153. LEAL FDB. 2018. Avaliação das propriedades elétricas e de molhabilidade de rochas carbonáticas. Master’s dissertation. Programa de Pós-Graduação em Exploração Petrolífera e Mineral, Universidade Federal de Campina Grande. Brazil. 78 pp.
MAVKO G, MUKERJI T & DVORKIN J. 2003. The rock physics handbook. Tools for seismic analysis in porous media. Cambridge University Press. 329 pp.
MEES F, SWENNEN R, VAN GEET M & JACOBS P. 2003. Applications of X-ray computed tomography in the geosciences. Geological Society, London, Special Publications, 215(1): 1–6.
OLIVEIRA NM & SOARES JA. 2018. Microtomographic analysis of controlling parameters on permeability and elastic velocities of black shales. Journal of Geophysics and Engineering, 15: 2433–2441. PERRET J, PRASHER S, KANTZAS A & LANGFORD C. 1999. Three-dimensional quantification of macropore networks in undisturbed soil cores. Soil Science Society of America Journal, 63(6): 1530–1543. RODRIGUES IDS. 2018. Caracterização multiescalar petrofísica e mineralógica de folhelhos da Bacia do Araripe. Master’s dissertation. Programa de Pós-Graduação em Exploração Petrolífera e Mineral, Universidade Federal de Campina Grande. Brazil. 71 pp.
SAXENA N, HOWS A, HOFMANN R, ALPAK FO, FREEMAN J, HUNTER S & APPEL M. 2018. Imaging and computational considerations for image computed permeability: Operating envelope of Digital Rock Physics. Advances in Water Resources, 116: 127–144.
SENA MRS. 2017. Petrofísica e caracterização mineralógica de rochas carbonáticas do Nordeste brasileiro. Master’s dissertation. Programa de Pós-Graduação em Exploração Petrolífera e Mineral, Universidade Federal de Campina Grande. Brazil. 81 pp.
SOARES JA & ANDRADE PRL. 2017. A model for permeablility of carbonate rocks based on pore connectivity and pore size. In: 15th International Congress of the Brazilian Geophysical Society & EXPOGEF.
Rio de Janeiro, Brazil, 31 July-3 August 2017, p. 977–981. Brazilian Geophysical Society.
SOARES JA & COURA RLC. 2017. Effect of grain contact and pore size on elastic velocities of carbonate rocks. In: 15th International Congress of the Brazilian Geophysical Society & EXPOGEF. Rio de Janeiro, Brazil, 31 July-3 August 2017, p. 960–965. Brazilian Geophysical Society. SOUSA WB. 2017. Simulação numérica de propagação da onda cisalhante em rochas sedimentares a partir de imagens microtomográficas de Raios X. Master’s dissertation. Programa de Pós-Graduação em Exploração Petrolífera e Mineral, Universidade Federal de Campina Grande. Brazil. 48 pp.
VAN GEET M, SWENNEN R & WEVERS M. 2000. Quantitative analysis of reservoir rocks by microfocus X-ray computerized tomography. Sedimentary Geology, 132: 25–36.
VASCONCELOS A, NOGUEIRA F, SOARES J & SOUZA F. 2016. Análises petrofísica convencional e computacional de arenitos e conglomerados deformados da Bacia Rio do Peixe. In: Rio Oil and Gas Expo and Conference 2016. Rio de Janeiro, Brazil: IBP.
VIDAL AD. 2015. Quantificação da Macro e Micro Porosidade e sua Conectividade em Rochas Carbonáticas por Microtomografia de Raios X. Trabalho de Conclusão de Curso de Engenharia de Petróleo, Universidade Federal de Campina Grande. Brazil. 19 pp.
Recebido em 25 setembro, 2018 / Aceito em 6 novembro, 2018 Received on September 25, 2018 / Accepted on November 6, 2018