209 REM, Int. Eng. J., Ouro Preto, 71(2), 209-215, apr. jun. | 2018
Metallurgy and materials
Metalurgia e materiais
Abstract
A correlative approach employing optical microscopy and scanning electron mi-croscopy is proposed for the quantification of phases and pores in iron ore pellets. Combining mosaic images covering the full cross-sections of pellets, obtained with both techniques, it is possible to improve the discrimination of pores, quartz and sili-cates. First, the images must be carefully registered to show the exact same regions. The procedure for registration, discrimination and quantification was developed with Fiji open source software. A qualitative and quantitative analysis confirmed the advan-tages of the correlative method as compared to the individual techniques.
Keywords: iron ore pellets; digital microscopy; multimodal microscopy; microstructural
characterization; image analysis; Fiji; ImageJ.
Reynel Martinez Castellanos
Doutorando
Universidade Federal do Rio de Janeiro - UFRJ Programa de Engenharia Química (PEQ) - COPPE Rio de Janeiro - Rio de Janeiro - Brasil [email protected]
Julio César Álvarez Iglesias
Pesquisador
Pontifícia Universidade Católica do Rio de Janeiro (PUC-Rio)
Departamento de Engenharia Química e de Materiais (DEQM)
Rio de Janeiro - Rio de Janeiro - Brasil [email protected]
Otávio da Fonseca Martins Gomes
Pesquisador
Centro de Tecnologia Mineral Professor
Programa de Pós-Graduação em Geociências Museu Nacional
Universidade Federal do Rio de Janeiro - UFRJ Rio de Janeiro - Rio de Janeiro - Brasil [email protected]
Karen Soares Augusto
Pesquisadora
Pontifícia Universidade Católica do Rio de Janeiro (PUC-Rio)
Departamento de Engenharia Química e de Materiais (DEQM)
Rio de Janeiro - Rio de Janeiro - Brasil [email protected]
Sidnei Paciornik
Professor-Associado
Pontifícia Universidade Católica do Rio de Janeiro (PUC-Rio) Departamento de Engenharia Química e de Materiais (DEQM)
Rio de Janeiro - Rio de Janeiro - Brasil [email protected]
Characterization of iron
ore pellets by multimodal
microscopy and image analysis
http://dx.doi.org/10.1590/0370-44672017710035
1. Introduction
The importance of microstruc-tural characterization techniques has increased in the mining and
steel industries in order to assess and control the quality of iron ore and its agglomerates in terms of
and subsequent steelmaking process. In a joint research project between PUC-Rio and Vale SA, Brazil´s larg-est mining company, new methods based on digital optical microscopy and image analysis are being devel-oped for the characterization of iron ore, sinters and pellets (Iglesias et al.,
2008; Wagner et al., 2008; Gomes et al., 2010; Iglesias et al., 2011; Gomes et al., 2013; Augusto et al., 2015).
These new methods reduced time consumption and operator depen-dency of characterization routines by automating some steps, such as image acquisition on the optical microscope, recognition of minerals, measurement of phase fractions, and determination of mineral texture and porosity. These techniques are the objects of two pat-ents and they have been in current use in Vale´s laboratories for some years (Vieira et al., 2015a and 2015b).
The main analytical technique used for the microstructural character-ization of iron ore and its agglomerates is reflected light microscopy (RLM). The most common iron oxides and oxyhydroxides can be easily recog-nized by their reflectances. However, RLM is not able to differentiate all the phases present in iron ores, sinters and pellets, since transparent minerals and the embedding resin present similar
reflectance (Neumman and Stanley, 2008). It is a classical problem in ore microscopy that in fact became a challenge. Some authors, e.g. Delbem
et al. (2015), proposed alternatives to
address it, but their solutions are not consensually accepted mainly due to reproducibility limitations. On the other hand, scanning electron micros-copy (SEM) is capable of discriminat-ing quartz and other transparent min-erals from the embedding resin, but it is not suitable to identify phases with close average atomic numbers with similar chemical composition, such as hematite and magnetite (Gomes and Paciornik, 2008). Donskoi et al. (2013) performed a comparative
study of iron ore characterization using SEM and RLM. They basi-cally concluded that although SEM systems can provide more detailed information on the gangue minerals, RLM is faster, more cost effective and more reliable for routine analysis of iron ores containing a variety of iron oxides and oxyhydroxides. In fact, a combined approach using both tech-niques may provide a comprehensive method for characterizing iron ores. A method to correlate images from RLM and SEM in order to enhance the SEM analytical capacity using reflectance (color) information was
developed by Gomes (2007). This method comprises co-localization of fields imaged in both microscopes, image registration involving rigid and non-rigid transformations and image analysis, allowing discrimination of phases that are indistinguishable in each single technique.
Some authors established semi-automatic procedures for the charac-terization of iron ore pellets through RLM and image analysis (IA), such as Wagner et al. (2008) and Nellros and
Thurley (2011). These methods use an optical microscope with a motorized stage to perform step-wise displace-ments and acquire a large set of images in order to compose a mosaic (ex-tended field) image covering an entire pellet. The mosaic image provides a useful overview of the whole pellet cross-section allowing qualitative and quantitative evaluation of the spatial distribution of porosity and phases.
This paper presents a multimodal microscopy method to discriminate and measure phases and pores in iron ore pellets. It combines mosaic im-ages obtained with RLM and SEM in order to improve the discrimination of pores, quartz and silicates. The IA procedure was developed with Fiji open source software (Schindelin et al., 2012).
2. Materials and methods
2.1 Sample preparation
The pellets were prepared at the Vale pelletizing plant in Vitória with iron ore from the Carajás mines. The approxi-mately spherical samples were cut in half and embedded in epoxy resin. They were ground using diamond impregnated metal discs with 70 µm sized diamond particles,
followed by particle sizes 40, 15 and 6 µm. This roughing was carried out with water for 2 min for the first three particle sizes and 4 min for the last one.
After roughing, the samples went through an ultrasonic bath to remove any possible residues, and prevent any
scratching during polishing. The pol-ishing steps used cloths with diamond suspensions of 3 and 1 µm for ap-proximately 1 h each. Three different iron ore pellet samples were obtained, each with a highly polished 30 mm diameter section.
2.2 Digital microscopy
Two microscopes were used for image acquisition:
a) A Zeiss AxioImager.M2m com-puter-controlled optical microscope with a digital camera (Zeiss AxioCam MRc5 – 1292 x 968 pixels) was employed. The images were acquired using a 20X objec-tive lens (EC Epiplan 20X/0.40) in the RGB mode, leading to a resolution of 0.53 µm/pixel.
b) A fully automated FEI Quanta 400 SEM with a backscattered electron detector was used. The images were acquired with 200X and 1000 x 1000 pixels, leading to a resolution of 1.23 µm/pixel.
For each pellet, sets of partially overlapping fields were imaged in both RLM and SEM in order to cover the entire sample cross-section. The
overlap-ping regions were used in an automatic correlation procedure to align adjacent field images. The mosaic covering the full cross section had 18822 x 19015 pixels in the RLM image and 9616 x 9214 pixels in the SEM image.
A reference mark in the sample was used to align it in the microscope sample holders and reduce the rotation error between acquisitions.
2.3 Image processing and analysis
All the processing and image analysis steps were performed in Fiji open source
211 REM, Int. Eng. J., Ouro Preto, 71(2), 209-215, apr. jun. | 2018
As the SEM pixel size is more than double the RLM pixel size, the first step was to interpolate pixels in the SEM image to match the digital resolution and allow further process-ing. Afterward, registration was per-formed automatically with the ImageJ
plugin Linear Stack Alignment with SIFT (Saalfeld, 2008). This procedure detects homologous points in the two images with the SIFT method (Lowe, 2004) and uses these points in a spatial transformation to match point posi-tions and register the images. In the
present case, an Affine transforma-tion (Zitova and Flusser, 2003) was used to correct translation, rotation, and residual resolution differences. After registration, it becomes possible to compare phase identification and quantification in both images.
3.2 Qualitative analysis with RLM
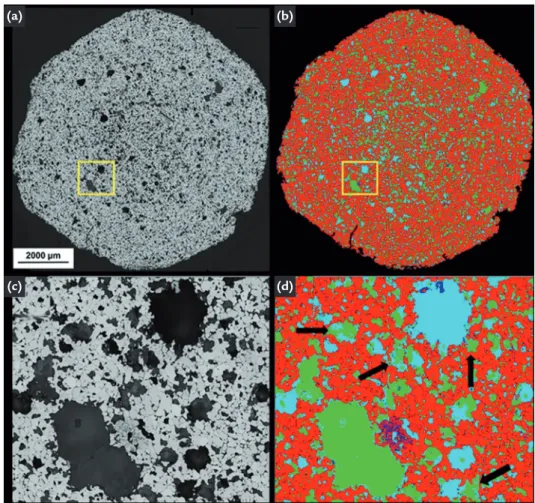
Once registered, the images were segmented to identify the phases pres-ent. In the RLM image (Figure 1a) the following phases were identified: hematite, quartz, other silicates and pores. Figure 1b shows the result of the segmentation using the following color
code (cyan = pores, green = quartz, blue = silicates and red = hematite).
Figures 1c and 1d show a small area magnified. On analyzing these fig-ures carefully (see arrows), one can con-clude that some pores filled with resin or with internal reflection were incorrectly
identified as quartz. Therefore, in RLM images, pores are underestimated while quartz is overestimated. However, the advantage of this technique is that it clearly differentiates the fine silicate particles from the pores, which is a problem in SEM images.
Although magnetite was not present in the samples used in this work, it is often
present in ore pellets. However, the RLM technique can efficiently differentiate
mag-netite from hematite, which, on the other hand is quite difficult with SEM.
3.3 Qualitative analysis with SEM
Figure 2a shows the image obtained by SEM. Figure 2b shows the segmented image with the phases identified using the same color code as RLM. A magnification (Figure 2c) of the same region chosen in RLM image shows the characteristic details of each phase, which can be iden-tified from their grey shades. Figure 2d
shows that the SEM image segmentation separates quartz from the pores filled with resin, which usually appear mixed in RLM images. The disadvantage of this technique is that as SEM offers a greater depth of focus, the shallow pores that are not filled with resin may contain particles with intermediate shades that can be
mis-taken for other silicates. Thus, the pores are also underestimated, and in this case due to the overestimation of silicates. He-matite is correctly segmented, as it appears much brighter than the other phases. The possible confusion with magnetite does not happen as these samples don´t contain this phase.
3.1 Alignment and registration of optical and SEM images
3 Results and discussion
(a) (b)
(c) (d)
Figure 1 Segmentation of the phases in a RLM
image: a) Original mosaic Image; b) Segmentation of the phases; c)
Mag-nification of the yellow rectangle in (a); d) Magnification of the same region from (b): cyan = pores, green = quartz, blue = silicates and red = hematite.
(a) (b)
(c) (d)
Figure 2
Segmentation of the phases in a SEM image: a) Original mosaic Image; b) Segmentation of the phases; c) Magnification of the yellow rectangle in (a); d) Magnification of the same region from (b): cyan = pores, green = quartz, blue = silicates and red = hematite. Arrows indicate the pores that are seg-mented as silicates.
3.4 Qualitative analysis using RLM and SEM correlated
After the separate segmentation of the phases in the RLM and SEM im-ages separately, the correlation of the two techniques was performed. Here, the same images shown in the previous subsections obtained by RLM (IRLM Figure 3a) and by SEM (ISEM Figure 3b) were used.
The following symbols will be used in the quantitative analysis: P (pores), Q
(quartz), S (silicates), (M) magnetite, H (hematite) with a subscript identifying the technique (RLM, SEM) or correlative (RLMSEM). Even though magnetite is not present in these samples, in general it must be considered. Hematite and magnetite are reliably obtained from RLM. Thus, MRLM and HRLM are accurate values. Quartz is reliably obtained from SEM,
QSEM is an accurate value. Segmenta-tion generates binary images in which the phase of interest is displayed with white pixels against a black background. Thus, arithmetic and logic operations can be performed with these images. Now, the correct fraction of pores can be obtained by combining the results of the two tech-niques (Equations 1-5):
P
RLMSEM= (P
RLMOR P
SEM)
where OR represents the union operation.
Subtracting image PRLMSEM from
image ISEM, the solid phases are obtained:
I
SEM- P
RLMSEM= Q
SEM+ S
SEM+ (M
SEM+ H
SEM)
In the SEM images hematite and
magnetite are segmented together, thus
the use of the parentheses in the above expression. But the phases are correctly
segmented in RLM, so that one can replace
them in the above expression, as follows:
I
SEM- P
RLMSEM= Q
SEM+ S
SEM+ M
RLM+ H
RLMKnowing that quartz (QSEM) is
prop-erly identified in the SEM image, it was also
subtracted from this binary image:
I
SEM- P
RLMSEM- Q
SEM= S
SEM+ M
RLM+ H
RLMFinally, the silicates, which are the most difficult phase to discriminate in SEM
, are correctly quantified (in the pres-ent samples MRLM = 0):
S
RLMSEM= I
SEM- P
RLMSEM- Q
SEM- M
RLM- H
RLM(1)
(2)
(3)
(4)
213 REM, Int. Eng. J., Ouro Preto, 71(2), 209-215, apr. jun. | 2018
The final segmentation result is shown Figure 3c using the same color code as before.
Figure 3 Correlation RLM + SEM: a) RLM ima-ge; b) SEM imaima-ge; c) Correlation of the segmented phases: cyan = pores, green = quartz, blue = silicates and red = hematite.
Figure 4 shows the same magni-fied region as in the previous images. Figures 4a and 4b, correspond to the original RLM and SEM images,
re-spectively. Figures 4c and 4d show the identification results of the phases obtained by each technique. The best phase discrimination is shown in
Figure 4e with RLM+SEM correlated.
Here we can clearly see that quartz and silicates are much better separated from the pores.
(a) (b)
(c)
(a) (b)
(c) (d)
(e)
Figure 4 Magnified regions of the previous figures: a) Magnified region from RLM; b) Magni-fied region from SEM; c) MagniMagni-fied region
segmented, RLM; d) Magnified region segmented, SEM; e) Magnified region segmented and correlated (RLM + SEM). cyan = pores, green = quartz, blue = sili-cates and red = hematite. Arrows indicate
3.5 Quantitative analysis of results
Although the qualitative analysis has only shown the images of one pellet, in fact, in this study 3 iron ore pellets
were analyzed. The different fractions of each of the phases present in the 3 pellets analyzed (P1, P2, P3) were quantified from
RLM, SEM and the RLM + SEM correlative
images using the exact same procedure. The results are shown in Figure 5.
Figure 5
Phase fractions (%) for 3 iron ore pellets (P1, P2, P3) analyzed with the separate techniques (RLM and SEM) and their correlation (RLM + SEM).
These results support the qualitative analysis. The quartz fraction is higher in the 3 pellets measured by RLM, due to
the fact that the pores filled with resin are misinterpreted as particles of quartz, underestimating the area of pores and overestimating the amount of quartz.
The silicate fractions are greater in the SEM images than in the RLM
im-ages. This is because shallow pores have been incorrectly segmented as silicates.
Therefore, in this technique the area of the pores is also underestimated and the silicates overestimated.
The pore fractions measured by the correlative technique are higher for the 3 pellets, showing the tendency of this technique to correct the underestimated pore values. In turn, the quartz areas are similar to those obtained in the segmen-tation of the SEM images, eliminating
the overestimation of quartz from the
RLM result. A similar correction of the
silicates also takes place with the correla-tive technique.
The values found for hematite are similar for the 3 techniques for the 3 pellets. This phase does not present any problems of identification in either of the two techniques (for SEM because of the
absence of magnetite, in this case) having a well-defined peak in the histogram, which facilitates its segmentation.
4. Conclusion
The phases present in the optical images of iron ore pellets can be identi-fied due to their reflectance character-istics. However, the main problem of this technique lies in the limitation to differentiate the quartz from pores that are filled with resin. On the other hand, this technique correctly identifies the silicate regions without misidentifying them for pores as in the SEM technique. Also, if the iron ore contains magnetite
then the optical technique can be used to discriminate it from hematite, since these two phases are hardly distinguish-able with SEM.
The images obtained by SEM have
the advantage of differentiating quartz correctly from the rest of the phases without creating confusion with the resin-filled pores. The disadvantage of this technique is that some pores can be misidentified as silicates, thus
underesti-mating the porosity.
Both RLM and SEM have
advan-tages and limitations. Correlating the two techniques to analyze the micro-structure of a pellet provides better iden-tification of the mineral phases and the pores with more accurate measurements than each of the techniques separately. This approach combines the advantages of both techniques providing results with a lower margin of error.
Acknowledgements
The authors thank Vale for the material provided for this work, and CNPq and FAPERJ for the financial support.
References
AUGUSTO, K. S., IGLESIAS, J. C. A., DURAND, L. D., GOMES, O. D. M., PI-ROTTE, D., DOMINGUES, A. L. A., VIEIRA, M. B., PACIORNIK, S. Auto-matic classification of hematite in iron ore. In: INTERNATIONAL CONGRESS FOR STEREOLOGY AND IMAGE ANALYSIS, 14. 2015. Liège. Proceedings…
Prague: International Society for Stereology & Image Analysis, 2015.
DELBEM, I. D., GALÉRY, R., BRANDÃO, P. R. G., PERES, A. E. C. Semi-auto-mated iron ore characterisation based on optical microscope analysis: quartz/resin classification. Minerals Engineering, v. 82, p. 2-13, 2015.
215 REM, Int. Eng. J., Ouro Preto, 71(2), 209-215, apr. jun. | 2018
J., HAPUGODA, S. Comparative study of iron ore characterisation using a scan-ning electron microscope and optical image analysis. Trans. Inst. Min. Metall. (Sect. B: Appl. Earth Sci.), v. 122, n. 4, p. 217-29, 2013.
GOMES, O. D. M. Microscopia co-localizada: novas possibilidades na carac-terização de minérios. Rio de Janeiro: Catholic University of Rio de Janeiro
(PUC-Rio), 2007. 2007. 103 p. (D.Sc. Thesis in Metallurgical and Materials Engineering in Portuguese).
GOMES, O. D. M., IGLESIAS, J. C. A., PACIORNIK, S., VIEIRA, M. B. Classifi-cation of hematite types in iron ores through circularly polarized light microscopy and image analysis. Minerals Engineering, v. 52, p. 191-7, 2013.
GOMES, O. D. M., PACIORNIK, S. Iron ore quantitative characterization throu-gh reflected lithrou-ght-scanning electron co-site microscopy. In: INTERNATIONAL CONGRESS ON APPLIED MINERALOGY, 9, 2008. Brisbane. Proceedings…
Carlton: AusIMM, 2008. p. 699-702.
GOMES, O. D. M., PACIORNIK, S., IGLESIAS, J. C. A. A simple methodology for identifying hematite grains under polarized reflected light microscopy. In: INTER-NATIONAL CONFERENCE ON SYSTEMS, SIGNALS AND IMAGE PRO-CESSING – IWSSIP, 17. 2010. Rio de Janeiro. Proceedings… Niterói: EdUFF,
2010. p. 428-31.
IGLESIAS, J. C. A., GOMES, O. D. M., PACIORNIK, S. Automatic recognition of hematite grains under polarized reflected light microscopy through image analysis.
Minerals Engineering, v. 24, n. 12, p. 1264-70, 2011.
IGLESIAS, J. C. A., WAGNER, D. T., SCHINAZI, G., GOMES, O. D. M., MAU-RÍCIO, M. H. P., PACIORNIK, S., VIEIRA, M. B. Qualitative and quantitative evaluation of iron ore sinters through digital microscopy. In: INTERNATIONAL CONGRESS ON APPLIED MINERALOGY, 9, 2008. Brisbane. Proceedings…
Carlton: AusIMM, 2008. p. 669-672.
LOWE, D. G. Distinctive image features from scale-invariant keypoints.
International Journal of Computer Vision, v. 60, n. 2, p. 91-110, 2004.
NELLROS, F., THURLEY, M. J. Automated image analysis of iron-ore pellet structu-re using optical microscopy. Minerals Engineering, v. 24, n. 14, p. 1525-31, 2011.
NEUMANN, R., STANLEY, C. J. Specular reflectance data for quartz and some epoxy resins: implications for digital image analysis based on reflected light optical microscopy. In: INTERNATIONAL CONGRESS ON APPLIED MINERALO-GY, 9, 2008. Brisbane. Proceedings… Carlton: AusIMM, 2008. p. 703-706.
SAALFELD, S. (2008). Linear Stack Alignment with SIFT. Available at: https://imagej.net/Linear_Stack_Alignment_with_SIFT
SCHINDELIN, J., ARGANDA-CARRERAS, I., FRISE, E., KAYNIG, V., LON-GAIR, M., PIETZSCH, T., PREIBISCH, S., RUEDEN, C., SAALFELD, S., SCHMID, B., TINEVEZ, J. Y., WHITE, D. J., HARTENSTEIN, V., ELICEI-RI, K., TOMANCAK, P., CARDONA, A. Fiji: an open-source platform for biological-image analysis. Nature methods, v. 9, n. 7, p. 676-82, 2012.
VIEIRA, M. B., PACIORNIK, S., GOMES, O. D. M., AUGUSTO, K. S., BORGES, A. A. M. Automatic classification of the degree of maturation for iron ore pellets.
2015a. (United States Patent 9207185).
VIEIRA, M. B., PACIORNIK, S., GOMES, O. D. M., IGLESIAS, J. C. A., BORGES, A. A. M. Automatic morphometry and classification of crystals of iron oxides. 2015b. (United States Patent 9121813).
WAGNER, D. T., ROUCO, H. V., GOMES, O. D. M., PACIORNIK, S., VIEIRA, M. B. Iron ore pellet characterization through digital microscopy. In: INTERNA-TIONAL SYMPOSIUM ON IRON ORE, 2. 2008. São Luís. Annals… São Paulo:
ABM, 2008. p. 231-6.
ZITOVA, B., FLUSSER, J. Image registration methods: a survey. Image and Vision Computing, v. 21, n. 11, p. 977-1000, 2003.