INTRODUCTION
Seagrasses are recognized as important habitat-modifying or facilitator species because they create spatially complex structure, enhance supply and reten-tion of propagules, and increase resource supply for a variety of associated species (Bruno & Bertness 2001, Williams & Heck 2001). Their facilitator status is tem-pered, however, by the fact that seagrass meadows have suffered dramatic declines worldwide during the past 25 years through a combination of natural and anthropogenic deterioration (Short & Wyllie-Echever-ria 1996, Hemminga & Duarte 2000, Green & Short 2003). Effective management of threatened seagrass
populations requires population genetic information with regard to dispersal, genetic neighborhood size and diversity (Reusch 2001a).
All seagrass species reproduce sexually through seeds and vegetatively through production of horizon-tal rhizomes and leaf shoots (Den Hartog 1970). Sexual reproduction, however, is thought to be constrained because of hydrophilous pollination of flowers, limited dispersal of pollen and seeds, limited outcrossing rates associated with extensive clonal growth, and low sur-vivorship of seeds and seedlings (Les 1988, Laushman 1993, Hemminga & Duarte 2000, Reusch 2001b). This life-history bottleneck, in combination with extensive clonal (vegetative) growth, led to the prediction that
© Inter-Research 2004 · www.int-res.com *Email: [email protected]
Population genetics of dwarf eelgrass
Zostera noltii
throughout its biogeographic range
J. A. Coyer
1,*, O. E. Diekmann
2, E. A. Serrão
2, G. Procaccini
3, N. Milchakova
4,
G. A. Pearson
2, W. T. Stam
1, J. L. Olsen
11Department of Marine Biology, Centre for Ecological and Evolutionary Studies, University of Groningen,
9750 AA Haren, The Netherlands
2CCMAR, Center for Marine Sciences, FCMA, University Algarve, Gambelas, 8005-139 Faro, Portugal 3Stazione Zoologica, ‘Anton Dohrn’, Laboratorio di Ecologia del Benthos, Punta S. Pietro, 80077 Ischia (Napoli), Italy
4Department of Phytobenthos, Institute of Biology of the Southern Seas, Sevastopol 99011, Crimea, Ukraine
ABSTRACT: The marine angiosperm Zostera noltii (dwarf eelgrass), an important facilitator species and food source for invertebrates and waterfowl, predominantly inhabits intertidal habitats along eastern Atlantic shores from Mauritania to southern Norway/Kattegat Sea and throughout the Mediterranean, Black and Azov seas. We used 9 microsatellite loci to characterize population struc-ture at a variety of spatial scales among 33 populations from 11 localities throughout the entire biogeographic range. Isolation by distance analysis suggested a panmictic genetic neighborhood of 100 to 150 km. At the global scale, a neighbor-joining tree based on Reynolds distances revealed strongly-supported groups corresponding to northern Europe, Mauritania and the Black/Azov Sea; separate Mediterranean and Atlantic-Iberian groups were poorly supported. Clones (genets with multiple ramets) were present in most populations but were generally small (ca. < 3 m2). Exceptions were found in Mauritania (ca. 29 m in length), the Azov Sea (ca. 40 m in length) and the Black Sea (ca. 50 m in length). Although genetic diversity and allelic richness generally decreased from Mauri-tania to Denmark, the putative post-glacial recolonization route, both were unexpectedly high among populations from the German Wadden Sea.
KEY WORDS: Seagrasses · Zostera noltii · Genetic structure · Clonality · Genets · Ramets · Ice age · Microsatellites · Phylogeography
seagrass meadows would harbor low clonal diversity and be strongly structured with little gene flow (Les 1988, Barrett et al. 1993, Hemminga & Duarte 2000).
Recent findings of DNA-based population genetic studies, however, reveal that subtidal seagrass popula-tions can vary widely in these population parameters. For example, genet size ranged from single shoots to large patches (10s of m) to entire meadows (100 to 1000 m) (Waycott 1995, Kirsten et al. 1998, Procaccini & Mazzella 1998, Reusch et al. 1999a, 2000, Ruggiero et al. 2002, Billingham et al. 2003) and populations dis-played weak to excessively positive (heterozygous deficiency) or negative (heterozygous excess) devia-tions from Hardy-Weinberg Equilibrium (HWE) (Pro-caccini & Mazzella 1998, Reusch et al. 2000, Pro(Pro-caccini et al. 2002, Billingham et al. 2003). Furthermore, some populations of the subtidal eelgrass Zostera marina separated by 33 to 54 km displayed non-significant dif-ferentiation, presumably because of connectivity due to rafting reproductive shoots (Reusch 2002). Variable population subdivision and isolation by distance have been detected among populations of several seagrass
species (see review by Reusch 2001a) and in Z. marina (Olsen et al. 2004).
The dwarf eelgrass Zostera noltii is widely distrib-uted along the Atlantic shores of Europe from temper-ate southern Norway to tropical Mauritania, as well as throughout the Kattegat, Mediterranean, Black, Azov, Caspian and Aral Seas (Green & Short 2003). It is one of the few seagrass species that is predominantly inter-tidal, although it also occurs subtidally in brackish waters of the Kattegat Sea and along the Mediter-ranean coast (Den Hartog 1970), often co-occurring with Z. marina and Cymodocea nodosa, respectively.
Several studies of Zostera noltii along the coasts of Italy and The Netherlands concluded that sexual reproduction was unimportant relative to asexual re-production (Hootsmans et al. 1987, Harrison 1993, Philippart 1995, Curiel et al. 1996) and high seed pro-duction (9000 seeds m–2) did not correspond to the very low number of seeds (0 to 150 m–2) actually observed in the sediments (Hootsmans et al. 1987). Additionally, the specific requirements of low salinity and tegument incision for seed germination, combined with the high seed and seedling mortality, and rare seedling occur-rence observed at sites in the Mediterranean and The Netherlands, further suggested that seeds and sexual reproduction were of minor importance in propagating Z. noltii (Den Hartog 1970, Jacobs et al. 1983, Hoots-mans et al. 1987, Vermaat et al. 1987, Loques et al. 1990, Philippart 1995, Vermaat & Verhagen 1996). More recently, however, up to 1000 seeds m–2 have been found in sediments off the German coast (Sylt) in October (Ehlers 2002), thereby questioning the gener-ality of earlier findings.
In the present study, we ask: (1) How does geo-graphic scale influence levels of diversity and connec-tivity of Zostera noltii populations? (2) Do latitudinal and longitudinal patterns of genetic and allelic diver-sity reflect recolonization pathways from southern refugia since the Last Glacial Maximum (LGM)? (3) To what extent does an intertidal existence influence genetic structure and isolation by distance? We approach the questions using microsatellite DNA poly-morphisms to first assess population-level diversity at the meter to thousands-of-kilometers scale, then deter-mine population disjunctions and putative gene flow between populations using neighbor-joining (NJ) analysis of pairwise genetic distances and a stepping-stone model of gene flow (isolation by distance).
MATERIALS AND METHODS
Sampling sites and collections. 1 to 8 populations were sampled at each locality (Fig. 1, Table 1) by walk-ing along a linear transect and collectwalk-ing 45 to 50 indi-Fig. 1. Zostera noltii. Localities and populations sampled.
Par-enthetical values indicate the number of populations sampled within each locality. Sylt is an island connected by a narrow causeway to mainland Germany (on the map, thin line to right) near the German-Danish border. For reference, the lo-cations of population 4 at Zeeland and Sylt are 51° 33’ N,
Population (n) All genets Genets = 28
Hexp Hobs α No. G/N Genets with Ramets FIS Hexp Hobs α FIS
genets >1 ramet sampled in sample genet–1 DENMARK Myrbjerg (40) 0.376 0.325 5.2 39 0.97 1 2 0.150* 0.369 0.325 4.6 0.135 Ellinge (37) 0.415 0.420 5.1 37 1.00 – – 0.001 0.409 0.417 4.7 –0.001 Ølstad (39) 0.339 0.297 4.2 37 0.95 2 2 0.136 0.356 0.329 3.8 0.092 GERMANY Sylt-1 (40) 0.623 0.642 7.0 36 0.90 4 2 –0.017 0.628 0.647 6.7 –0.011 Sylt-2 (50) 0.615 0.620 7.0 26 0.52 11 2–5 0.012 – – – .– Sylt-3 (46) 0.630 0.633 7.7 40 0.87 6 2 0.007 0.630 0.647 7.2 –0.008 Sylt-4 (50) 0.614 0.634 7.2 31 0.62 13 2–4 –0.017 0.615 0.635 7.2 –0.015 Sylt-5 (49) 0.630 0.596 7.1 30 0.61 9 2–9 0.070 0.635 0.595 6.9 0.081 Sylt-6 (50) 0.675 0.667 8.7 39 0.78 8 2–4 0.026 0.651 0.627 7.8 0.056 Sylt-7 (50) 0.642 0.616 8.3 46 0.92 4 2 0.051 0.625 0.611 7.4 0.040 Sylt-8 (49) 0.651 0.643 8.4 43 0.88 6 2 0.024 0.628 0.627 7.3 0.020 THE NETHERLANDS Groningen-1 (227)a 0.526 0.490 4.8 22 0.10 13 2–20 0.091 – – – – Groningen-2 (44)b 0.592 0.584 6.6 43 0.97 1 2 0.025 0.603 0.579 6.0 0.057 Zeeland-1 (50)c 0.491 0.490 5.6 46 0.92 4 2 0.012 0.490 0.460 4.7 0.078 Zeeland-2 (47)c 0.437 0.465 4.4 44 0.94 3 2 –0.052 0.444 0.488 3.9 –0.082 Zeeland-3 (49)c 0.463 0.500 4.6 44 0.90 5 2 –0.070 0.457 0.528 4.0 –0.137* Zeeland-4 (43)c 0.450 0.450 4.7 43 1.00 0 – 0.013 0.442 0.432 4.4 0.039 Zeeland-5 (50)c 0.474 0.472 5.3 48 0.96 2 2 0.015 0.447 0.429 4.4 0.060 Zeeland-6 (50)d 0.167 0.163 1.6 17 0.34 11 2–11 0.050 – – – – PORTUGAL Rio Mondego (48) 0.579 0.556 5.7 35 0.73 7 2–6 0.054 0.591 0.560 5.6 0.071 Ria Formosa (48) 0.632 0.635 5.9 28 0.58 7 2–12 0.015 0.632 0.635 5.9 0.015 MAURITANIA Mauritania-1 (49)e 0.639 0.722 4.7 10 0.20 4 2, 2, 10, 29 –0.078 – – – .– Mauritania-2 (45)e 0.597 0.566 7.2 42 0.93 3 2 0.063 0.602 0.568 6.3 0.075 Mauritania-3 (50)f 0.574 0.648 6.3 36 0.72 8 2–4 –0.115* 0.583 0.659 6.2 –0.113* SPAIN Port Lligat (36) 0.475 0.457 4.4 35 0.97 1 2 0.053 0.467 0.464 4.3 0.024 ITALY Caprolace (31) 0.533 0.614 3.6 17 0.55 5 2–5 –0.124 – – – .– UKRAINE Black Sea-1 (49)g 0.526 0.545 4.8 43 6 2–3 –0.026 0.501 0.524 4.2 –0.027 Black Sea-2 (49)h 0.511 0.483 4.9 49 1.00 0 – 0.065 0.522 0.476 4.3 0.106 Black Sea-3 (47)i 0.279 0.556 1.6 1 0.02 1 47 0.000 – – – .– Black Sea-4 (50)j 0.578 0.622 5.7 35 0.70 11 2–6 –0.063 0.573 0.623 5.6 –0.069 Black Sea-5 (49)k 0.387 0.347 4.2 42 0.86 3 2, 3, 5 0.116 0.368 0.333 3.9 0.113 Azov Sea-1 (46)l 0.624 0.502 6.6 31 0.67 7 2–6 0.218* 0.626 0.508 6.1 0.206* Azov Sea-2 (49)m 0.506 0.667 2.9 3 0.06 2 8, 40 –0.125 – – – .–
aInner Emmapolder; bouter Emmapolder; cOosterschelde; dWesterschelde; einner Banc d’Arguin; fouter Banc d’Arguin; gKazachya Bay, Sevastopol; hTiligul coastal lake; iOdessa City Beach; jFonar Cape, Kerch Strait, eastern Crimea; kSukhoy
Liman; lMolochny Liman; mUtlyuk Liman
Table 1. Zostera noltii. Genetic variability and FIS(ƒ) estimates for all 9 microsatellite loci. The total number of individuals
col-lected is presented in column 1; Hexp, Hobsand the average number of alleles per locus (α) were calculated for all genets
(col-umn 5), as well as for a standardized genet sample size of 28. Hexp =Nei’s gene diversity and * indicates significant departure from
0 (HWE) after sequential Bonferroni adjustment of Type I error level (Rice 1989); G/N = number of genets divided by total number of shoots
viduals at ca. 1 m intervals or randomly along a 60 × 20 m transect (for the Iberian populations). The popu-lations in Denmark and Italy were collected in the sub-tidal. Separately, 80 randomly selected individuals were mapped (using triangulation techniques) and collected from two 10 × 25 m2plots at Sylt (separated by 800 m near population S-5) and one 10 × 15 m2plot near Zeeland-4. In all cases, collection entailed the removal of 2 to 3 leaves from a shoot. Leaves were blot-ted dry, cut into smaller pieces and placed into 1.7 ml plastic tubes filled with silica crystals for rapid dehydration and subsequent storage.
DNA extraction and microsatellite development. Template DNA for PCR reactions utilizing 9 micro-satellite primers (Coyer et al. 2004) was obtained from 2 to 3 pieces (5 to 10 mm in size) of silica-dried leaves. Procedures for DNA extraction, PCR amplification and determination of genotypes with an automated sequencer are described in Coyer et al. (2004).
Data analysis. As for all seagrasses, an individual plant or genet (genetic individual) consists of several shoots or ramets (morphological individuals arising from vegetative reproduction) (Harper 1977). The dis-tinction is important, as inclusion of several ramets into population analyses is equivalent to resampling genets, leading to spurious positive deviations from HWE and downwardly-biased estimates of genetic diversity (Reusch et al. 1999b, Reusch 2001a). As our microsatellite analysis (9 loci) could distinguish genets (unique multilocus genotype) from ramets (identical multilocus genotypes), all analyses were conducted on genets only.
Descriptive statistics of the within-locality and among-locality genetic diversity (number of alleles; observed heterozygosity, Hobs; Nei’s gene diversity, Hexp) (Nei 1978), as well as estimators of FIS and FST (Wright 1969) as ƒ and θ, (Weir & Cockerham 1984) and linkage disequilibrium were calculated using the GENETIX 4.02 program (http://www.univ-montp2.fr/ ~genetix/genetix/genetix.htm) (Belkhir et al. 2001). The significance of all ƒ, θ and linkage disequilibrium estimates was tested using permutations (N = 2000, 2000 and 10 000, respectively) and sequential Bonfer-roni corrections (Rice 1989).
Populations that have experienced a recent reduc-tion in effective populareduc-tion size (bottleneck) exhibit a faster decrease in allele numbers than in gene diver-sity at polymorphic loci (Cornuet & Luikart 1996). Thus, in recently bottlenecked populations, the observed gene diversity is higher than the expected gene diversity. The probability of a given population resulting from a recent bottleneck was calculated for Zostera noltii using the BOTTLENECK 1.2 program (http://www.montpellier.inra.fr/URLB/bottleneck/ bottleneck.html) (Cornuet & Luikart 1996). The
Two-phased Model (TPM) of mutation was used in the pro-gram as it is more appropriate for microsatellite data sets which are intermediate between the Infinite Alle-les Model and Stepwise Mutation Model (Di Rienzo et al. 1994). Default values of TPM variance and proba-bility for 9 microsatellite loci were applied and tested with a Wilcoxon Sign-Rank Test, which provides higher statistical power for small sample sizes (Cornuet & Luikart 1996). Estimates of allelic richness after rarefaction were obtained with the CONTRIB program (http://www. pierroton.inra.fr/genetics/labo/Software/Contrib) (Petit et al. 1998). The program requires input of haplotypes; consequently, sample sizes for all populations (Mauri-tania-1, Black Sea-3 and Azov Sea-2 were not used as all had small genet sizes because of very large clones) were doubled (haplotype = allele) and the rarefaction size was selected to be smaller than the smallest haplotype or population size (Petit et al. 1998).
To test for isolation by distance (IBD) (Wright 1943, Slatkin 1993), estimates of FST/1–FST (Rousset 1997) using the θ estimator (Weir & Cockerham 1984) in GENETIX 4.02 were correlated with the log of geo-graphical distance (1-dimensional stepping stone model) using matrix correlation methods based on the Mantel test (Manly 1994) in the IBD 1.2 program with 10 000 randomizations (http://www.bio.sdsu.edu/pub/ andy/IBD.html) (Bohonak 2002). The strength of the isolation by distance relationship was determined with reduced major axis (RMA) regression, which is more appropriate than standard ordinary least squares regression when the independent axis (geographic distance) is measured with error (Sokal & Rohlf 1981, Hellberg 1994), and calculated with IBD 1.2 (Bohonak 2002).
Pairwise distances among all population pairs were calculated from allele frequency data using Reynolds distances, which is a direct function of FSTestimates, (Reynolds et al. 1983) in GENDIST. Neighbor-joining was used to construct the tree in NEIGHBOR, whereas bootstrap resampling (2000 replications) was per-formed using SEQBOOT and CONSENS. All programs are part of PHYLIP 3.5 (http://evolution.genetics. washington.edu/phylip.html) (Felsenstein 1994).
RESULTS
Genetic diversity
We identified 195 alleles from the genotypes of 1118 genets obtained with 9 microsatellite loci. A sam-ple size of ca. 30 genets was adequate to assess allelic diversity, based on a general flattening of the curve when plotting mean number of alleles locus–1 versus
number of genets (Fig. 2). Using a standardized sample of 28 genets (Sylt-2, Groningen-1, Zeeland-6, Maurita-nia-1, Caprolace and Black Sea-3 were not included in this analysis because genet size was < 28), the 7 popu-lations from the island of Sylt were most diverse, col-lectively over 60% higher (mean number of alleles locus–1, SD: 7.21, 0.35) than the least
diverse groups consisting of 5 Zeeland (4.28, 0.33) and 3 Danish populations (4.37, 0.49) (Table 1). When all genets and populations were used, the sample-size-independent, non-biased estimate of Hexp(mean, SD) for Sylt (0.645, 0.021) was 54 and 69% higher than for the Zee-land (0.419, 0.122) and Denmark (0.381, 0.038), respectively. The lowest diversity values were recorded at the Wester-schelde site in the Netherlands (Zeeland-6; 1.56, 0.167) and Odessa City Beach (Black Sea-3; 1.56, 0.279), the latter being a single large genet or clone con-sisting of a single genotype for all 47 ramets sampled.
Genetic diversity and allelic richness of Zostera noltii populations (rarefaction = 40) generally declined from low to high latitudes along the eastern Atlantic coastline from Mauritania (putative glacial refugium) to Denmark (Fig. 3). The Sylt and Groningen populations, however, revealed values of Hexp and mean number of alleles locus–1that were higher than the general trend and allelic richness for the Sylt populations also was
higher than the general trend. No pattern in genetic di-versity and allelic richness (rarefaction = 30) was ob-served as a function of longitude from the southern At-lantic (Mauritania, Ria Formosa) into the Mediterranean (Port Lligat, Caprolace) and the Black Sea/Azov Sea regions (Fig 3).
The Black/Azov Sea and Port Lligat localities were characterized by high proportions of unique alleles (30 and 28%, respectively), followed by Mauritania (20%) and Sylt (19%) (Table 2). Other localities had 3-to 10-fold fewer unique alleles.
Deviations from HWE and linkage disequilibrium Significant heterozygote deficiencies (FIS) were noted in 2 populations, Denmark-M (0.150) and Azov Sea-1 (0.218), whereas a heterozygote excess was recorded in Mauritania-3 (–0.115) (Table 1). Signifi-cant linkage disequilibrium was not observed among the 9 loci for any population (10 000 permutations; all p≥ 0.12).
Clone architecture
Genotyping of the mapped individuals within two 250 m2plots at Sylt and one 150 m2plot at Zeeland
re-Number of genets
0 5 10 15 20 25 30 35 40 45 50
Mean no. alleles locus
–1 0 2 4 8 Zeeland-6 10 6
Fig. 2. Zostera noltii. Mean number of alleles locus–1 and
number of genetic individuals (genets). Vertical line indicates minimum number of genets necessary (30) to capture allelic diversity using the 9 microsatellite loci. The dashed line represents the relationship for an anomalous population at
Zeeland (see text)
Hexp (non-biased) 0.3 0.4 0.5 0.6 0.7 0.8 Alleles locus –1 0 2 4 6 8 Latitude 10 20 30 40 50 60 Allelic richness 0 2 4 6 8 Others Sylt Groningen N = 28 N = 17 Longitude –20 –10 0 10 20 30 40 Rarefaction = 40 Rarefaction = 30
Fig. 3. Zostera noltii. Genetic diversity estimators as a function of latitude
and longitude. The analysis using Hexpincorporated all genets (excluding
clones) for each population, whereas the analysis using the number of alleles locus–1employed a standardized sample of 28 (latitude) or 17
(longi-tude). Allelic richness was computed using rarefaction samples of 40 (latitude) or 30 (longitude) (Petit et al. 1998)
vealed the presence of 9 to 15 clones, most projected to be ≤3 m2in size (Fig. 4). Although many unique geno-types were recorded in the plots, it should not be in-ferred that these shoots represented single-ramet genets as it was impossible to genotype all individual shoots in the plots. Consequently, the number of clones we measured is likely to be an underestimate, but the lack of spatial domination by a single clone remains a valid observation. Our clone map also revealed that most clones at Sylt and Zeeland were contiguous. Frag-mentation and/or possible reattachment was suggested by only 1 clone at Sylt-1 (symbol Z; in Fig. 4), with ram-ets separated by ca. 6 m. No clones were common to both plots at Sylt, which were separated by ca. 800 m.
Analysis of individuals at 1 m intervals along a ca. 50 m linear transect line revealed that clones were pre-sent in all populations except Denmark-E, Zeeland-4, and Black Sea-2 (Table 1). The majority of clones were small, represented in the sample by 2 to 5 ramets, but large clones were observed at Groningen-1 (20 ramets sampled), Mauritania-1 (29 ramets sampled), Azov Sea-2 (40 ramets sampled) and Odessa City Beach (Black Sea-3), where all 47 ramets collected along the transect line were from a single genet.
Population differentiation and isolation by distance
Pairwise estimates of θ were used to estimate genetic differentiation among the 33 populations (matrix avail-able from authors on request). No significant differen-tiation (θ) (p ≤ 0.05) was detected among: the 8 Sylt populations (0.0004 to 0.0142; 2 to 78 km); Zeeland-2, -3,-4,-5 (0.002 to 0.010; 2 to 7 km); Groningen-1 and -2 (0.006; 0.2 km); Mauritania-1 and -3 (0.055; 9 km); Black Sea-3 (clone) with Black Sea-1,-2,-4,-5 (–0.007 to 0.126; 18 to 550 km), Azov Sea-2 with Azov Sea-1 and
Locality (genets) Locus Alleles %
ZnB1 ZnB3 ZnB8 ZnD6 ZnE7 ZnF8 Znf11 ZnH8 ZnH10 Unique Total
(19) (22) (23) (27 (26) (17) (22) (20) (21) 83 197 42.1 Denmark (113) –/10 –/10 –/4 –/5 1/6 –/5 –/5 –/5 –/4 1 54 1.8 Sylt (291) 4/16 –/16 5/11 –/6 6/14 –/10 3/12 2/11 –/10 20 106 18.9 Groningen (65) –/11 1/10 –/5 ––– –/5 –/6 –/4 2/8 –/7 3 56 5.3 Zeeland (242) –/7 –/12 –/2 –/5 –/9 1/8 –/4 –/5 –/7 1 59 1.7 Rio Mondego (35) –/8 –/7 –/5 –/4 –/1 1/5 –/5 –/4 1/9 2 48 4.2 Ria Formosa (28) –/6 –/8 1/4 –/6 –/2 –/5 –/6 –/6 1/8 2 51 3.9 Mauritania (88) 1/11 1/11 2/6 5/11 3/13 1/7 1/7 –/6 2/6 16 78 20.5 Port Lligat (35) –/2 –/5 4/7 4/9 –/1 –/5 –/4 3/4 –/2 11 39 28.2 Caprolace (16) –/3 –/3 1/3 –/2 1/2 –/3 –/3 –/1 –/2 2 22 9.1
Black Sea/Azov Sea (204) 1/10 1/9 1/8 6/14 2/4 3/11 6/13 3/8 2/6 25 83 30.1
Table 2. Zostera noltii. Locality and unique alleles. Parenthetical values for locality indicate the number of genets; for loci, the total number
of alleles observed. Listed for each locality are the number of unique alleles/total number of alleles for each locus and the percentage of unique alleles (all loci) relative to the total number of alleles (all loci)
Zeeland (9 clones) 0 5 10 15 20 25 Distance (m) 0 5 10 15 20 Sylt-2 (10 clones) 0 5 10 15 20 Sylt-1 (15 clones) 0 5 10 15 20 Distance (m)
Fig. 4. Zostera noltii. Size and spatial arrangement of genets.
Each individual was mapped and individuals with identical multilocus genotypes (9 microsatellite loci) were considered ramets (morphological individuals) of the same genet (genetic individual). Unique genotypes (single genets) are indicated by +; clones (multiple ramets) are identified by various sym-bols. A symbol in one panel does not imply relatedness to the same symbol used in another panel and no clones were com-mon to Sylt-1 and -2. The open area in the center of the upper
Black Sea-4 (–0.012, 0.090; 30, 160 km), and Den-mark M with Ø/E (0.012, 0.018; 4, 10 km). All other population pairs exhibited significant differentiation, with θ ranging from 0.033 (7 km, Denmark Ø and M) to 0.800 (ca. 8000 km, Zeeland-6 and Black Sea-3).
Significant (Mantel test) IBD was observed in northern Europe (p ≤ 0.001) and the Black Sea/Azov Sea region (p ≤ 0.008) (Fig. 5), each of which formed a distinct biogeographic cluster (see Fig. 6 and below). In northern Europe, pairwise separation dis-tances ranged from 0.2 to 1400 km and genetic dif-ferentiation increased markedly only at distances ≥100 to 150 km. As no IBD was detected ≤100 km, the panmictic unit was estimated to be 100 to 150 km. No IBD was observed among 5 populations at Zeeland (population 6 was ignored, see Table 1, Fig. 2) (1 to 18 km, p = 0.06) and 8 populations at Sylt (2 to 74 km, p = 0.77). The near significant relationship among Zeeland populations, however, might become signif-icant with additional samples (see also Fig. 6).
Pairwise separation distances for Black Sea/Azov Sea populations were less comprehensive (20 to 800 km) than for northern Europe. Nevertheless, the panmictic unit may be similar in size, as the slope of the relationship for the Black Sea/Azov Sea region (0.158) was nearly identical to that of northern Europe (0.148).
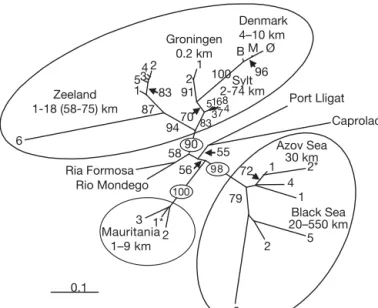
Global relationships among geographically distinct populations
A neighbor-joining analysis based on Reynolds dis-tance revealed 3 highly resolved clusters tightly cou-pled to geographic areas: northern Europe (bootstrap = 91), Mauritania (bootstrap = 100) and the Black/Azov Seas (bootstrap = 98) (Fig. 6). The relative position of the major clusters in the unrooted tree also corre-sponded to geographic orientation, as the 2 Mediter-ranean localities were intermediate to northern Europe and the Black/Azov Seas, and the 2 Portuguese locali-ties were intermediate between northern Europe and the Mauritania/Mediterranean sites.
All of the northern European localities were highly resolved (bootstrap = 82 to 100), as were some popula-tions within Zeeland (bootstrap = 84) and Denmark (bootstrap = 96) (Fig. 6). The Zeeland-6 population was more differentiated from other Zeeland populations (bootstrap = 86) than all Sylt populations were from each other, and from the Azov Sea/Black Sea-1 and 4 populations (all separated by equivalent distances). The distinction of the Zeeland-6 population, however, was not due to a recent reduction in effective popula-tion size or bottleneck (2-phased model of mutapopula-tion, Wilcoxon sign-rank test, p = 0.41).
Log distance (km) 0.0 0.2 0.4 0.6 Northern Europe (p < 0.001, r = 0.83) 0.1 1 10 100 1000 10000 0.0 0.2 0.4
Black Sea/Azov Sea (p < 0.008, r = 0.50) 0.6
θ
/1-θ
Fig. 5. Isolation by distance. Pairwise comparisons of genetic and log geographic distance among northern European (N = 18) and Black Sea/Azov Sea (N = 7) populations. The genetic and log geographic distance matrices were compared with the Mantel test and 10 000 randomizations (Bohonak 2002); p-values and r (correlation between 2 matrices, ranging from –1 to +1) are given in the figure. Estimates of slope, intercept and r2 of the relationships were calculated using reduced major
axis (RMA) regression (Bohonak 2002): northern Europe: y =
0.148x – 0.180, r2= 0.68; Black/Azov Seas: y = 0.158x – 0.251, r2= 0.25 0.1 1* 3 3 2 5 1 4 2* 1 6 1 53 4 2 2 1 B M Ø 51 7 68 3 2 100 100 90 94 87 83 96 91 72 79 100 98 70 58 55 56 83 Denmark 4–10 km Groningen 0.2 km Zeeland 1-18 (58-75) km Ria Formosa Rio Mondego Azov Sea 30 km Black Sea 20–550 km Port Lligat Caprolace 4 Sylt 2-74 km Mauritania 1–9 km
Fig. 6. Zostera noltii. Neighbor-joining tree illustrating the
re-lationships among 33 populations. The tree was based on pairwise Reynolds distances (Reynolds et al. 1983) between genets only; bootstrap values were derived by 2000 permuta-tions of allele frequencies. Minimum and maximum geo-graphic distances among populations within a given locality are indicated. "identifies populations with a small number of genets because large clones were present: Mauritania-1, genets = 10; Black Sea-3, genets = 1; Azov Sea-2, genets = 3
DISCUSSION
The regional neighborhood
Degradation and loss of seagrass meadows has led to the general notion of low genetic diversity, extensive clonality and minimal gene flow among populations because of constrained sexual reproduction. At the landscape scale, significant IBD became apparent at ≥100 to 150 km in Zostera noltii. Significant IBD also has been documented for Z. noltii populations in Por-tugal at distances of ca. 100 km (O. E. Diekmann unpubl. data) and for predominantly subtidal Z. marina among northern European, western Atlantic and eastern Pacific populations at distances ≥100 to 150 km (Reusch et al. 2000, Olsen et al. 2004). Thus, substantial gene flow among intertidal and subtidal populations of Zostera spp. occurs at the level of 10s of km, with differentiation and genetic substructuring occurring primarily at distances of 100s of km. The similarity of IBD relationships for the small (≤100 cm length) intertidal Z. noltii and large (≥1 m length) sub-tidal Z. marina further suggests that habitat and/or size does not significantly affect dispersal. What may be most important in dispersal of Zostera species is the ability of intact plants (or reproductively mature por-tions thereof) to raft from one area to another (see Ruckelshaus 1998, Reusch 2002).
Global scale differentiation and history
During the LGM (18 000 to 20 000 yr BP), ice sheets covered most of Scandinavia and the British Isles (Dawson 1992). Seas north of the polar front, believed to be located near the present day northern Iberian coast, were covered with sea ice during the winter (Frenzel et al. 1992), thus glacial refugia for Zostera noltii most likely occurred south of the polar front along the coasts of the southern Iberian Peninsula, NW Africa (Mauritania) and throughout the Mediter-ranean. As the ice sheets retreated, Z. noltii popula-tions expanded into suitable habitats according to the ‘leading-edge’ hypothesis, as has been demonstrated for algal, plant and animal species in Europe (van Oppen et al. 1995, Hewitt 1996, 2000, Röhner et al. 1997, Nilsson et al. 2001, Gabrielsen et al. 2002, Reusch 2002, Coyer et al. 2003).
Genetic studies of post-glacial recolonization usually compare genetic variation within and among extant populations inhabiting areas formerly covered by ice, to extant populations in putative glacial refugia. In making these comparisons, it is widely accepted that the founding populations colonizing new areas of suit-able habitat should represent subsets of the source
populations, with fewer alleles and increased levels of homozygosity (=lower genetic diversity) (Hewitt 1996, 2000, Johnson et al. 2000, Zink et al. 2000). The expec-tation of decreased genetic diversity in colonizing pop-ulations, however, may be too simplistic and a recent study has demonstrated that genetic diversity in founding populations can be either higher or lower depending on the estimator (Comps et al. 2001). Genetic diversity of Zostera noltii, as measured with 3 estimators, decreased northward along the Atlantic coast from a putative southern refugium in Mauritania. However, the highest diversity was not found in the middle-southern populations, but in the German Wad-den Sea (see below). With respect to longitudinal pat-terns, the lack of correlation between genetic diver-sity/allelic richness and longitude from Mauritania through the Mediterranean may stem from the fact that both areas are putative refugia.
Northern Europe
Significant differentiation was observed among the 4 localities of the northern European cluster (200 to 1400 km, Fig. 6). It is unlikely that a hypothesis of multiple invasions of northern Europe from different southern refugia can explain the patterns of differenti-ation because all northern European areas comprise 1 strongly-resolved cluster. It is more likely that follow-ing a massive colonization sweep from southern refu-gia, each northern European locality subsequently evolved in relative isolation. The high levels of genetic diversity and allelic richness observed at Sylt were unexpected, but mirror results of a parallel study for Zostera marina (Olsen et al. 2004). Given that the area has become a marine habitat only within the past 7500 yr, the observed high diversity must have another explanation, perhaps disturbance.
Disturbances due to waterfowl grazing, lugworm in-teractions and epiphytic overgrowth are common at Sylt, and elsewhere in the Wadden Sea (Jacobs et al. 1981, Reise 1985, Philippart 1994, Nacken & Reise 2000, Schanz et al. 2002). It is conceivable, for example, that high levels of disturbance by grazing waterfowl in autumn will elevate the relative importance of sexual reproduction (and genetic diversity-producing meiotic recombination) by creating open space in which seeds can germinate and seedlings can survive during the fol-lowing spring. Ice-scour in winter also may create open space in the spring and disturbance events during the summer may uproot proportionally more segments of reproductively mature plants, which are then rafted to other locations by tidal and/or wind-driven currents.
The importance of disturbance events on seagrass genetic diversity is largely unknown, but a relationship
similar to that predicted by the Intermediate Distur-bance Hypothesis for species diversity (Connell 1978) has been suggested (Hemminga & Duarte 2000): high-est levels of genetic diversity in areas with intermediate levels of disturbance. Two studies of Zostera marina may support the relationship. First, higher genetic di-versity was documented in a population at a Baltic Sea site characterized by extensive grazing by swans (Häm-merli & Reusch 2003). Secondly, seed germination (which should increase local genetic diversity) was greater in areas where winter ice had removed whole plants, than among mature ramets that had survived the ice disturbance (Robertson & Mann 1984). Addi-tionally, a recent experimental study has demonstrated that autumn grazing by brent geese (Branta bernicla bernicla) was necessary for persistence of Z. noltii in the following spring, probably by reducing the amount of sediment accumulation (Nacken & Reise 2000). The re-lationship between disturbance and genetic diversity and/or seasonal persistence has important ramifications for conservation and management of seagrass popula-tions and needs to be more widely examined.
Alternatively, the high levels of genetic diversity and allelic richness (and lack of IBD) at Sylt may be due to the importance of the area to migratory waterfowl. Migrating birds may carry individual seeds and/or spathes of Zostera noltii from one meadow to another, thereby increasing genetic diversity and gene flow. Although Z. noltii seeds collected from fecal droppings of brent geese were not viable (Ehlers 2002), the via-bility of seeds that have passed through the alimentary tract of other waterfowl species such as ducks (Anas penelope, A. acuta, A. platyrhynchos), as well as the potential for any waterfowl species to directly or indi-rectly transport reproductively mature spathes exter-nally, remain to be tested.
Black and Azov seas
The Black and Azov seas also became marine and, therefore, suitable for Zostera noltii ca. 7500 yr BP; in this case, after the Bosphorous Strait opened (Ryan et al. 1997, Aksu et al. 2002). Similarly, high levels of dif-ferentiation were observed among most populations in these areas, which corresponded to significant IBD (Fig. 5). High allelic diversity, as well as the highest proportion of unique alleles (30%), was recorded in the Black/Azov Sea regions. Although some of the popula-tions sampled were dominated by a few large clones, the overall genetic diversity in these areas was high.
Both the Black and Azov seas probably were recolo-nized from Mauritania and presently represent high di-versity relict populations. In the absence of haplotype data, we cannot establish that these populations are the
oldest, but judging from their position in the NJ tree (Fig. 6) relative to Mauritania and the Mediterranean, it is reasonable to assume that these populations are modern day outposts. The residual diversity is unex-pected, however, based on the marginal state of many seagrass beds along the Black Sea rim at present.
Mauritania as ice-age refuge and contemporary haven
During the LGM, Mauritania undoubtedly served as a refuge for Zostera noltii with subsequent intrusions into the Mediterranean and Black seas. Even today, both the Black Sea and Mauritania coasts have large coastal pop-ulations characterized by high allelic diversity. The coasts of Portugal, and Atlantic and Mediterranean Spain, may now represent marginal habitats for Z. noltii, because populations are restricted to isolated patches of suitable habitat (i.e. estuaries and coastal lagoons) and are thus likely to have small population sizes, low clonal diversity and significant departures from HWE (O. E. Diekmann unpubl. data). Though only weakly sup-ported, populations from Spain and Italy (Mediter-ranean) group together as do Ria Formosa and Rio Mondego (Iberian-Atlantic); both groups are linked to Mauritania.
A recently completed survey of Zostera noltii along the Portuguese coast detected a sharp biogeographic break on either side of the Tagus River (O. E. Diek-mann unpubl. data). Whether the discontinuity is due to rapid genetic drift associated with small and isolated populations, or represents isolation due to large dis-tances between adjacent populations, is not clear. The Brittany peninsula to the north is characterized by high genetic diversity in the fucoid seaweed Fucus serratus (Coyer et al. 2003), but not for Z. marina (Olsen et al. 2004). Thus, the Black, Azov and Wadden Seas may be considered as diversity hotspots.
Large clones and the concept of diversity
Clonality generally is correlated with frequency of localized disturbances, with low disturbance favoring maximum clonal growth. Large clones, therefore, tend to be older and may provide insights into the popula-tion’s stability. A single large clone of Zostera noltii was present at Odessa City Beach and a parallel sam-ple of 50 Z. marina shoots collected on the same day and in the same manner also revealed the presence of a single large clone (Olsen et al. 2004). Using mean rhizome elongation rates of 26 and 68 cm yr–1 for Z. marina and Z. noltii, respectively (Marbà & Duarte 1998), we estimated the ages of the genets to be 96 to 192 yr for Z. marina (data from Olsen et al. 2004) and
34 to 69 yr for Z. noltii. As the beach is very near one of the largest harbors in the Black Sea, the most parsimo-nious explanation for the extensive clonality of both species is the survival and expansion of a single genet following anthropogenic disturbance. Although the growth data do not allow an unambiguous determina-tion of whether a putative disturbance event affected each species simultaneously or sequentially, the spatial and temporal aspects of the clones suggest relatively undisturbed conditions since the initiating event. The ages of large Z. noltii clones in the Azov Sea and Mau-ritania were estimated to be 29 to 59 yr and 21 to 42 yr, respectively. While the ages of Z. noltii are not as dra-matic compared with estimates for Z. marina in the eastern Baltic (Reusch et al. 1999a) or Posidonia ocean-ica in the northern Adriatic (Ruggiero et al. 2002), both of which covered thousands of m2and were estimated to be ≥1000 yr old, they do indicate that population turnover times for Z. noltii are of the order of 2 to 6 decades in widely separated areas.
Whereas a few clones dominating an area have a small effective population size and implicitly low geno-typic diversity (e.g. low multi-locus heterozygosity), this does not necessarily mean low fitness or low per-sistence. For example, the Zeeland-6 clone was homozygous for 4 loci and heterozygous with only 2 alleles at each of the remaining 5 loci. Although the source and history of the Zeeland-6 clonal population remain unknown, the population spanned 1000s of m2 in size, strongly indicating a high degree of success in the area. The trade-off in growth/persistence versus reproduction (flowering frequency, degree of outcross-ing, seed production) in successful, but low diversity populations is currently under investigation. The main point is that diversity in seagrasses is present at the levels of both clonality and multi-locus heterozygosity, each of which need to be considered separately.
Concluding remarks
The large and multi-year-old clones present in some populations of Zostera noltii suggest local adaptation in areas with low disturbance, as is also the case for populations characterized by very low levels of genetic diversity and large size. Although local adaptation can be expected to increase differentiation between adja-cent populations, the differentiation may be amelio-rated by disturbance events, which provide new space for seed germination and/or promote rafting of repro-ductively mature plants for 100s of km.
We also hypothesized that the predominantly inter-tidal habitat of Zostera noltii would lead to greater con-nectivity and hence, a larger spatial scale of the pan-mictic unit than that found in the predominantly
subtidal habitat of Z. marina, in which buffering would lead to greater differentiation at the same scales. Pat-terns of differentiation and connectivity were similar over regions in which the 2 species co-occurred, how-ever, suggesting that macro-features of the landscape-shoreline may play a more important role in delimiting population connectivity than dispersal, life history, or distinctions based on intertidal versus subtidal habitat, at least throughout northern Europe and at the regional neighborhood scale.
We conclude that despite the ongoing degradation of seagrass populations, mainly because of habitat destruction and fragmentation, the genetic potential for recovery is present in many locations. Future con-siderations of seagrass conservation and management should continue to insure the preservation of habitat and water quality, but also should consider the impor-tance of disturbance (e.g. in a conservation context, not in a broad sense that includes habitat destruction) as a means to promote connectivity (and stability) between populations.
Acknowledgements. We thank K. Reise for logistical
assis-tance and insightful comments, J. Hiddink and W. Wolff for collecting samples in Mauritania, J. Ferreira for the collec-tions in Ria Formosa and Rio Mondego, M. Billingham and J. Ferreira for the collections in Denmark, and F. Alberto for the collections in Port Lligat. We also acknowledge E. Herre, M-P. Oudot LeSecq and J. Veldsink for technical assistance, and G. Hoarau for reviewing an earlier draft of the manu-script. J.A.C. was supported by a research grant from the Uni-versity of Groningen Breedtestrategie; O.E.D. was supported
by a postdoctoral fellowship from the FCT-Portuguese Sci-ence Foundation, Portugal and the European Social Fund (ESF). Additional funding was provided from the EU project EVK3-CT-2000-00044 (M&MS) and the FCT project PNAT/ 1999/BIA/15003/C (SEAGRASSRIA).
LITERATURE CITED
Aksu AE, Hiscott RN, Mudie PJ, Rochon A, Kaminski MA, Abrajano T, Yasar D (2002) Persistent Holocene outflow from the Black Sea to the eastern Mediterranean contra-dicts Noah’s Flood Hypothesis. GSA Today May 2002: 4–10
Barrett SCH, Eckert CG, Husband BC (1993) Evolutionary processes in aquatic plant populations. Aquat Bot 44: 105–145
Belkhir K, Borsa P, Goudet J, Chikhi L, Bonhomme F (2001) GENETIX, logiciel sous WindowsTMpour la genetique des
populations. Laboratoire Genome et populations, Mont-pellier
Billingham MR, Reusch TBH, Alberto F, Serrão E (2003) Is asexual reproduction more important at geographical lim-its? A genetic study of the seagrass Zostera marina in the
Ria Formosa, Portugal. Mar Ecol Prog Ser 265:77–83 Bohonak AJ (2002) IBD (isolation by distance): a program for
analyses of isolation by distance. J Hered 93:154–155 Bruno JF, Bertness MD (2001) Habitat modification and
Gaines SD, Hay ME (eds) Marine community ecology. Sinauer, Sunderland, MA, p 201–218
Comps B, Gömöry D, Letouzey J, Thiébaut B, Petit RJ (2001) Diverging trends between heterozygosity and allelic rich-ness during postglacial colonization in the European beech. Genetics 157:389–397
Connell JH (1978) Diversity in tropical rain forests and coral reefs. Science 199:1302–1310
Cornuet JM, Luikart G (1996) Description and power analysis of two tests for detecting recent population bottlenecks from allele frequency data. Genetics 144:2001–2014 Coyer JA, Peters AF, Stam WT, Olsen JL (2003) Post-ice age
recolonization and differentiation of Fucus serratus L.
(Fucaceae: Phaeophyta) populations in Northern Europe. Mol Ecol 12:1817–1829
Coyer JA, Reusch TBH, Stam WT, Serrão EA, Pearson G, Pro-caccini GA, Olsen JL (2004) Characterization of micro-satellite loci in the dwarf eelgrass, Zostera noltii
(Zoster-aceae) and cross reactivity with Z. japonica. Mol Ecol
Notes 4:397–499
Curiel D, Bellato A, Rismondo A, Marzocchi M (1996) Sexual reproduction of Zostera noltii Hornemann in the lagoon of
Venice (Italy, north Adriatic). Aquat Bot 52:313–318 Dawson AG (1992) Ice age earth. Routledge, London Den Hartog C (1970) The seagrasses of the world. Verh Kon
Ned Akad Wetens Afd Natuurk Tweede Reeks Deel 59:(1) and North-Holland Publishers, Amsterdam
Di Rienzo A, Peterson AC, Garza JC, Valdes AM, Slatkin M, Freimer NB (1994) Mutational processes of simple-sequence repeat loci in human populations. Proc Natl Acad Sci USA 91:3166–3170
Ehlers A (2002) Positive und negative Effekte von Wasser-vögeln auf submerse Vegetation: zwischen Überweidung und Samenverbreitung. Christian-Albrechts-Universität, Kiel
Felsenstein J (1994) PHYLIP (Phylogeny inference package). Department of Genetics, University of Washington, Seattle Frenzel B, Pécsi M, Velichko AA (1992) Atlas of paleoclimates and paleoenvironments of the Northern hemisphere: Late Pleistocene-Holocene. Geogr Res Inst, Hungarian Acad-emy of Sciences, Budapest
Gabrielsen TM, Brochmann C, Rueness J (2002) The Baltic Sea as a model system for studying postglacial coloniza-tion and ecological differentiacoloniza-tion, exemplified by the red alga Ceramium tenuicorne. Mol Ecol 11:2083–2095
Green EP, Short FT (2003) World atlas of seagrasses. UNEP World Conservation Monitoring Centre University of California Press, Berkeley
Hämmerli A, Reusch TBH (2003) Inbreeding depression influ-ences genet size distribution in a marine angiosperm. Mol Ecol 12:619–629
Harper GL (1977) Population biology of plants. Academic Press, New York
Harrison PG (1993) Variations in demography of Zostera marina and Z. noltii on an intertidal gradient. Aquat Bot
45:63–77
Hellberg ME (1994) Relationships between inferred levels of gene flow and geographic distance in a philopatric coral,
Balanophllia elegans. Evolution 48:1829–1854
Hemminga MA, Duarte CM (2000) Seagrass ecology. Cam-bridge University Press, CamCam-bridge
Hewitt GM (1996) Some genetic consequences of ice ages, and their role in divergence and speciation. Biol J Linn Soc 58:247–276
Hewitt GM (2000) The genetic legacy of the Quaternary ice ages. Nature 405:907–914
Hootsmans MJM, Vermaat JE, van Vierssen W (1987)
Seed-bank development, germination and early seedling survival of two seagrass species from The Netherlands: Zostera ma-rina L. and Zostera noltii Hornem. Aquat Bot 28:275–285
Jacobs RPWM, Den Hartog C, Braster BF, Carrière FC (1981) Grazing of the seagrass Zostera noltii by birds at
Ter-schelling (Dutch Wadden Sea). Aquat Bot 10:241–259 Jacobs RPWM, Noten TMPA, Claassen E (1983) Population
and growth characteristics of the seagrass Zostera noltii
Hornem. in the Dutch Waddensea. International Sympo-sium on Aquatic Macrophytes, Nijmegen, p 95–100 Johnson KP, Adler FR, Cherry JL (2000) Genetic and
phylo-genetic consequences of island biogeography. Evolution 54:387–396
Kirsten JH, Dawes CJ, Cochrane BJ (1998) Random amplified polymorphism detection (RAPD) reveals high genetic diversity in Thalassia testudinum banks ex König
(Turtle-grass). Aquat Bot 61:269–287
Laushman RH (1993) Population genetics of hydrophilous angiosperms. Aquat Bot 44:147–158
Les DH (1988) Breeding systems, population structure, and evolution in hydropohilous angiosperms. Ann Mo Bot Gard 75:819–835
Loques F, Caye G, Meinesz A (1990) Germination in the marine phanerogam Zostera noltii Hornemann at Golfe
Juan, French Mediterranean. Aquat Bot 38:249–260 Manly BFJ (1994) Multivariate statistical methods: a primer.
Chapman & Hall, New York
Marbà N, Duarte CM (1998) Rhizome elongation and sea-grass clonal growth. Mar Ecol Prog Ser 174:269–280 Nacken M, Reise K (2000) Effects of herbivorous birds on
intertidal seagrass beds in the northern Wadden Sea. Helgol Wiss Meeresunters 54:87–94
Nei M (1978) Estimation of average heterozygosity and genetic distance from a small number of individuals. Genetics 89:583–590
Nilsson J, Gross R, Asplund T, Dove O and 12 others (2001) Matrilinear phylogeography of Atlantic salmon (Salmo salar L.) in Europe and postglacial colonization of the
Baltic Sea area. Mol Ecol 10:89–102
Olsen JL, Stam WT, Coyer JA, Reusch TBH and 15 others (2004) North Atlantic phylogeography and large-scale population differentiation of the seagrass Zostera marina
L. Mol Ecol 13:1923–1941
Petit RJ, El Mousadik A, Pons O (1998) Identifying popula-tions for conservation on the basis of genetic markers. Conserv Biol 12:844–855
Philippart CJM (1994) Interactions between Arenicola marina
and Zostera noltii on a tidal flat in the Wadden Sea. Mar
Ecol Prog Ser 111:251–257
Philippart CJM (1995) Seasonal variation in growth and bio-mass of an intertidal Zostera noltii stand in the Dutch
Wadden Sea. Neth J Sea Res 33:205–218
Procaccini GA, Mazzella L (1998) Population genetic struc-ture and gene flow in the seagrass Posidonia oceanica
assessed using microsatellite analysis. Mar Ecol Prog Ser 169:133–141
Procaccini GA, Orsini L, Ruggiero MV, Scardi M (2001) Pat-terns of genetic diversity in Posidonia oceanica, an
endemic Mediterranean seagrass. Mol Ecol 10:1413–1422 Procaccini GA, Ruggiero MV, Orsini L (2002) Genetic struc-ture and distribution of microsatellite diversity in Posido-nia oceanica over the whole Mediterranean basin. Bull
Mar Sci 71:1291–1297
Reise K (1985) Tidal flat ecology; an experimental approach to species interactions. Springer-Verlag, Berlin
Reusch TBH (2001a) New markers-old questions: population genetics of seagrasses. Mar Ecol Prog Ser 211:261–274
Reusch TBH (2001b) Fitness-consequences of geitonogamous selfing in a clonal marine angiosperm (Zostera marina).
J Evol Biol 14:129–138
Reusch TBH (2002) Microsatellites reveal high population connectivity in eelgrass (Zostera marina) in 2 contrasting
coastal areas. Limnol Oceanogr 47:78–85
Reusch TBH, Boström C, Stam WT, Olsen JL (1999a) An ancient eelgrass clone in the Baltic. Mar Ecol Prog Ser 183: 301–304
Reusch TBH, Stam WT, Olsen JL (1999b) Size and estimated age of genets in eelgrass Zostera marina L. assessed with
microsatellite markers. Mar Biol 133:519–525
Reusch TBH, Stam WT, Olsen JL (2000) A microsatellite-based estimation of clonal diversity and population subdi-vision in Zostera marina, a marine flowering plant. Mol
Ecol 9:127–140
Reynolds J, Weir BS, Cockerham CC (1983) Estimation of the coancestry coefficient: a basis for short term genetic dis-tance. Genetics 105:767–779
Rice WR (1989) Analyzing tables of statistical tests. Evolution 43:223–225
Robertson AI, Mann KH (1984) Disturbance by ice and life-history adaptations of the seagrass Zostera marina. Mar
Biol 80:131–141
Röhner MR, Bastrop R, Jürss K (1997) Genetic differentiation in Hediste diversicolor (Polychaetea: Neredididae) for the
North Sea and the Baltic Sea. Mar Biol 130:171–180 Rousset F (1997) Genetic differentiation and estimation of
gene flow from F-statistics under isolation by distance.
Genetics 145:1219–1228
Ruckelshaus MH (1998) Spatial scale of genetic structure and an indirect estimate of gene flow in eelgrass, Zostera marina. Evolution 52:330–343
Ruggiero MV, Turk R, Procaccini GA (2002) Genetic identity and homozygosity in North-Adriatic populations of
Posidonia oceanica: an ancient, post-glacial clone?
Conserv Gen 3:71–74
Ryan WBF, Pitman WC III, Major CO, Shimkus K and
6 others (1997) An abrupt drowning of the Black Sea shelf. Mar Geol 138:119–126
Schanz A, Polte P, Asmus H (2002) Cascading effects of hydrodynamics on an epiphyte-grazer system in intertidal seagrass beds of the Wadden Sea. Mar Biol 141:287–297 Short FT, Wyllie-Echeverria S (1996) Natural and human-induced disturbance of seagrasses. Environ Conserv 23: 17–27
Slatkin M (1993) Isolation by distance in equlibrium and non-equlibrium populations. Evolution 47:264–279
Sokal RR, Rohlf FJ (1981) Biometry, 2nd edn. WH Freeman, New York
van Oppen MJH, Olsen JL, Stam WT (1995) Genetic variation within and among North Atlantic and Baltic populations of the benthic alga Phycodrys rubens (Rhodophyta). Eur J
Phycol 30:251–260
Vermaat JE, Verhagen FCA (1996) Seasonal variation in the intertidal seagrass Zostera noltii Hornem.: coupling
demographic and physiological patterns. Aquat Bot 52: 259–281
Vermaat JE, Hootsmans MJM, Nienhuis PH (1987) Seasonal dynamics and leaf growth of Zostera noltii Hornem., a
perennial intertidal seagrass. Aquat Bot 28:287–299 Waycott M (1995) Assessment of genetic variation and
clonal-ity in the seagrass Posidonia australis using RAPD and
allozyme analysis. Mar Ecol Prog Ser 116:289–295 Weir BS, Cockerham CC (1984) Estimating F-statistics for the
analysis of population structure. Evolution 38:1358–1370 Williams SL, Heck KL (2001) Seagrass community ecology. In: Bertness MD, Gaines SD, Hay ME (eds) Marine community ecology. Sinauer, Sunderland, MA, p 317–337 Wright S (1943) Isolation by distance. Genetics 28:114–138 Wright S (1969) Evolution and the genetics of populations, Vol
2. The theory of gene frequencies. University of Chicago Press, Chicago
Zink RM, Blackwell-Rago RC, Ronquist R (2000) The shifting roles of dispersal and vicariance in biogeography. Proc R Soc Lond B 267:497–503
Editorial responsibility: Otto Kinne (Editor), Oldendorf/Luhe, Germany
Submitted: April 1, 2004; Accepted: July 8, 2004 Proofs received from author(s): October 12, 2004