Short Communication
A note on the distribution of genetic diversity of Anglo-Nubian goats in
central-northern farms of Piauí, Brazil
Ellida de Aguiar Silvestre1, Márcio da Silva Costa2, Pollyana Oliveira da Silva2, Miklos Maximiliano Bajay3, José Baldin Pinheiro4, Maria Imaculada Zucchi5, José Elivalto Guimarães
Campelo6, Fábio Barros Britto7
1 Universidade Federal do Piauí, Programa de Pós-graduação em Genética e Melhoramento, Teresina, PI, Brasil. 2 Universidade Federal do Piauí, Programa de Pós-graduação em Ciência Animal, Teresina, PI, Brasil.
3Universidade de São Paulo, Escola Superior de Agricultura “Luiz de Queiroz”, Programa de Pós-graduação em Genética e Melhoramento de Plantas, Piracicaba, SP, Brasil.
4 Universidade de São Paulo, Escola Superior de Agricultura “Luiz de Queiroz”, Departamento de Genética, Piracicaba, SP, Brasil. 5Agência Paulista de Tecnologia dos Agronegócios, Polo Regional de Desenvolvimento Tecnológico do Centro Sul, Piracicaba, SP, Brasil. 6 Universidade Federal do Piauí, Departamento de Zootecnia, Teresina, PI, Brasil.
7 Universidade Federal do Piauí, Departamento de Biologia, Teresina, PI, Brasil.
ABSTRACT - The objective of this study was to characterize the genetic variability of Anglo-Nubian goats using microsatellite markers. The study was conducted using herds from four municipalities of Central-Northern Piauí (Teresina, José de Freitas, Campo Maior, and Angical), where technical information is scarce. Seven markers suggested by FAO were used (ILSTS11, McM527, INRA23, ETH10, OarfCB304, OarfCB48, and MAF209). The samples were genotyped using a 7% polyacrylamide gel. The average number of alleles per locus was 4.0, with observed and expected heterozygosity of 0.38 and 0.55, respectively. Few deviations from the Hardy-Weinberg equilibrium were observed for each population. Only two loci deviated significantly in two localities. The coefficient of gene differentiation (GST’) indicated that 11.9% of the genetic
variation was distributed among populations, and according to the coefficient of inbreeding (GIS = 0.23 and FIS = 0.23), there
is a deficiency of heterozygotes within populations. These findings corroborate the Bayesian analyses performed with the STRUCTURE software, which revealed three distinct and moderately structured groups. The graphic analysis showed that Teresina and José de Freitas are isolated groups, while Angical and Campo Maior share most of their alleles. Despite this, the level of diversity among herds was low. Based on this genetic structure, exchange of reproducers among municipalities is recommended for the maintenance of the breed.
Key Words: endogamy, genetic structure, microsatellite, molecular markers ISSN 1806-9290
www.sbz.org.br R. Bras. Zootec., 44(4):155-160, 2015
Received February 13, 2014 and accepted March 5, 2015. Corresponding author: ellidaguiar@gmail.com
http://dx.doi.org/10.1590/S1806-92902015000400004
Copyright © 2015 Sociedade Brasileira de Zootecnia. This is an Open Access article distributed under the terms of the Creative Commons Attribution Non-Commercial License, which permits unrestricted non-commercial use, distribution, and reproduction in any medium, provided the original work is properly cited.
Introduction
Goat farming is an activity of great economic and social importance in Brazil. The northeastern region has the largest goat livestock, representing more than 90% of the national total (IBGE, 2011). Goat farming increases family income as well as food supply for low-income populations. Recently, the interest in improving goat livestock has increased due to a higher demand for meat in the consumer market (Oliveira et al., 2008). A controlled introduction of specialized breeds is one of the alternatives to increase production, and among the available options, Anglo-Nubian goats have been the most commonly used by producers (Freitas et al., 2004), mainly
due to their large size (Borges and Gonçalves, 2002). Cross-breeding of Anglo-Nubian bucks with does of no defined breed improves carcass yields, indicating that it is an efficient tool (Oliveira et al., 2008). In addition, Anglo-Nubian goats are adaptable to the semi-arid climate of Northeastern Brazil, with excellent heat tolerance indexes (HTI) (Santos et al., 2005). For these reasons, Anglo-Nubian goats have been increasingly used in Central-Northern Piauí. However, its introduction has been carried out indiscriminately and with no technical standards to avoid possible problems associated with genetic erosion and high inbreeding in herds. Studies on this breed have focused mostly on its potentials, such as behavior, adaptation, and production, rather than the genetic structure of populations in areas of occurrence.
most commonly used markers are microsatellites, which consist of DNA segments of one to six base pairs repeated in tandem. They are usually distributed in different parts of the genomes, exhibiting co-dominant inheritance and are considered evolutionarily neutral (Tóth et al., 2000). Several studies on the molecular characterization of goats have used this marker in Brazil and worldwide (Di et al., 2011; Menezes et al., 2006; Nomura et al., 2012; Ramamoorthi et al., 2009).
Analyses with microsatellites have been considered essential as they are used in the genetic characterization of populations, are important in paternity tests and genetic mapping, and can contribute in the planning of management, breeding, and conservation programs. The present study was aimed at using microsatellite markers to characterize the genetic diversity and population structure of Anglo-Nubian goats in four municipalities of Central-Northern Piauí, Brazil, where the breed is very common.
Material and Methods
Hair samples from 96 purebred Anglo-Nubian goats were collected from commercial breeding farms in Central-Northern Piauí. Samples were mainly from dams and bucks selected for breeding and identified as purebred. Animals were registered in Apiccovi (Association of Goat and Sheep Breeders of Piauí) for certification of origin. The study comprised the municipalities of Angical, José de Freitas, Teresina (the capital of Piauí), and Campo Maior (Figure 1), totaling 24 animals of each locality. DNA extraction was carried out with approximately 20 hair follicles, following the protocol described by Walsh et al. (1991).
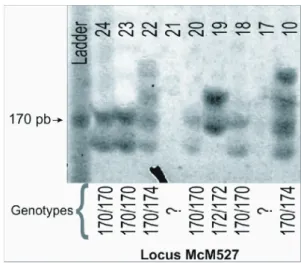
Seven microsatellite markers (ILSTS11, McM527, INRA23, ETH10, OarfCB304, OarfCB48, and MAF209) recommended by FAO for studies on genetic diversity were used. Markers were amplified by PCR using the following
configuration: 3.0 µL of DNA (~5 ng), 1.0 mM MgCl2,
0.05 mM for each dNTP (Tools-Vilnius, Lithuania), 0.1 µg/µL BSA (BioLabs, USA), 1 U of Taq DNA-polymerase,
0.2 μM of each primer, and ultrapure water q.s. for 15 μL.
The solution was amplified with a thermocycler (MJ Research PTC-100, USA) with the following cycles: initial denaturation of 10 min at 94 ºC; 35 cycles with: denaturation for 30 s at 94 ºC, followed by annealing of primer for 45 s at 58 ºC, and 30 s at 72 ºC for elongation. After the end of the cycles, the reaction continued for 10 min at 72 ºC for final elongation. The generated amplicons were resolved on 7% polyacrylamid gel electrophoresis and stained with silver nitrate according to Caetano-Anollés and Gresshoff (1994). Fragment sizes were determined with a 10 bp DNA ladder
(Invitrogen) and scored manually (Figure 2). Some samples were electrophoresed twice in different gels for calibration purposes.
The number of alleles per locus (A), observed
heterozygosity (HO), expected heterozygosity (HE), and
Polymorphic Information Content (PIC) were calculated
with the MSTOOLS software (Excel Microsatellite Toolkit).
Adherence to the Hardy-Weinberg equilibrium was tested
with the GENEPOP v.3.1 software with the Bonferroni
correction and significance set at 5%.
Nei’s genetic distances were used for population analysis
with the FSTAT v.1.2 software, and a confidence interval of
95%. The STRUCTURE software was used to investigate the
existence of genetic structure among samples. The most likely number of groups (K) was determined by Bayesian analysis, with no a priori information on the origin of samples. The following parameters were used: 500,000 Markov Chain
Figure 1 - Map of Central-Northen Piauí, showing the municipalities of the study area.
Monte Carlo simulations, burn in of 300,000, admixture models, and correlated allele frequency model. Values of K were simulated ranging from 1 to 10 and the most likely K value was determined according to Evanno et al. (2005).
Results
The average number of microsatellite alleles per locus
was four (Table 1). Despitethis low number, the Polymorphic
Information Content (PIC) was high for most of the markers, with an average of 0.494 (Table 1). Four of seven markers had PIC values higher than 0.5. Only the PIC of ILSTS11 was much lower than the average. Without this marker, the average PIC rose to 0.555.
The average observed heterozygosity for the entire sample was 0.385, ranging between 0.129 for ILSTS11 and 0.538 for MAF209, while the average expected heterozygosity was 0.558, varying from 0.140 for ILSTS11 to 0.766 for INRA23 (Table 1). Among populations, the
observed heterozygosity ranged from 0.336 for Angical to 0.436 for Teresina, while the expected heterozygosity ranged from 0.482 for José de Freitas to 0.550 for Campo Maior (Table 2).
The number of loci with significant deviations from the Hardy-Weinberg equilibrium (HWE) was low (Table 3), mainly for McM527 and INRA23. These results corroborate
estimates of GIS for these markers, which confirmed an
excess of homozygous individuals (GIS = 0.383 and 0.389,
respectively). The OarfCB304 and OarfCB48 markers also
showed high GIS values (0.402 and 0.317), which were
not significant deviations within each isolated population, but they deviated from HWE when the entire sample was
included. The mean GIS (Table 2) and FIS (Table 3) also
revealed an overall trend toward homozygosis (0.237 for both indices; confidence interval at 95%: 0.082-0.441). The
FIS values for all populations were positive, ranging from
0.118 for Teresina to 0.312 for Angical do Piauí.
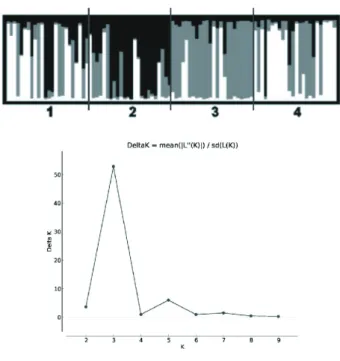
Genetic divergences among populations were significant, confirming that each locality exhibited distinct
patterns of allele frequencies. The average GST’ indicated
that 11.9% of the genetic variation observed is distributed among and 88.1% within populations (Table 1; confidence interval at 95%: 0.059-0.194). The occurrence of genetic structure was examined with Bayesian analyses and subsequent statistical procedures proposed by Evanno et al. (2005). The results showed that the most likely number of groups to explain the data was three (Figure 3). The graphic results showed that these groups could be distributed as
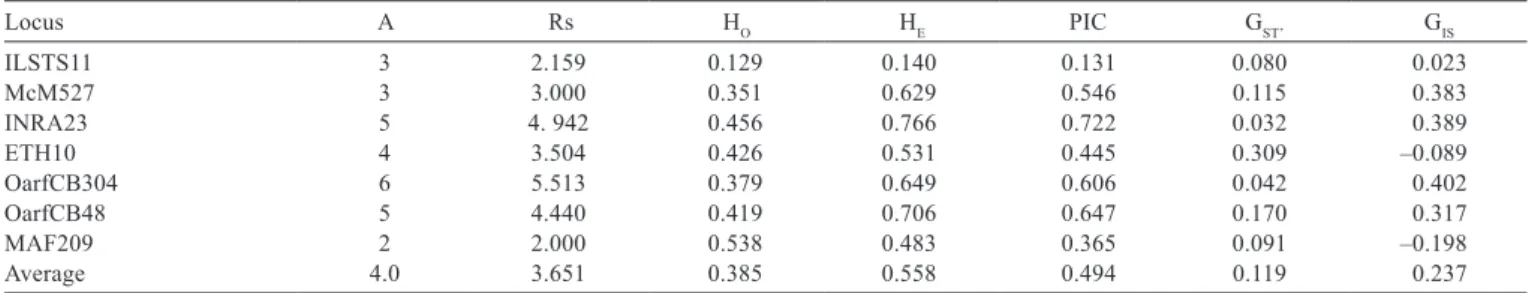
Table 1 - Number of alleles per locus (A), allelic richness (Rs), expected heterozygosity (HE), observed heterozygosity (HO), Polymorphic
Information Content (PIC), coefficient of genetic differentiation corrected for sample size (GST’) and coefficient of intrapopulational
inbreeding (GIS) for each analyzed locus
Locus A Rs HO HE PIC GST’ GIS
ILSTS11 3 2.159 0.129 0.140 0.131 0.080 0.023
McM527 3 3.000 0.351 0.629 0.546 0.115 0.383
INRA23 5 4. 942 0.456 0.766 0.722 0.032 0.389
ETH10 4 3.504 0.426 0.531 0.445 0.309 –0.089
OarfCB304 6 5.513 0.379 0.649 0.606 0.042 0.402
OarfCB48 5 4.440 0.419 0.706 0.647 0.170 0.317
MAF209 2 2.000 0.538 0.483 0.365 0.091 –0.198
Average 4.0 3.651 0.385 0.558 0.494 0.119 0.237
Table 3 - Exact test to determine adherence to the Hardy-Weinberg Equilibrium (P-value) for each locus within each population Locus Angical do Piauí Angical do Piauí Teresina Campo Maior Total
ILSTS11 1.0000 - 1.0000 1.0000 0.4265
McM527 0.0000* 0.3729 0.6816 0.0000* 0.0000*
INRA23 0.0054* 0.0191 0.2047 0.0056* 0.0000*
ETH10 1.0000 1.0000 0.6496 1.0000 0.1073
OarfCB304 0.0264 0.4333 0.1027 0.1867 0.0000*
OarfCB48 1.0000 0.0026* 0.6666 0.0894 0.0000*
MAF209 0.6527 0.0341 0.5381 0.3916 0.2829
*Significance set at 5% = 0.00625; “–” fixed allele, analyses not performed.
Table 2 - Number of alleles per locus (A), expected heterozygosity (HE), observed heterozygosity (HO), and fixation index
(FIS) for each analyzed population
Population A HE HO FIS
follows: (Group 1) Angical and Campo Maior sharing most of their alleles; (Group 2) José de Freitas composed of a single group; and (Group 3) Teresina consisting of a single group. Interestingly, Group 1 is composed of the two populations that are the farthest from the capital and from each other (Figure 1). Nevertheless, introgression of alleles can be observed in all of them. Thus, the Bayesian analysis
and GST’ values indicated a moderate population structure
among localities with some level of inbreeding shown by GIS and FIS.
Discussion
According to the analysis, the qualitative prerequisites of markers were fulfilled, as they are available in the public domain, non-linked, with Mendelian inheritance, homology among species, and easily replicable. According to FAO (2011), marker panels with an average of at least four alleles per loci are also recommended, which was obtained in the present study. Nevertheless, the low number of alleles observed might be associated with the transferability of markers, as all loci originated from other species of ruminants. For the transferability of markers among genera within the same family, a reduction in the
quantity of amplified and polymorphic markers is expected (Barbará et al., 2007). Despite these characteristics, the markers were considered highly informative based on PIC values (Botstein et al., 1980).
The number of alleles observed in genetic studies is also associated with sample size. Some studies using microsatellite markers sampled more than 50 individuals from each population (Li et al., 2002), more than used in the presented study. However, according to Hale et al. (2012), for precise estimates of allele frequencies and genetic diversity, no more than 25 to 30 individuals are needed per population. Thus, the possibility that the breed has a narrow genetic base in the studied region cannot be ruled out, due to indiscriminate crossings without technical information.
In the Teresina population, loci showed no significant deviations from HWE, indicating random mating (Menezes et al., 2006). Also, when other populations were analyzed, no more than two loci deviated from HWE. However, when all municipalities were included, only three loci (ILSTS11, ETH10, and MAF209) did not exhibit significant deviations, suggesting the Wahlund effect (Lessios, 1992).
The average GST’ indicated that 11.9% of the genetic
variation observed is structured among and 88.1% within populations. According to the classification by Hartl and
Clark (2010) for the analogous statistics of FST, values
between 5 and 15% of differentiation among populations indicate a moderate genetic differentiation.
The incipient genetic differentiation observed among localities may be directly associated with the isolation of herds. In natural populations, migration rate has a significant effect on the genetic fluctuations among populations (Laval et al., 2000). Thus, since a preference for purebred animals was observed in the study sites, the maintenance of phenotype following well-defined breed patterns favors the fixation of alleles as well as increased inbreeding, which was relatively high in the present study. This suggests the existence of preferential mating and directed selection, which could also explain the low number of alleles observed in the samples. Recent studies have shown that most reproducers came from within herds (Castelo Branco, 2011), which promotes a distinct structure in each locality. In addition, herds in Teresina-PI comprise 93% of the goats in the state (Silva et al., 2011). The structure observed in Teresina suggests no recent within-farm introgression where the samples were collected.
Another factor that contributes to the wide differences in populations is the limited use of artificial insemination in Brazilian goats (Solano et al., 1999). This practice is useful for increasing productivity by introducing superior genetic characteristics in a herd. However, there are factors that limit 1 - Angical do Piauí, 2 - José de Freitas, 3 - Teresina, 4 - Campo Maior.
the use of this technique, such as lack of technical information about breeds and lack of technologies for the management of semen among breeders (Solano et al., 1999).
An interesting finding was that the most geographical distant populations (Campo Maior and Angical) presented the most similar genetic profiles. This may be due to the trade of animals among farms, which would explain the similarities between these two locations. This pattern could also have occurred if farms between Campo Maior and Angical had purchased sires with different genetic characteristics. However it is important to consider that human manipulation of herds can result in patterns of “isolation” or “homogenization” that are not as obvious to understand as those of natural populations (Sun et al., 2007).
Conclusions
The qualitative criteria of the used markers indicate that although the number of alleles obtained represents only the minimum recommended, they are informative for studies on genetic diversity. Based on different measurements, the study populations exhibit a moderate structure, showing a medium to low genetic flow (exchange of material or rotation) among localities. In Angical, higher levels of genetic diversity were observed, while Teresina presented the most genetically similar animals. This could be directly associated with the maintenance and replacement of bucks and does from the same herd. Thus, the low diversity found within these populations suggests the existence of preferential mating and directed selection, making them more homogeneous. Thus, exchange of reproducers among municipalities is recommended.
Acknowledgments
The authors thank Capes, through the National Program of Academic Cooperation (Programa Nacional de Cooperação Acadêmica - PROCAD NF 2008), which enabled part of this study, as part of a Master’s Program, to be carried out at Esalq/USP; the owners of the sampled animals; and those who assisted in the conclusion of this study.
References
Barbará, T.; Palma-Silva, C.; Paggi, G. M.; Bered, F.; Fay, M. F. and Lexer, C. 2007. Cross-species transfer of nuclear microsatellite markers: potential and limitations. Molecular Ecology 16:3759-3767. Borges, I. and Gonçalves, L. C. 2002. Manual prático de caprino
e ovinocultura. Universidade Federal de Minas Gerais, Belo Horizonte.
Botstein, D.; White, R. L.; Skolnick M. and Davis R.W. 1980. Construction of a genetic linkage map in man using fragment length polymorphisms. American Journal of Human Genetics 32:314-331.
Caetano-Anollés, G. and Gresshoff, P. M. 1994. Staining nucleic acids with silver: an alternative to radioisotopic and fluorescent labeling. Promega Notes Magazine 45:13.
Castelo Branco, J. F. B. 2011. Caracterização fenotípica, sistema de produção, distribuição geográfica e aceitação do caprino Nambi no estado do Piauí. Tese (D.Sc). Universidade Federal do Piauí, Teresina.
Di, R.; Farhad Vahidi, S. M.; Ma, Y. H.; He, X. H.; Zhao, Q. J.; Han, J. L.; Guan, W. J.; Chu, M. X.; Sun, W. and Pu, Y. P. 2011. Microsatellite analysis revealed genetic diversity and population structure among Chinese cashmere goats. Animal Genetics 42:428-431.
Evanno, G.; Regnaut, S. and Goudet, J. 2005. Detecting the number of clusters of individuals using the software STRUCTURE: a simulation study. Molecular Ecology 14:2611-2620.
FAO - Food and Agriculture Organization. 2011. Molecular genetics characterization of animal genetic resources. FAO Animal Production and Health Guidelines Nº 9. Rome.
Freitas, V. J. F.; Lopes-Junior, E. S.; Rondina, D.; Salmito-Vanderley, C. S. B.; Salles, H. O.; Simplício, A. A.; Baril, G. and Saumande, J. 2004. Puberty in Anglo-Nubian and Saanen female kids raised in the semi-arid of North-eastern Brazil. Small Ruminant Research 53:167-172. Hale, M. L.; Burg, T. M. and Steeves, T. E. 2012. Sampling for
microsatellite-based population genetic studies: 25 to 30 individuals per population is enough to accurately estimate allele frequencies. PLoS ONE 7:9.
Hartl, D. L. and Clark, A. G. 2010. Princípios de Genética de Populações. 4.ed. ARTMED, Porto Alegre.
IBGE - Instituto Brasileiro de Geografia e Estatística. 2011. Produção da pecuária municipal, 39:1-63. Rio de Janeiro.
Laval, G.; Iannuccelli, N.; Legault, C.; Milan, D.; Groenen, M. A. M.; Giuffra, E.; Andersson, L.; Nissen, P. H.; Jârgensen, C. B.; Beeckmann, P.; Geldermann, H.; Foulley, J-L.; Chevalet, C. and Ollivier, L. 2000. Genetic diversity of eleven European pig breeds. Genetic, Selection, Evolution 32:187-203.
Lessios H. A. 1992. Testing electrophoretic data for agreement with Hardy-Weinberg expectations. Marine Biology 112:517-523. Li, M.; Zhao, S.; Bian, C.; Wang, H.; Wei, H.; Liu, B.; Yu, M.; Fana,
B.; Chen, L.; Zhu, M.; Li, S.; Xiong, T. and Li, K. 2002. Genetic relationships among twelve Chinese indigenous goat populations based on microsatellite analysis. Genetic, Selection, Evolution 34:729-744.
Menezes, M. P. C.; Martinez, A. M.; Ribeiro, M. N.; Pimenta Filho, E. C. and Bermejo, J. V. D. 2006. Caracterização genética de raças caprinas nativas brasileiras utilizando-se 27 marcadores microssatélites. Revista Brasileira de Zootecnia 35:1336-1341. Nomura, K.; Ishii, K.; Dadi, H.; Takahashi, Y.; Minezawa, M.; Cho,
C. Y.; Sutopo Faruque, M. O.; Nyamsamba, D. and Amano T. 2012. Microsatellite DNA markers indicate three genetic lineages in East Asian indigenous goat populations. Animal Genetics 43:760-767.
Oliveira, A. N.; Selaive-Villarroel, A. B.; Monte, A. L. S.; Costa, R. G. and Costa, L. B. A. 2008. Características da carcaça de caprinos mestiços Anglo-Nubiano, Boer e sem padrão racial definido. Ciência Rural 38:1073-1077.
Ramamoorthi, J.; Thilagam, K.; Sivaselvam, S. N. and Karthickeyan, S. M. 2009. Genetic characterization of Barbari goats using microsatellite markers. Journal of Veterinary Science 10:73-6. Santos, F. C. B.; Souza, B. B.; Alfaro, C. H. P.; Cézar, M. F.; Pimenta
tropic semi-arid brazilian northeast. Ciência e Agrotecnologia 29:142-149.
Sider, L. H. and Zaros, L. G. 2008. A biologia avançada e o impacto da genômica na produção de caprinos e ovinos. Embrapa Caprinos e Ovinos. Documentos, 78. Sobral, Embrapa Caprinos e Ovinos.
Silva, R. A. B.; Batista, M. C. S.; Nascimento, C. B.; Alves, R. P. A.; Alves, F. S. F.; Pinheiro, R. R.; Sousa, M. S.; Diniz, B. L. M.; Cardoso, J. F. S. and Paula, N. R. O. 2011. Caracterização zoosanitária da ovinocultura e da caprinocultura na microrregião homogênea de Teresina, Piauí, Brasil. Arquivos do Instituto Biológico 78:593-598.
Solano, R. F.; Marto, R. and Pereira, H. S. 1999. Inseminação artificial em cabras: Avaliação da colocação do sêmen. Revista Brasileira de Reprodução Animal 23:365-367.
Sun, W.; Chang, H.; Ji, D.; Liao, X.; Du, L.; Lu, S. and Kenji, T. 2007. Distance of different ecological type sheep breeds in Mongolia sheep group. Journal of Genetics and Genomics 34:1001-1009. Tóth, G.; Gáspari, Z. and Jurka, J. 2000. Microsatellites in different
eukaryotic genomes: Survey and analysis. Genome Research 10:967-981.