Universidade de Lisboa
Faculdade de Ciências
Departamento de Biologia Animal
Identification of SNPs in genes potentially affected by
domestication to efficiently detect hybridization
between wild and domestic cats
Rodrigo Pacheco Valamatos Costa
Mestrado em Biologia Evolutiva e do Desenvolvimento
Dissertação orientada por:
Professor Doutor Carlos Fernandes
1
Acknowledgements
While developing this thesis, there were many people that stood by me and were able to give me strength and guidance in order to accomplish the task of finishing my work during this last year. I will not be able to name all of them, but my deepest gratitude goes to all of you. First of all, I want to thank my supervisor, Prof. Carlos Fernandes, for giving me the chance to work on this project, and whose work ethic and passion on the areas of mammal conservation and evolutionary biology inspired me to give my all on this thesis.
To my colleague Nuno Martins, who I thank for his patience and kindness in helping me in starting the lab work.
To the various researchers from different teams that work on the 2.2.25 lab and belong to the CE3C research centre, thank you for giving me advice on improving my lab skills.
I would also like to thank all my colleagues and friends from the Master’s degree of Evolutionary and Developmental Biology, for each giving me laughs and joy along this journey. To Teresa Santos, Rita Bastos and André Mesquita, being able to meet and befriend you in this course was nothing less than a blessing. To Jessica Paulo, my long-time friend, thank you for being there when I was feeling stressed and frustrated during the start of the year.
I also cannot forget to thank the people that gave me a home to live in while doing my academic work. My deepest thank you to the institution of Montes Claros, and to the people that I was fortunate enough to share the house with along these 5 years. A special thank you to Ricardo Marcelo and Tiago Fino, who accepted me into MC and to whom I owe a lot of my personal growth and success.
Finally, I must thank my family. To my mother and father, Eugenia and Joaquim, I cannot thank you enough for the support and love that was given to me along the highs and lows of this adventure, and my brother Ricardo, who makes me joyful every time I come to visit. I also would like to highlight my cousin Márcia, for caring and holding me up when I was feeling down, and my aunt Deonilde, for her unwavering support and belief in me while doing my work.
A final thank you to all the friends and family that I did not mention, I hope to be able to help and give support to others in the future as much as I was given during this time.
2
Abstract
The European wildcat (F. s. silvestris) is a medium-sized carnivorous mammal that has suffered significant population decline and range contraction and fragmentation during the last century. The species is also currently threatened by human-mediated hybridization with domestic cats. Their hybrid offspring is fertile and can backcross with pure wildcats, leading to the introgression of domestic cat genes into the wildcat gene pool. This poses a danger to the genetic integrity of the European wildcat, and may contribute to its extinction. Hence, methods are urgently needed that are able to distinguish between pure wildcats and hybrids. However, the accurate detection of hybridization based on available morphological characters is particularly difficult, and even the panels of molecular markers that have been reported either are not highly reliable in detecting hybrids or are too cumbersome to be of practical value for routine use.
Here, I aimed to identify single nucleotide polymorphisms (SNPs) located in genes that may have been affected during the domestication process of the domestic cat (F. s. catus). A total of 51 candidate genes were selected for sequencing of exonic and flanking intronic regions in samples of wildcats and domestic cats. Analysis of the resulting sequences revealed 13 SNPs with elevated genetic differentiation (Fst > 0.8) between the two species. Subsequently, genotypes of first-generation hybrids (F1), second-generation hybrids (F2), and backcrosses with wildcats (B x FSI) and with domestic cats (B x FCA), were simulated in order to evaluate the diagnostic power of the 13 SNP set. Admixture analysis of the simulated genotypes showed that the marker panel could identify and assign each genotype to the correct category, with an accuracy of about 90%. Given the current need for efficient and reliable tools to detect and discriminate samples from wildcats, domestic cats, and their hybrids, this small panel of 13 SNPs with apparently high diagnostic power offers the promise of a convenient and effective assay for surveying and monitoring the distribution and hybridization status of European wildcats.
3
Resumo
A crescente desflorestação e expansão das áreas afectadas pela presença e actividade humana no planeta têm tido inúmeras consequências directas e indirectas na abundância e sobrevivência de espécies sensíveis aos impactos antropogénicos. Entre estas espécies em Portugal destaca-se o gato-bravo europeu (Felis silvestris silvestris). A fragmentação e a degradação do habitat e a perseguição e a caça pelo Homem obrigaram este carnívoro de médio porte a refugiar-se em áreas geográficas restritas, isoladas e dispersas da Europa.
Uma ameaça adicional, críptica e ainda pouco estudada, e potencialmente uma grande ameaça à conservação do gato-bravo europeu, é o seu contacto e interacção com o gato doméstico (Felis catus ou Felis silvestris catus). O gato doméstico é um animal de estimação popular, com uma população mundial estimada em 600 milhões de indivíduos. Estudos anteriores concluíram que o gato doméstico é o resultado de gerações de seleção artificial iniciada em gatos-bravos na pré-história humana, existindo evidências arqueológicas de relações entre gatos e homens desde há 9500 anos. Análises genéticas sugeriram que a área de origem do gato doméstico terá sido o Cresceste Fértil no Médio Oriente, nos primórdios da agricultura e da pecuária, onde a função dos gatos seria principalmente de controlo de roedores. Desde essa altura até tempos recentes a seleção artificial no gato doméstico terá tido uma intensidade relativamente moderada, mas a partir do século XIX esta selecção intensificou-se e, por razões de preferências estéticas, gerou uma abundância de raças com diferentes cores e padrões de pelagem, ainda que mantendo em geral a morfologia anatómica típica da espécie ancestral.
Além de outros potenciais impactos, incluindo ecológicos, comportamentais, parasitológicos e epidemiológicos, um maior contacto entre gatos domésticos e gatos-bravos, tendo em conta a raridade da segunda espécie, aumenta o risco de hibridação entre as duas espécies. Observações de campo e capturas de indivíduos têm demonstrado a existência de híbridos. Sendo estes férteis e capazes de hibridar com indivíduos parentais, a hibridação entre as duas espécies, especialmente se for comum ou frequente, pode assim constituir uma grave ameaça para o gato-bravo, uma vez que os retrocruzamentos entre híbridos e gatos-bravos puros podem levar à introgressão de genes de gato doméstico no genoma do gato-bravo. Este processo pode conduzir à quebra da integridade genética do gato-bravo e, em última análise, à extinção da espécie. Como o gato-bravo é um predador de topo em muitos ecossistemas, a sua extinção pode ter consequências graves nas cadeias tróficas e redes ecológicas. Por conseguinte, é importante implementar medidas de conservação para o gato-bravo. A fim de monitorizar, controlar e reduzir a hibridação, são necessários métodos que sejam capazes de distinguir gatos-bravos puros de híbridos. Os primeiros métodos propostos com este objectivo eram baseados em caracteres anatómicos ou morfológicos, especialmente medidas cranianas e padrões da pelagem. Contudo, vários estudos demonstraram a dificuldade em utilizar estes métodos, bem como a sua ineficiência em certos casos, devido à grande semelhança morfológica frequentemente observada entre gatos-bravos puros e híbridos. Consequentemente, tem crescido o interesse no desenvolvimento e aplicação de abordagens baseadas em marcadores moleculares.
Um dos marcadores genéticos com resultados promissores neste contexto são os microssatélites, que são unidades de pequenas repetições da mesma sequência de nucleótidos (por exemplo, AGAGAGAG) e que têm elevadas taxas de mutação em comparação com outras regiões do genoma. Através do uso de microssatélites, foi possível avaliar o grau de hibridação em várias regiões europeias, desde países como a Itália e Alemanha em que as populações de gatos-bravos e gatos domésticos ainda se encontram bastante diferenciadas, até aos casos da Escócia e Hungria, onde os níveis de introgressão são elevados. No entanto, devido à sua elevada taxa mutacional,
4 os microssatélites tendem a sofrer de homoplasia, o que pode levar à falsa detecção de híbridos e a dificuldades em identificar e distinguir híbridos de gerações diferentes e retrocruzamentos. Assim, as atenções têm-se voltado para outro tipo de marcador molecular potencialmente útil em estudos de hibridação e que, devido à sua baixa taxa de mutação têm menos problemas de homoplasia do que os microssatélites: os “single nucleotide polymorphisms” (SNPs).
Os SNPs consistem em variações na sequência de ADN num só nucleótido, o que faz com que sejam os polimorfismos mais abundantes no genoma. Tendo os SNPs frequentemente apenas duas variações alélicas, se estas tiverem frequências muito diferentes entre duas espécies ou populações, e considerando a geralmente limitada homoplasia nos SNPs, nesses casos os SNPs podem revelar-se altamente diagnósticos. Estudos anteriores têm apresentado painéis de SNPs com capacidade de identificar e distinguir gatos-bravos puros, gatos domésticos puros, e híbridos até à segunda geração. Porém, esses painéis contêm um elevado número de marcadores, não sendo portanto testes prácticos e eficientes. O facto de o poder estatístico desses painéis depender aparentemente do uso de um número elevado de SNPs é possivelmente consequência da maioria deles não estar fixada para alelos diferentes nas duas espécies. É expectável que esses SNPs fixados e altamente diagnósticos estejam em regiões do genoma onde exista elevada diferenciação entre gatos-bravos e gatos domésticos. Recentemente, um estudo procurou identificar as regiões que terão sido mais afectadas pela selecção e influentes na domesticação do gato doméstico. Esse estudo baseou-se na sequenciação do genoma de seis gatos-bravos e 22 gatos domésticos pertencentes a raças com origens geográficas distantes. Regiões do genoma exibindo elevados níveis de diferenciação genética entre gatos-bravos e gatos domésticos, identificados através de valores elevados do índice de fixação (Fst), e simultaneamente baixos níveis de variação intraespecífica, indicados por valores reduzidos de heterozigosidade (Hp), foram consideradas como potencialmente impactadas por selecção positiva. Assim, identificaram-se cinco regiões possivelmente influenciadas por seleção positiva. Estas regiões contêm vários genes envolvidos em diversos processos neurais, sendo muitos desses genes em particular determinantes do comportamento. Notavelmente, vários desses genes codificam proteínas que controlam a sobrevivência e migração das células da crista neural. Esta observação está de acordo e dá suporte à hipótese da síndrome da domesticação, uma teoria que postula que os caracteres morfológicos e comportamentais modificados em mamíferos domesticados têm origem em alterações na migração das células da crista neural durante o desenvolvimento embrionário. Com base nas descobertas desse estudo e de outros semelhantes em outros mamíferos domésticos, é possível focar em genes candidatos a pesquisa de marcadores potencialmente discriminantes entre mamíferos domésticos e os seus ancestrais selvagens.
O presente estudo teve como objetivo descobrir, através da análise de genes candidatos, e testar um painel de SNPs com elevado poder diagnóstico para distinguir com fiabilidade diferentes classes de gatos puros e híbridos. Os genes candidatos estudados pertencem a três categorias funcionais diferentes: i) desenvolvimento neuronal, ii) cor e estrutura da pelagem, e iii) sistema sensorial. Para cada gene selecionado, um ou dois pares de “primers” foram desenhados para amplificar fragmentos de 700-900 pares de bases em amostras de gatos-bravos de Portugal, França e Roménia, e gatos domésticos portugueses. Um conjunto de 13 genes revelou SNPs com valores elevados de diferenciação (Fst > 0.8) entre gatos-bravos e gatos domésticos. Posteriormente, genótipos de híbridos de primeira geração (F1), segunda geração (F2), e retrocruzamentos com gatos-bravos (B x FSI) e com gatos domésticos (B x FCA) foram computacionalmente simulados com base nos genótipos das classes parentais amostrados. Usando os 13 SNPs, cerca de 90% dos indivíduos analisados foram corretamente identificados e atribuídos à sua categoria. Com base nestes resultados, constata-se preliminarmente que os SNPs identificados neste estudo possuem um valor diagnóstico potencialmente comparável ao de painéis com mais SNPs reportados em estudos anteriores. O painel aqui desenvolvido, carecendo obviamente de análises adicionais que confirmem os resultados obtidos, pode futuramente
5 constituir um método eficaz e fiável para caracterizar padrões de hibridação e introgressão em populações de gato-bravo, facilitando o trabalho de indivíduos e instituições envolvidas na conservação da espécie na Europa.
6
Table of Contents
1. Introduction ... 9
1.1 Hybridization and the species concept ... 9
1.2 Hybridization and domestication ... 9
1.3. The wildcat ... 11
1.3.1. The degree of hybridization in European wildcat populations ... 13
1.4. Identifying pure and hybrid individuals: from morphology to genetics ... 13
1.4.1. Microsatellites ... 14
1.4.2. Single nucleotide polymorphisms ... 14
1.5. Objectives... 16
2. Materials and Methods ... 16
2.1. Cat reference samples ... 16
2.2. Candidate genes selection ... 17
2.3. PCR amplification ... 17
2.4. Preliminary analyses of sequences and SNPs ... 18
2.5. Population structure and admixture analysis ... 18
3. Results ... 19
3.1 Candidates Genes ... 19
3.2 SNP discovery ... 21
3.3 Genetic Variation ... 22
3.4 Performance of the SNP panel to distinguish wildcats from domestic cats ... 23
3.5 Admixture Analysis ... 24
4. Discussion... 26
4.1 Candidate genes with diagnostic SNPs ... 27
4.2 Power of the SNP panel to detect hybridization ... 30
4.3 Future perspectives... 31
4.4 Concluding remarks ... 32
7
List of Tables
Table 1. Information about the wildcat and domestic cat samples used in this study. ... 16 Table 2. List of the 51 candidate genes analysed in this study. In the columns from left to right are the gene name (the letter in superscript indicates the consulted source, and these are listed below the table), biological role (N, neuronal development; C, coat colour; S, sensory perception), primer set (A or B), forward and reverse primers (5’ to 3’), samples analysed (according to the sample numbers in Table 1), and the status of the analysis (FA: failed amplification; NE: not enough samples analysed to determine the presence or not of SNPs; NS: enough samples analysed to conclude that the fragment does not contain fixed or highly divergent SNPs between wildcats and domestic cats; PS: enough samples analysed to conclude that the fragment contains one or more SNPs potentially fixed or highly divergent between the species). ... 19 Table 3. Summary of characteristics of the discovered SNPs that were found to be highly differentiated between wildcats and domestic cats. In the columns from left to right are the genes where the SNPs were identified, genomic location of the SNPs (chromosome and nucleotide position in the F. catus genome from Ensembl, FelCat5), the annealing temperatures used in the PCR (for most genes a stepdown protocol was performed), whether the SNPs are exonic or intronic, the alternative nucleotides at each SNP, whether the exonic SNPs are synonymous or nonsynonymous, and the amino acids associated with the alternative allele at each exonic SNP. ... 22 Table 4. Information about the diagnostic SNPs identified in this study. In the columns from left to right are the genes where the SNPs were identified, the “wildcat” allele (“p”), the “domestic cat” allele (“q”), the number of wildcats genotyped (“nW”), the frequency of the “wildcat” allele in the wildcat samples (“pW”), the frequency of the “domestic cat” allele in the wildcat samples (“qW”), the number of domestic cats genotyped (“nD”), the frequency of the “wildcat” allele in the domestic cat samples (“pD”), the frequency of the “domestic cat” allele in the domestic cat samples (“qD”), the Fst values between wildcats and domestic cats, and the In scores. ... 23
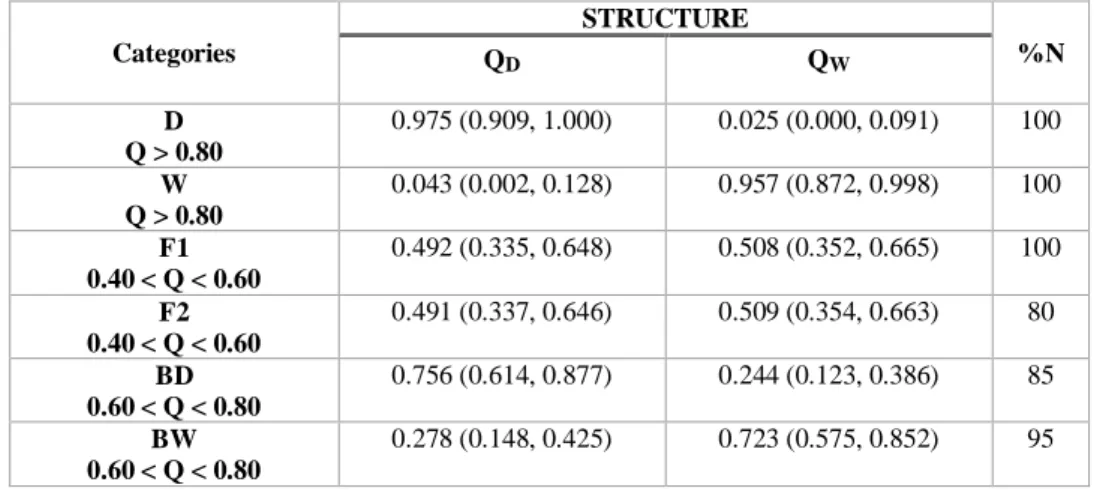
Table 5. STRUCTURE’s estimates and 90% confidence intervals (CI) for the membership proportions of each individual (Q) in, respectively, the wildcat (W) and domestic cat (D) clusters. ... 24 Table 6. NewHybrids results for the mean posterior probabilities of belonging to pure and hybrid categories. N indicates the number of individuals used for each category. Categories are: parental domestic cat (D), parental wildcat (W), first-generation hybrids (F1), second-generation hybrids (F2), backcrosses into domestic cat (BD), and backcrosses into wildcat (BW). ... 25 Table 7. Mean and (within brackets) range of STRUCTURE’s estimates for the membership proportions of each individual belonging to six different genotypic categories in, respectively, the wildcat (W) and domestic cat (D) clusters. The categories, each with 20 individuals, are: parental domestic cats (D), parental wildcats (W), first-generation hybrids (F1), second-generation hybrids (F2), and backcrosses with domestic cats and wildcats (BD and BW, respectively). The last column shows the percentage of correctly assigned individuals (%N). ... 26
8
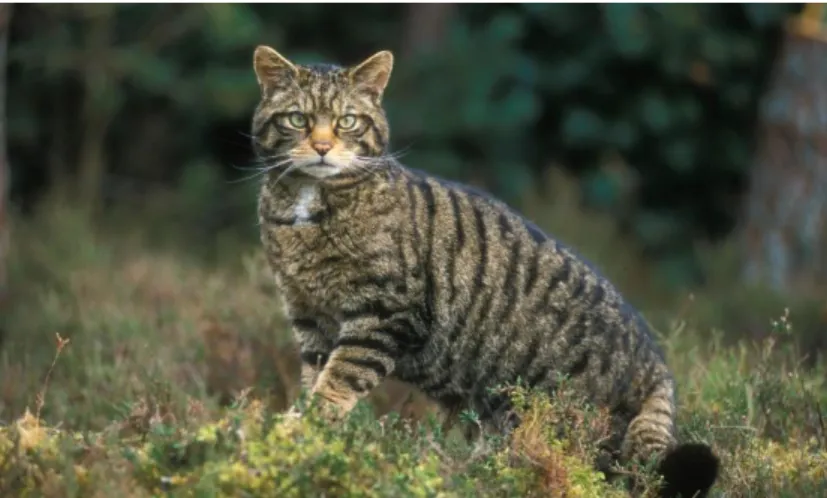
List of Figures
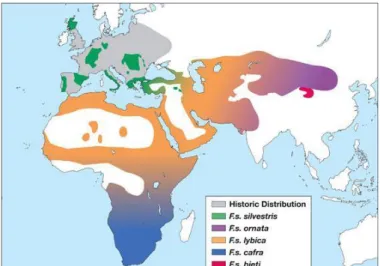
Fig. 1. The European wildcat (F. s. silvestris) (photo from http://www.wild-scotland.org.uk/) . 11 Fig 2. Geographic distribution of the five wildcat subspecies (Luana 2014). ... 12 Fig. 3. Examples of mutation in a single nucleotide polymorphisms (SNP) and in a microsatellite locus. ... 15 Fig. 4. Bar plot of STRUCTURE results, averaged across 15 replicate runs, for K = 2 genetic groups. The analysis was based on 13 SNPs and included 13 individuals (eight wildcats, W, and five domestic cats, D). Each individual is depicted by a column that is partitioned into two (= K) segments, which length is proportional to the ancestry probability of the individual to each group, coloured in orange (W) and blue (D). ... 24 Fig. 5. Bar plot of STRUCTURE results, assuming K =2 and averaged across 15 replicate runs, for six genotypic classes (20 genotypes for each class). W - pure wildcats, D – pure domestic cats, F1 – first-generation hybrids, F2 – second-generation hybrids, BW – backcrosses with wildcat, and BD – backcrosses with domestic cat. ... 25
9
1. Introduction
1.1 Hybridization and the species concept
The process of hybridization is often defined as the reproduction between individuals belonging to genetically distinguishable populations (Barton and Hewitt 1985). In most cases involving different species, these mattings result in sterile offspring (Todesco et al. 2016). However, in other instances, such crosses can produce fertile hybrids that are capable of reproducing with individuals of both parental species. This backcrossing can induce the movement of genes from one of the parental species to the other, which is called introgressive hybridization (Randi et al. 2008).
The phenomenon of hybridisation is closely tied to the discussion around the definition of “Species” as a biological unit. One of the most relevant species concepts brought forth was the one by Ernst Mayr in 1942. In his book, Systematics and the Origins of Species, Mayr defined his “Biological Species Concept” (BSC) in which species are groups of interbreeding populations that are unable to exchange genes with other such groups living in the same area. From this definition, one of the intrinsic properties required for a population to achieve species status is Reproductive Isolation (RI). The mechanisms of reproductive isolation can be categorized as preventing mating and fertilization (prezygotic) or contributing to the low fertility and survival of hybrid offspring (postzygotic) (Servedio and Sætre et al. 2003). Due to various criticisms directed to the BSC, Wu (2001) updated the concept by shifting the focus from RI at the genomic level to interspecific incompatibility at the genic level, specifically in genes that affect differential adaptation. Nevertheless, the BSC is not strictly followed today, as species are no longer viewed as discrete single units, but as more continuous standing points in the hierarchy of biodiversity, partially due to an ever increasing perception of the pervasiveness of hybridization and its importance in evolutionary biology (Mallet 2005).
1.2 Hybridization and domestication
Many authors argue that hybridization has a large beneficial impact on the evolution and diversification of taxa. One reason for this is that hybridization can act as a source of adaptive variation for diverging species, allowing the movement of alleles between genomes, with selection maintaining the differences in genes involved in reproductive isolation (Barton 2013). Hybridization can also lead to the formation of new species if the hybrid populations have improved traits over the parental types, a phenomenon known as heterosis, facilitating their successful establishment and adaptation to new environments (Rieseberg et al. 1999). New hybrid species may carry higher numbers of homologous chromosome pairs (allopolyploidy) than their diploid parents (Abbott et al. 2013). In plant evolution, polyploid hybridization is of major significance, with around 31% of ferns and 15% of flowering plant species having polyploidy origins (Mallet et al. 2007). As for animal species, allopolyploid hybrid speciation is more difficult, since most animals do not reproduce asexually like plants (Seehausen 2004), with fewer exceptions (e.g. Kobel and Pasquier 1986; Chenuil et al. 1999; Ereskovsky et al. 2007). There have also been instances of new hybrid animal species originating without changes in ploidy (homoploid), including butterflies (Beltrán 2007), ants (Schwander et al. 2007), crustaceans (Taylor et al. 2005), and the controversial case of the red wolf (vonHoldt et al. 2011).
10 Although hybridization has been associated with increased biodiversity and speciation, other researchers have also underlined that the formation of hybrids can have negative consequences for the survival of one or both parental species (Rhymer and Simberloff 1986, Wolf et al. 2001).
In general, hybridization can contribute to species extinction in two different ways in function of the fitness of the hybrids. The first is termed demographic swamping, and occurs when hybrization is common and hybrids have lower fitness than either parental species. In this scenario, hybrids may not pose a competitive and genetic threat to the parental species, but the hybridization represents wasted reproductive effort for individuals of the parental species and this can result in a reproductive output below the required replacement levels (Todesco et al. 2016). This process has been reported in pied flycatchers (Ficedula hypoleuca) on the Swedish island of Ӧland, which has been colonized by another species, the collared flycatcher (F. albicollis). (Wiley et al. 2009; Vallin et al. 2010). An alternative mechanism by which hybridization can be a threat to species survival is called genetic swamping. In this case, hybrids do not have a significantly lower fitness than the parental types, and hybridization may thus lead to the loss of one or both parental types (Todesco et al. 2016). Genetic swamping has been documented in several animal taxa (e.g. Nogueira et al. 2011; Derr et al. 2012; Mucci et al. 2012) and appears to be more common than demographic swamping (Ellstrand and Rieseberg 2016).
One of the main scenarios in which hybridization often has negative consequences is the arrival of invasive species that reproduce with native species and decrease their fitness. If this fitness reduction is extreme, it may threaten their survival (Mooney and Cleland 2001). This has been shown to be a common phenomenon and is most likely due to weak prezygotic barriers, as native and introduced species did not evolve together (Todesco et al. 2016). The number of alien species has been steadily increasing during the last 200 years (Seebens et al. 2017). A large part of this increase is due to human activities and interference, from commercial translocations of species to simplifying habitat structure, removing natural barriers to migration (Mooney and Cleland 2001). As a consequence of habitat homogeneity, previously isolated taxa may come into contact and hybridize (Seehausen et al. 2008).
In a survey of 143 empirical studies focused on hybridization, ranging from 1975 to 2015, around 48% of them highlighted hybridization as an extinction threat. For the studies reporting human involvement, 72% indicated the occurrence of at least one extinction (Todesco et al. 2016). Among the anthropogenic extinction threats is the occurrence of interbreeding, especially if frequent, between domestic and wild species (Crispo et al. 2011). Domestication is defined as the selective breeding of individuals originated from a wild ancestral species, in order to exploit or harvest a resource of interest (Terrel et al. 2003). Selective pressure for traits of interest to humans caused the domestic populations to become increasingly genetically distinct from their wild ancestors (Diamond 2002). Therefore, introgressive hybridization with domestic taxa can have some serious detrimental effects. Due to the in general extremely low genetic diversity in domestic populations, their interbreeding with wild species may reduce genetic variation in the latter. Perhaps even more importantly, traits artificially selected in domesticates may be maladaptive in natural environments and, thus, their introgression into wild populations can lead to outbreeding depression and decreased local adaptation (Crispo et al. 2011). Although in some instances, introgressive hybridization appears to not be yet a very serious threat, such as in the Italian population of grey wolves (Canis lupus), in which a study using microsatellites only detected 11 (5%) out of 220 genotyped individuals as admixed (Verardi et al. 2006), in other cases, like the hybridization between the common quail (Coturnix c. coturnix) and domestic Japanese quail (C. c. japonica) in Spain and Italy, it has had effects on phenotypic traits of the
11 former species, with migratory behaviour in particular having been observed to decrease in first-generation hybrids (Barilani et al. 2005).
1.3. The wildcat
The wildcat (Felis silvestris) is a small carnivore belonging to the family Felidae, which comprises around 38 species distributed across the world, inhabiting diverse ecological niches that reflect different evolutionary adaptations (Sunquist and Sunquist 2002) (Fig.1). It is considered a polytypic species, with five recognized subspecies: F. s. silvestris in Europe, F. s. cafra in Southern Africa, F. s. lybica in North Africa and Middle East, and F. s ornata and F. s. bieti in Central Asia (Fig. 2) (Driscoll et al. 2007). The domestic cat is sometimes also considered a subspecies, F. s. catus, since it is derived by domestication of wildcat (Driscoll et al. 2007). A global genetic survey and population structure analysis of wildcats and domestic cats revealed that the latter should have been domesticated in the Near East, being a descendant of domesticated F. s. lybica wildcats (Driscoll et al. 2007). The same study suggested that the domestication process started more than 9000 years ago, contemporary with the development of agriculture and farming in the Fertile Crescent (Driscoll et al. 2007). This is supported by archaeological findings from the site of Shillourokambos in Cyprus, in which a cat skeleton alongside a human skeleton were dated to about 9500 years ago (Vigne et al. 2004). Since then, selective pressures may have been minimal, given that cats were mostly used for rodent control and that most of the 30 to 40 cat breeds have been formed, for essentially aesthetic traits, within the last 150 years (Montague et al. 2014). This left the domestic cat with the same basic morphology as its wild ancestral species, with the main phenotypic difference being coat colour variability, which is mostly controlled by a relatively small number of genes (Pierpaoli et al. 2003).
12 In order to reveal the genomic signatures underlying the domestication of cats, a study by Montague et al. (2014) used a whole-genome analysis of different domestic cat breeds and wildcats to find regions putatively affected by selection. They developed a new higher-quality reference assembly of the domestic cat genome, named FelCat5, which contained 2.35 gigabases (Gb) assigned to all 18 autosomal and X chromosomes. Identifying regions under positive selection can be complicated by the effect of random allele fixation during the formation of new breeds. This effect of genetic drift was mitigated by sequencing 22 domestic cats from six phylogenetically distant and geographically dispersed breeds. These sequences from the 22 domestic cats were then combined to reconstruct an “ancestral” domestic cat genome. Including also a pool of wildcat sequences from the European (F. s. silvestris) and Near East (F. s. lybica) subspecies, the sequences of domestic cat and wildcat were aligned separately to the FelCat5 reference genome for variant detection. The goal was to find regions with low levels of diversity, measured by pooled heterozygosity (Hp), and high levels of domestic cat - wildcat divergence, estimated by the fixation index (Fst). A total of five chromosomal regions fulfilled both these criteria, with 13 identified genes within these locations. Each of these genes plays important roles in neural processes, mainly in synaptic circuitry that influences behaviours like stimulus-reward learning, and neural crest cell migration (Montague et al. 2014). The results seem to be in concordance with the predictions of the domestication syndrome hypothesis, which posits that morphological and physiological traits are altered during domestication as consequences of mild neural crest cell deficits during embryonic development (Wilkins et al. 2014). Moreover, this study reinforces the notion that differences between wild and domesticated cats mostly concern aspects in behaviour like docility and tameness, which do not necessarily represent major prezygotic barriers to reproduction if individuals of the two species meet.
13 1.3.1. The degree of hybridization in European wildcat populations
The European wildcat represents one of the most well-known examples of anthropogenic hybridization. The subspecies suffered a drastic population decline and fragmentation in the 19th century (Enserink and Vogel 2006) and is, in general, currently restricted to relatively small isolated areas, usually densely forested but in proximity to human settlements (McOrist and Kitchener 1994). This has facilitated hybridization between wildcats and their domestic congeners. Being the offspring of such crosses fertile, this makes possible the introgression of domestic cat genes into the wildcat genome, potentially leading to genetic dilution and outbreeding depression (Rhymer and Simberloff 1996). Although the wildcat is currently classified as “Least Concern” by the IUCN Red List of Threatened Species (Yamaguchi et al. 2015), the same assessment underlines that hybridization and introgression in the European subspecies are of major concern and may have resulted in cryptic extirpations of some populations, and recommends further research on those topics.
Recently, researchers have attempted to assess the degree of hybridization in several European regions, and the incidence of this threat is variable between them (Virgós and Moleón 2014). In some areas there have been reports showing high levels of hybridization, as in Scotland (Kitchener et al. 2005) and Hungary (Pierpaoli et al. 2003). In contrast, in countries like Italy (Pierpaoli et al. 2003), France (O`Brien et al. 2009), and Portugal (Oliveira et al. 2008a), wildcat populations appear to be much less introgressed. Importantly, all these studies emphasized the need to continuously monitor hybridization rates and to develop simple but powerful methods that are able to distinguish wildcats from domestic cats and their hybrids.
1.4. Identifying pure and hybrid individuals: from morphology to genetics
Classical methods to assess the pure versus hybrid status, and determine the level of hybridization, of a specimen or population were based on the analysis of their morphology. For instance, Kitchener et al. (2005) analysed the pelage markings and skull measurements of 135 wildcats, domestic cats and hybrid specimens kept in Natural History Museums. They classified the specimens through the use of 20 pelage characters and 37 skull measures, each scored with an integer from 1 (domestic cat) to 3 (wildcat). Skull parameters were not able to separate nominal wildcats from hybrids. Also, no single pelage character was able to accurately distinguish any of the three groups of cats. The most reliable method to distinguish wildcats from hybrids and domestic cats was to use the top seven pelage markings (7PS) that exhibited less intra-group variation across groups, but the authors warned that using this system may not be practical in the field. Natural variation in pelage traits seems to be larger than previously thought, with cats classified as hybrids upon crude examination in the field, subsequently ascertained as wildcats following additional morphological and genetic analyses (Virgós et al. 2014). Accordingly, the development of genetic tests using molecular markers, coupled with data analysis using sophisticated Bayesian clustering algorithms, has vastly improved our ability to screen the genetic makeup of wildcat populations (Randi et al. 2001, Oliveira et al. 2015). However, there is still room for improved methods to reliably distinguish pure wildcats from feral domestic cats and their hybrids, and specially needed are assays that are accurate, cost-effective, and convenient to use (Kitchener et al. 2005, Virgós et al. 2014).
14 1.4.1. Microsatellites
Microsatellites, also known as short tandem repeats (STRs), are molecular markers consisting of short runs of tandemly repeated sequence motifs (e.g. TCTCTCTCTC) abundantly and evenly distributed throughout eukaryotic genomes (Ellegren 2004). Microsatellite polymorphisms derive mainly from variability in length rather than in the primary sequence. With the advent of the Polymerase Chain Reaction (PCR) technique in the 1980s, the genotyping of microsatellite polymorphisms became straightforward and popular (Ellegren 2004). The increasing availability of large panels of highly polymorphic microsatellite markers, together with the use of model-based Bayesian methods for data analysis, provided improved detection of hybridization and hybrid zones (Vähä and Primmer 2006).
Their widespread use was also evident in the case of the wildcat. In a study conducted by Pierpaoli et al. (2003), a total of 211 wild and domestic cats, and 25 known or presumptive hybrids, were obtained from various localities in Portugal, Belgium, Switzerland, Italy, Germany, United Kingdom, Bulgaria, Slovenia and Hungary. Using 12 F. catus microsatellites and multivariate and Bayesian analysis, the study showed that wildcats are still genetically distinct from their domestic counterparts in most central and southwest European locations, but are extensively admixed in the UK and Hungary. A similar study focused on the hybridization levels in the Iberian Peninsula, with a sample size of 75 Portuguese and Spanish wildcats, and 109 feral or purebred domestic cats, estimated that at least 11.4% of the Portuguese wildcats showed signs of introgressive hybridization (Oliveira et al. 2008a; Oliveira et al. 2008b).
However, microsatellites have some issues such as null alleles and size homoplasy, due to their high mutation rate, that introduce ambiguity in data analysis (Morin et al. 2004), and thus optimal marker selection is critical (Vähä and Primmer 2006, Oliveira et al. 2008b).
1.4.2. Single nucleotide polymorphisms
When comparing genomes from individuals of the same or very closely related species, they will be nearly identical, but one of the key differences between them are variations of a single nucleotide at a specific position in the genome. These are called “Single Nucleotide Polymorphisms” (SNPs), which are highly abundant in the genome, for example occurring about once every 1,000 bases in the human genome (Syvänen 2001). SNPs are mostly biallelic, and cannot be more than tetrallelic (Nussberger et al. 2013). As such, they have less variability than STRs. Nevertheless, and overall, SNPs have several advantages over STRs, namely: (1) higher density and more uniform distribution along the genome, (2) less homoplasy as a consequence of a much lower mutation rate, (3) better suited for high-throughput genotyping, (4) easier comparison of results between labs, with less extensive protocol standardization and genotype scoring calibration, (5) Highly applicable to samples with degraded DNA, such as non-invasive or historical samples (Oliveira et al. 2015). These make them highly desirable molecular markers for different types of studies, ranging from estimating population structure (Marchini et al. 2004) and genetic variation (Morin et al. 2004) to phylogeography (Emerson et al. 2010). The use of SNPs in studies of admixture in wild populations is on the rise but still relatively limited (Oliveira et al. 2015). Notably, a study using SNPs to investigate the hybridization between two carp
15 species estimated hybridization rates that were four times higher than those identified using microsatellites, which was interpreted as suggesting a greater diagnostic power for SNPs (Lamer et al. 2015).
The study by Nussberger et al. (2013) was the first that attempted to obtain a set of diagnostic nuclear SNP markers to identify European wildcats, domestic cats, and their hybrids. The authors created a reduced representation library (RRL) by sequencing a small random part of the genome of six wildcats and three domestic cats, and identified 48 SNPs showing high levels of differentiation between the species (Fst > 0.8). An additional of 42 wildcats and domestic cats were genotyped for these 48 SNPs, and used as reference parental genotypes for simulating hybrids. Around 97.3% of all simulated individuals were assigned to their correct hybrid category. However, 9% of parental domestic cats and 18% of parental wildcats were misclassified as third generation hybrids (Nussberger et al. 2013). The main limitation of the study is that it used a geographically restricted set of wildcat samples (Oliveira et al. 2015), all originating from a local population in Switzerland (Nussberger et al. 2013). This is an issue because the European wildcat population has dwindled significantly and become highly fragmented, and the current patterns of genetic diversity and structure are still poorly known. Analysis of parental individuals sampled from a limited geographical area is likely to under-represent variability of the parental species and overestimate their differentiation (Oliveira et al. 2015). Hence, ascertainment bias may affect the utility of the SNP panel in other European wildcat populations.
The more recent study by Oliveira et al. (2015) tried to address the concern for ascertainment bias, by sampling cats across the distribution of the European wildcat. A total of 107 putative wildcats, collected from nine locations far from each other, and 121 domestic cats were analysed. The SNPs used were a combination of markers discovered in previous studies (Kurushima et al. 2012, Lyons et al. 2005, Johnson et al. 2006, Esteves et al. 2007). The results of the admixture analysis showed that the 158 SNPs were successful in identifying F1, F2 and backcross hybrids. The authors also showed that reducing the marker set to the top 35 SNPs with the highest Fst values did not result in losing too much inference power. However, none of the 158 SNPs were fixed between the two species, with only 22 markers being monomorphic in the wildcat sample (Oliveira et al. 2015). Also, the average of the Fst values for the top 35 SNPs was 0.74, which is lower than that for the larger panel of 48 SNPs (average Fst = 0.89) in the study of Nussberger et al. (2013).
Despite the major contributions represented by those two studies, the search is still on for a set of SNP markers that are fixed or extremely differentiated between European wildcats and domestic cats, so that it has power to identify pure wildcats and hybrids across Europe, but that at the same time is small enough to allow the development of a simple genotyping assay that is convenient, rapid and inexpensive.
Fig. 3. Examples of mutation in a single nucleotide polymorphisms (SNP) and in a microsatellite locus.
16 1.5. Objectives
This thesis had the following objectives: i) survey previous literature to select candidate genes that were impacted by positive selection during the domestication of the cat and other mammals; ii) amplify these candidate genes in wildcat and domestic cat samples originating from Portugal, France and Romania; iii) identify possible diagnostic SNPs during sequence analysis; and iv) assess the diagnostic power of the SNPs through assignment tests of observed and simulated genotypes.
2. Materials and Methods
2.1. Cat reference samples
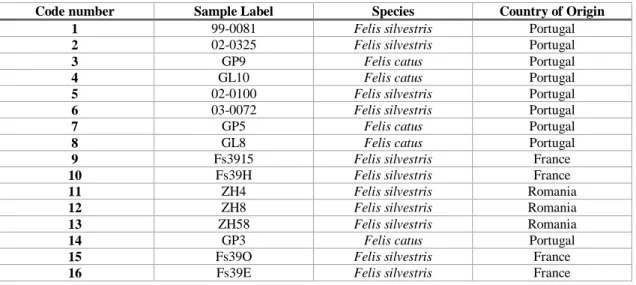
Analyses were conducted on 16 tissue samples from domestic cats and wildcats (Table 1). Domestic cat samples were collected in the municipal catteries of Lisbon (2) and Porto (3). Portuguese wildcat samples (4) were obtained from the Tissue Bank of Wild Vertebrates of the Portuguese Institute of Nature and Forest Conservation (BTVS-ICNF), and the purity of the four wildcat samples has been suggested by the results of the study by Oliveira et al. (2008b). Lastly, samples of wildcats from France (4) and Romania (3) were kindly provided, respectively, by Sébastien Devillard and Sandrine Ruette and by Zsolt Hegyeli; the purity of the French samples is supported by the results of Devillard et al. (2013) and the purity of the Romanian samples is indicated by morphological analyses carried out by Zsolt Hegyeli using the diagnostic definitions proposed by Kitchener et al. (2005). Total genomic DNA was extracted from tissue using the EZNA Tissue DNA kit (Omega Bio-Tek) following the manufacturer’s protocol, and then stored at -20 ºC.
Table 1. Information about the wildcat and domestic cat samples used in this study.
Code number Sample Label Species Country of Origin
1 99-0081 Felis silvestris Portugal 2 02-0325 Felis silvestris Portugal
3 GP9 Felis catus Portugal
4 GL10 Felis catus Portugal 5 02-0100 Felis silvestris Portugal 6 03-0072 Felis silvestris Portugal
7 GP5 Felis catus Portugal
8 GL8 Felis catus Portugal
9 Fs3915 Felis silvestris France 10 Fs39H Felis silvestris France
11 ZH4 Felis silvestris Romania
12 ZH8 Felis silvestris Romania
13 ZH58 Felis silvestris Romania
14 GP3 Felis catus Portugal
15 Fs39O Felis silvestris France 16 Fs39E Felis silvestris France
17 2.2. Candidate genes selection
As stated above, the study by Montague et al. (2014) indicated that genes with roles in neuronal development were among the most involved in cat domestication. Signs of positive selection were also detected in genes associated with sensory perception (e.g. vision and hearing). On the basis that coat colour is one of the most notable phenotypic differences between wildcats and domestic cats, even though artificial selection for coat colour in domestic cats has mostly occurred in the recent past for aesthetic reasons (Lyons 2015, Montague et al. 2014), genes controlling coat colour were considered as possibly eligible for inclusion in the study. Thus, in the search for candidate genes potentially involved in cat domestication, the focus was on those with known associations in domestic cat and/or in other domestic mammals to: (i) neuronal development; (ii) sensory system, specifically olfaction, vision and hearing; and (iii) coat coloration and hair length. In practical terms, the survey concentrated on the literature reporting genes putatively linked to these biological processes and phenotypic traits in the cat and, to increase the number of candidate genes tested, other domestic mammals (e.g. dog Canis familiaris, horse Equus caballus, pig Sus scrofa, goat Capra hircus, and sheep Ovis aries).
The Ensembl genome browser (Yates et al. 2016) was used to (i) verify that, in the case of candidate genes selected from studies on other species, the genes have been sequenced and annotated in the cat, (ii) locate the genes in the genomes of the cat and other domestic mammals, and learn the exon-intron structures, and (iii) export the gene sequences. The software GENEIOUS (Kearse et al. 2012) was used to align the sequences of each gene and design primers complementary to highly conserved regions. All primers were designed with a length of 18 nucleotides, 40-60% G+C content, and each primer pair amplifying 700-1200 base pairs (bp). For each of the 51 genes, two pairs of primers were constructed, with each pair targeting a different gene region and thus different sets of exons and introns (Table 2). For convenience during the laboratory work, two sets of primers were defined (A and B), each containing a primer pair for each gene.
2.3. PCR amplification
In general, after testing and optimization, PCRs were carried out in volumes of 15 µl with 1 x PCR buffer (NZYTech), 1.7 mM MgCl2, 0.1 mM of each dNTP (Bioline), 0.3 µM of each primer, 1 U of NZYTaq II DNA polymerase (NZYTech), and 3–5 ng of DNA template. Thermal cycling conditions consisted of an initial denaturation at 94 °C for 3 min, followed by 35 cycles of 30 s at 94 °C, 30 s at Ta, 30 s at 72 °C, and a final extension of 7 min at 72 °C. Ta is the locus-specific annealing temperature and ranged from 46 to 63 °C. Initially, the annealing temperature tested for all primer pairs was 55 °C, but this was inadequate for many of them and optimization was required to obtain good PCR results. In several cases it was necessary to use stepdown PCR, a variant of PCR that aims to reduce nonspecific background by incrementally lowering the annealing temperature as PCR cycling progresses. This procedure can increase primer specificity and maximise yield (Hecker and Roux 1996). The results of the PCR amplifications were visualized on 2% agarose gels to verify PCR quality, and the PCR products were purified with an Exo-SAP protocol (Hanke and Winke, 1994; Werle et al., 1994) and sequenced at Macrogen Inc.
18 2.4. Preliminary analyses of sequences and SNPs
Sequences were edited, assembled and aligned using BioEdit v. 7.0.5 (Ibis Therapeutics) and Sequencher v. 4.2 (Genes Codes Corporation). Identification of fixed and highly divergent SNPs between wildcats and domestic cats was done by eye.
Preliminary analysis of each gene fragment involved amplification and sequencing of two wildcats and two domestic cats from Portugal. Fragments containing SNPs possibly fixed between the two species were analysed in other samples of Portuguese wildcats and domestic cats. Finally, fragments in which SNPs continued to appear fixed between the two species after increasing their sample size for Portugal, were further analysed in wildcats from France and Romania to check for ascertainment bias.
If a fragment contained more than one fixed or highly divergent SNP, only the one with the highest Fst was included in the subsequent statistical analyses, and the others were removed from the dataset to avoid using very tightly linked markers. Estimates of Fst were calculated using GENEPOP v.4.7.0 (Rousset 2008). The information content of each SNP was also evaluated by computing the “informativeness for assignment” (In) using INFOCALC 1.1. (Rosenberg et al.
2003; Rosenberg 2005). In provides a measure of potential for assignment of an allele to one
population compared with the “average” population; for a given set of populations (K), the minimal In of 0 occurs when all alleles have equal frequencies in all populations, and the maximal
value, lnK, occurs when no alleles are shared between populations.
2.5. Population structure and admixture analysis
The SNPs with the highest Fst were evaluated in their capacity to identify population structure and hybrid classes. These assessments were made through Bayesian clustering methods, namely STRUCTURE v. 2.3.4 (Pritchard et al. 2000) and NewHybrids 1.1 Beta3 (Anderson and Thompson 2002). In STRUCTURE, initial population structure analysis was run with K values ranging from 1 to 3, with 15 replicate runs for each K. For each run, the average proportion of membership (Q) of the sampled populations and the distribution of individual membership proportions (qi) to the two inferred clusters, with their 90% credibility intervals (CIs), were estimated. Parameters were set with the admixture model and correlated allele frequencies, and a burn-in length period of 100,000 followed by 500,000 Markov Chain Monte Carlo (MCMC) iterations. The most likely K value was inferred using the Evanno method (Evanno et al. 2005) in STRUCTURE HARVESTER 0.6.94 (Earl and vonHoldt 2012). The respective 15 runs were averaged using the program CLUMPP v.1.1.2 (Jakobsson and Rosenberg 2007), and the averages were graphically displayed with DISTRUCT v. 1.1 (Rosenberg 2004).
Subsequently, using the domestic cat and wildcat samples as reference genotypes, hybrids were simulated with HYBRIDLAB 1.0 (Nielsen et al. 2006). The program creates multilocus hybrid genotypes by randomly selecting one allele from each of the two parental populations, according to their frequency distribution (Nielsen et al. 2016). The diagnostic power of the markers to correctly identify the parental and hybrid status of the genotypes was then examined in NewHybrids (Anderson and Thompson 2002). NewHybrids estimates the posterior probability of each genotype belonging to one of the following six classes: domestic cats (D), wildcats (W), first generation hybrids (F1), second generation hybrids (F2), backcross with domestic cat (BD), backcross with wildcat (BW).
19
3. Results
3.1 Candidates Genes
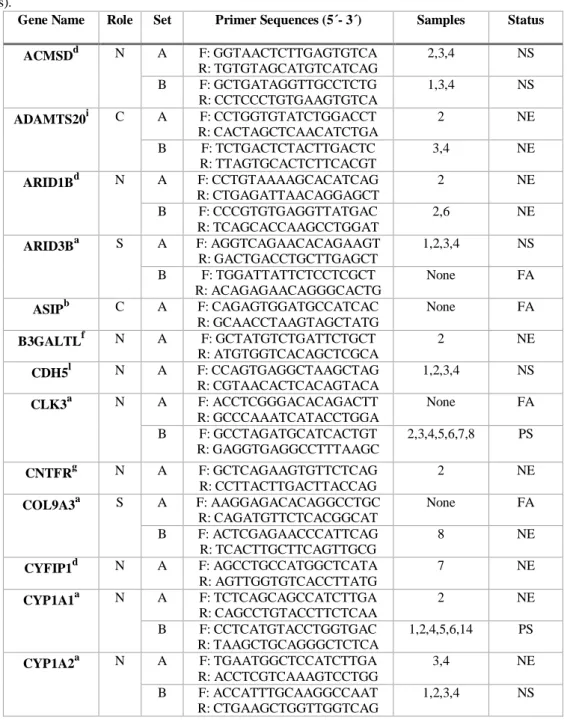
From the literature search for candidate genes potentially affected by cat domestication, a total of 51 genes were selected for this study. Of these, about 72% have roles in neuronal development, 16% in hair structure and colour, and 12% in the sensory system (Table 2).
Table 2. List of the 51 candidate genes analysed in this study. In the columns from left to right are the gene name (the letter in superscript indicates the consulted source, and these are listed below the table), biological role (N, neuronal development; C, coat colour; S, sensory perception), primer set (A or B), forward and reverse primers (5’ to 3’), samples analysed (according to the sample numbers in Table 1), and the status of the analysis (FA: failed amplification; NE: not enough samples analysed to determine the presence or not of SNPs; NS: enough samples analysed to conclude that the fragment does not contain fixed or highly divergent SNPs between wildcats and domestic cats; PS: enough samples analysed to conclude that the fragment contains one or more SNPs potentially fixed or highly divergent between the species).
Gene Name Role Set Primer Sequences (5´- 3´) Samples Status
ACMSDd N A F: GGTAACTCTTGAGTGTCA R: TGTGTAGCATGTCATCAG 2,3,4 NS B F: GCTGATAGGTTGCCTCTG R: CCTCCCTGTGAAGTGTCA 1,3,4 NS ADAMTS20i C A F: CCTGGTGTATCTGGACCT R: CACTAGCTCAACATCTGA 2 NE B F: TCTGACTCTACTTGACTC R: TTAGTGCACTCTTCACGT 3,4 NE ARID1Bd N A F: CCTGTAAAAGCACATCAG R: CTGAGATTAACAGGAGCT 2 NE B F: CCCGTGTGAGGTTATGAC R: TCAGCACCAAGCCTGGAT 2,6 NE ARID3Ba S A F: AGGTCAGAACACAGAAGT R: GACTGACCTGCTTGAGCT 1,2,3,4 NS B F: TGGATTATTCTCCTCGCT R: ACAGAGAACAGGGCACTG None FA ASIPb C A F: CAGAGTGGATGCCATCAC R: GCAACCTAAGTAGCTATG None FA B3GALTLf N A F: GCTATGTCTGATTCTGCT R: ATGTGGTCACAGCTCGCA 2 NE CDH5l N A F: CCAGTGAGGCTAAGCTAG R: CGTAACACTCACAGTACA 1,2,3,4 NS CLK3a N A F: ACCTCGGGACACAGACTT R: GCCCAAATCATACCTGGA None FA B F: GCCTAGATGCATCACTGT R: GAGGTGAGGCCTTTAAGC 2,3,4,5,6,7,8 PS CNTFRg N A F: GCTCAGAAGTGTTCTCAG R: CCTTACTTGACTTACCAG 2 NE COL9A3a S A F: AAGGAGACACAGGCCTGC R: CAGATGTTCTCACGGCAT None FA B F: ACTCGAGAACCCATTCAG R: TCACTTGCTTCAGTTGCG 8 NE CYFIP1d N A F: AGCCTGCCATGGCTCATA R: AGTTGGTGTCACCTTATG 7 NE CYP1A1a N A F: TCTCAGCAGCCATCTTGA R: CAGCCTGTACCTTCTCAA 2 NE B F: CCTCATGTACCTGGTGAC R: TAAGCTGCAGGGCTCTCA 1,2,4,5,6,14 PS CYP1A2a N A F: TGAATGGCTCCATCTTGA R: ACCTCGTCAAAGTCCTGG 3,4 NE B F: ACCATTTGCAAGGCCAAT R: CTGAAGCTGGTTGGTCAG 1,2,3,4 NS
20 DCCa N A F: GGATGCTTTCCAAAGACC R: ATTTGGAAGCACAACTGC 1,2,3,4,5,8,12, 13,15,16 PS DDCe N A F: CATCCTGTTTGCTAACTG R: GGCTCAGCATGTTTGCAC 1,2 NE EDC3a N A F: AGTTCATCCGTGGTGTAC R: TCTCCTAAAGGGGTAGAC 1,2,3,4,5,7,8 NS FAM114A2a N A F: GTTGCATGTGTTTCCTAG R: GCTTGGAGACCAACCATT 1,2,3,4 NS B F: CATGATGCTAACGTGTTC R: CTTGAACCAATGTGCATC 1,2,5,6,7,14 PS GALR1d N A F: GTGCTGTTCGGCCTGATC R: CCGGACTGCAAGTAACTT None FA B F: TGTTGAGGCAGCCGTTCA R: AGTTGCAGGCTTGCTAAC 1,3,5,14 PS GNAQi C A F: ATCCAGAAGCTAGGTAGC R: ACACATTCACACAGAGTC 1,3,4,8 NE GRIA1a N A F: AACTCAGATATGGCCTAG R: GTGAGTTGGAAATTAGCC 1,2,3,4,5,6,7,8 NS GRIA2a N A F: TCTGTGTGATTGTATGCC R: GGTGTCGGAAGACTTATG 1,2,3,4,5,6,7,1 2,13,15,16 PS GRIK3d N A F: CCAGATGAGGAGACAGGT R: CAGCTAGTGAGCGTCAGA 1,2,4 NE GRM8c N A F: AGGTGGAAGACATGCAGT R: CCAGAGAAGGGTTGGCAT 1,2,4 NS HELLSi C A F: CTGATAGAGGGTAGTAGC R: TGCAACTCTTGATCTCAG 4 NE HIPK2d N A F: ACACCTGCTGTCACTCCA R: TGTGCCGCATCTTCAGTA None FA B F: ACTCTTGAATGGAGATCG R: AGAGCCAAGGCGATGCTA 4 NE HTR3Ai N A F: GATGTGAGGTCTGTCTGG R: AGAGACTCTCCACCACGT 1,2,4 NS KRT71b C A F: TCCTCACTGCAAGCTGCA R: TCCTCATAGCTAACCTGA 1,2,3,4,5,6,7,9 ,12,13,14, 15,16 PS LPAR6b C A F: ACACTGTAAACTGGACGT R: AGAGGTGCCCAGTGAAGT 1,2,3 NS MATN2f N A F: CGTGGAGATTGGAGGTCT R: CCTTGCCAACACAGTACC 2,3 NE B F: AGAGTACGGTGTGGACCT R: TCTAGACTAACAGCACAG 6 NE MFAP3a N A F: AGGTTGGTCTCCACTCAC R: GACAATAGCTCCTTGTCA 1,2,3,4,5,8,12, 13 PS MITFi C A F: AGATGCAATCAAGCTGAC R: GTTGCAACAGGCACCTGT 2,3 NE MLPHb C A F: TAGTTGAGCGCCATAGGA R: CTGCTCTCTCAGACACGT 1,2,3,4 NS MYO15Aa S A F: ACTCCGCTCACCTTTGCT R: AAGATCCCGAGGCTGTTC 2,3 NE B F: TCTCCAAGTCCCAGAGCT R: TAATCGTCGTAGCCGTAGC None FA MYO7Aa S A F: ATAGAGAGGCTGGAGGCT R: TACCAGGGTGAAGTCAGC 1,2,3 PS NINJ1f N A F: CGGTGCCTACACTTCACT R: AAGGACCACCAGCTAGTC None FA B F: TGAGCTTCCGTTCTTGGA R: CACATAGGCAGTGTTCAG None FA NPFFR2i N A F: ACAAGGCAGTGTCCCACT R: GAGGGCTTTCAGTACATA 1,2 NE OR10K1a S A F: AAGTTCTTGCTGCCTGCA R: GATTCTAGGCATCCCATT 1 NE OR2B11a S A F: TTGACTCATCACAGGCAC R: CTCAGAGCCTAATCTGCA 1,2,3,4,5,6,7,8 NS PCDHB4a N A F: ACATCCTCATGACAGAAG R: CACCACTTAAAAGTGCGT None FA
21 B F: CCTGAGCTTACCATATCT R: AGAGGTTGGGAAATATCG None FA PKP4g N A F: TCTGTAATGACAGTGGAC R: CAGCCTGAAGTCAGCAGT 1,2,3,4 NS PLEKHH1a N A F: AACCACAGCTCTTCAGAT R: GAGGATGAGAGCCTCATC 1,2,3,4,5,7,8,1 2, 13 PS PPFIA4g N A F: AGGTTACAAGAGTCTGAG R: AAGGGGAGGTTCCAGCAT 2 NE PTPRQa S A F: ACCTACCATAGTACCCGA R: GATTCAGGCTTACCTGAC 1,2,3,4 NS B F: TCACTAGTCCTATGTCAG R: CTTTGGTTTCTCAAGGTC 2,3,4,5 PS RNF103d N A F: GCTTCATGATTGAGGATC R: CTGGACAGCTCTCGAAGT 2 NE B F: TTATTTCCTGGCTACCTG R: GCAAGCTGTAAGATACTC 2,3,4,5 NS SH3GL2d N A F: ACTCATCAATGGTTCCCT R: GAAACCACAGGACAGTCA 1,2,3,4,5,6,7,8 ,12,13,16 PS SLC6A4c N A F: AATTCCGTGCTGTCTGTA R: ACGCACTAAGGAGGCTGA 1,3,4 NS B F: TGCTCAGGCCGTTTCATG R: GGACTAGCTTCAGTTAGT 1,2,3,4,5,6,7,8 PS SPOCK1h N A F: TGTTCAAACGGCTTGGAT R: TCTTCTGCCTGATCTCCA 1,2,4,5,8,14 PS SYNJ2f N A F: GCTGGCCTCTTACTGACT R: AAGAGCTGTGGTCCATGC None FA TLX3d N A F: CAGTGTCAACCTGAGCCT R: TAGCGGGTAGCACAGAAT None FA VEZTd N A F: CACTTTGAGAACCACTGC R: GTGGATTATCTAGCCTTG 1,2,3,4,5,6,7,8 ,12,13,14, 15 PS YWHAHd N A F: TGGATTCAGATCTCAGTG R: TGGCAAGGAAGAATCAGT 2,3,4 NS a – Montague et al. 2014 b – Lyons 2015 c – Wang et al. 2013 d – Axelsson et al. 2013 e – Cagan et al. 2015 f – Schubert et al. 2014 g – Moon et al. 2015
h – The Bovine HapMap Consortium 2015 i – Dong et al. 2015
3.2 SNP discovery
The results of the PCR and sequencing analyses of the first set of primers (set A) yielded that the primer pairs for 28 genes failed to amplify, or did so inconsistently and results were obtained for only a few samples, in both cases preventing any search for SNPs. For another 14 genes, enough samples were sequenced so that a preliminary SNP exploration could be performed, but no potentially useful SNPs were found. For the remaining nine genes, analysis revealed potentially discriminating SNPs between the Portuguese samples of the two species. Of these nine gene fragments, seven were sequenced in Romanian samples, and five in both Romanian and French samples Since there was a large number of unsuccessful primer pairs (28) and gene regions without interesting SNPs (14), a second primer pair was designed for some of these genes; in the case of the latter group of genes, this second primer pair targeted a different gene region than the first primer pair. This second set of primer pairs (set B) targeted fragments of 18 genes. Amplification was unsuccessful for nine, three did not contain relevant SNPs, and the remaining six harboured potentially useful SNPs (Table 2).
22 Hence, potentially discriminatory SNPs were found in 15 genes (CLK3, CYP1A1, DCC, FAM114A2, GARL1, GRIA2, KRT71, MFAP3, MYO7A, PLEKHH1, PTPRQ, SH3GL2, SLC6A4, SPOCK1 and VEZT). However, for MYO7A only one domestic cat sequence was produced (sample GP9), and tentative support for the SNP could only be obtained by the addition of the reference domestic cat genome sequence (FelCat5, Montague et al. 2014) in the alignment. Therefore, conservatively, this gene was not included in further analyses. Additionally, sample Fs3915, a wildcat from France, could be sequenced for only one gene, KRT71, during the timeframe of this thesis. For this reason, this sample was removed from the data set prior to subsequent analyses. It is worth noting that most SNPs were located in intronic regions, with only three SNPs located in exons (Table 3).
3.3 Genetic Variation
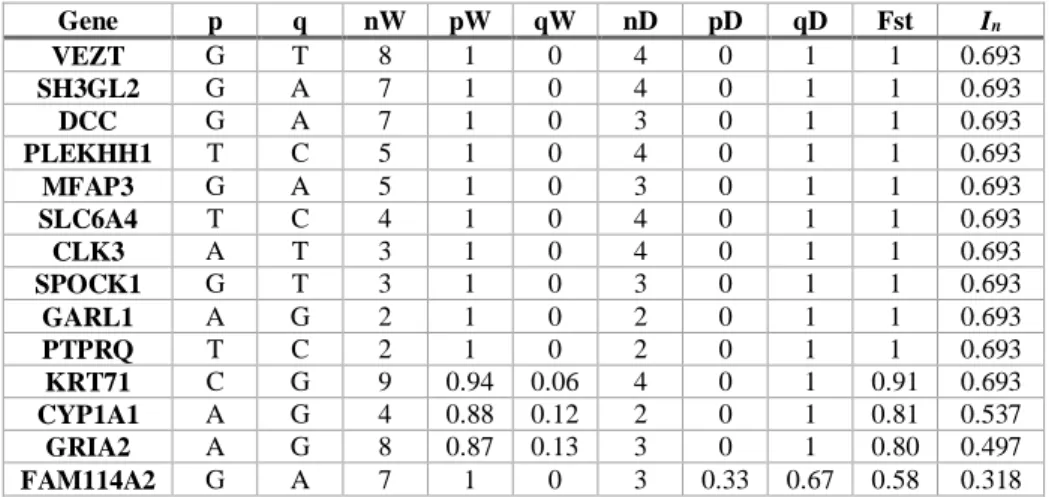
Genetic variability analysis showed that for most of the 14 genes, SNPs were fixed for different alleles in the two species (Table 4). The exceptions were KRT71 and CYP1A1, for both of which one wildcat was heterozygous (samples ZH8 and 02-0325, respectively), GRIA2, for which one wildcat (sample 03-0072) was homozygous for the “domestic allele”, and FAM114A2, for which one domestic cat (sample GP5) was homozygous for the “wild” allele. The Fst values indicated that the SNPs are potentially useful in discriminating wildcats and domestic cats, since for almost all of the SNPs the values were above 0.8. The only exception was for FAM114A2 (Fst = 0.58). The In scores supported the indications from the Fst values, with most SNPs
achieving the maximum possible score for K =2 (i.e., ln (2) = 0.693), with the lowest value belonging to FAM114A2. Given these results, the FAM114A2 SNP was not included in the admixture analysis.
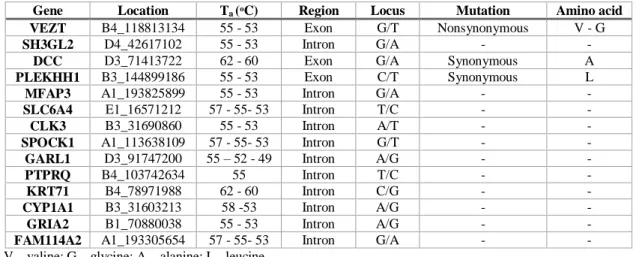
Table 3. Summary of characteristics of the discovered SNPs that were found to be highly differentiated between wildcats and domestic cats. In the columns from left to right are the genes where the SNPs were identified, genomic location of the SNPs (chromosome and nucleotide position in the F. catus genome from Ensembl, FelCat5), the annealing temperatures used in the PCR (for most genes a stepdown protocol was performed), whether the SNPs are exonic or intronic, the alternative nucleotides at each SNP, whether the exonic SNPs are synonymous or nonsynonymous, and the amino acids associated with the alternative allele at each exonic SNP.
V – valine; G – glycine; A – alanine; L - leucine
Gene Location Ta (ᵒC) Region Locus Mutation Amino acid
VEZT B4_118813134 55 - 53 Exon G/T Nonsynonymous V - G
SH3GL2 D4_42617102 55 - 53 Intron G/A - -
DCC D3_71413722 62 - 60 Exon G/A Synonymous A
PLEKHH1 B3_144899186 55 - 53 Exon C/T Synonymous L
MFAP3 A1_193825899 55 - 53 Intron G/A - -
SLC6A4 E1_16571212 57 - 55- 53 Intron T/C - -
CLK3 B3_31690860 55 - 53 Intron A/T - -
SPOCK1 A1_113638109 57 - 55- 53 Intron G/T - -
GARL1 D3_91747200 55 – 52 - 49 Intron A/G - -
PTPRQ B4_103742634 55 Intron T/C - -
KRT71 B4_78971988 62 - 60 Intron C/G - -
CYP1A1 B3_31603213 58 -53 Intron A/G - -
GRIA2 B1_70880038 55 - 53 Intron A/G - -
23
Table 4. Information about the diagnostic SNPs identified in this study. In the columns from left to right are the genes where the SNPs were identified, the “wildcat” allele (“p”), the “domestic cat” allele (“q”), the number of wildcats genotyped (“nW”), the frequency of the “wildcat” allele in the wildcat samples (“pW”), the frequency of the “domestic cat” allele in the wildcat samples (“qW”), the number of domestic cats genotyped (“nD”), the frequency of the “wildcat” allele in the domestic cat samples (“pD”), the frequency of the “domestic cat” allele in the domestic cat samples (“qD”), the Fst values between wildcats and domestic cats, and the In scores.
Gene p q nW pW qW nD pD qD Fst In VEZT G T 8 1 0 4 0 1 1 0.693 SH3GL2 G A 7 1 0 4 0 1 1 0.693 DCC G A 7 1 0 3 0 1 1 0.693 PLEKHH1 T C 5 1 0 4 0 1 1 0.693 MFAP3 G A 5 1 0 3 0 1 1 0.693 SLC6A4 T C 4 1 0 4 0 1 1 0.693 CLK3 A T 3 1 0 4 0 1 1 0.693 SPOCK1 G T 3 1 0 3 0 1 1 0.693 GARL1 A G 2 1 0 2 0 1 1 0.693 PTPRQ T C 2 1 0 2 0 1 1 0.693 KRT71 C G 9 0.94 0.06 4 0 1 0.91 0.693 CYP1A1 A G 4 0.88 0.12 2 0 1 0.81 0.537 GRIA2 A G 8 0.87 0.13 3 0 1 0.80 0.497 FAM114A2 G A 7 1 0 3 0.33 0.67 0.58 0.318
3.4 Performance of the SNP panel to distinguish wildcats from domestic cats
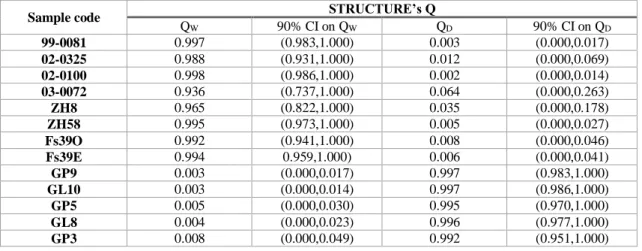
In order to quantify the performance of the selected panel of 13 SNPs to discriminate wildcats and domestic cats, Bayesian clustering analysis in STRUCTURE was conducted without prior population information. The optimal number of clusters was K = 2 with wildcats and domestic cats being clearly separated into two distinct clusters, with all individuals correctly assigned to their putative species of origin (Fig. 4). When the assignment analysis was repeated assuming K = 2, all individuals had an estimated membership coefficient (Q) > 0.95 to their cluster of origin, thus showing no signs of admixture, with the sole exception of a Portuguese wildcat (sample 03-0072) that had Q = 0.94 and a lower limit of the 90% confidence interval below 0.75 (Table 5). Nonetheless, the Q-value of individual 03-0072 in its cluster of origin is still higher than those observed in individuals considered to be pure in previous studies of hybridization in wildcats using SNP markers (Oliveira et al. 2015). Overall, the final 13 individuals were considered as reliable reference wildcat and domestic cat samples for further analysis.
24
Fig. 4. Bar plot of STRUCTURE results, averaged across 15 replicate runs, for K = 2 genetic groups. The analysis was based on 13 SNPs and included 13 individuals (eight wildcats, W, and five domestic cats, D). Each individual is depicted by a column that is partitioned into two (= K) segments, which length is proportional to the ancestry probability of the individual to each group, coloured in orange (W) and blue (D).
Table 5. STRUCTURE’s estimates and 90% confidence intervals (CI) for the membership proportions of each individual (Q) in, respectively, the wildcat (W) and domestic cat (D) clusters.
Sample code STRUCTURE’s Q
QW 90% CI on QW QD 90% CI on QD 99-0081 0.997 (0.983,1.000) 0.003 (0.000,0.017) 02-0325 0.988 (0.931,1.000) 0.012 (0.000,0.069) 02-0100 0.998 (0.986,1.000) 0.002 (0.000,0.014) 03-0072 0.936 (0.737,1.000) 0.064 (0.000,0.263) ZH8 0.965 (0.822,1.000) 0.035 (0.000,0.178) ZH58 0.995 (0.973,1.000) 0.005 (0.000,0.027) Fs39O 0.992 (0.941,1.000) 0.008 (0.000,0.046) Fs39E 0.994 0.959,1.000) 0.006 (0.000,0.041) GP9 0.003 (0.000,0.017) 0.997 (0.983,1.000) GL10 0.003 (0.000,0.014) 0.997 (0.986,1.000) GP5 0.005 (0.000,0.030) 0.995 (0.970,1.000) GL8 0.004 (0.000,0.023) 0.996 (0.977,1.000) GP3 0.008 (0.000,0.049) 0.992 (0.951,1.000) 3.5 Admixture Analysis
To further assess the power of the panel of 13 SNPs to identify pure and hybrid individuals, 13 hybrid F1 genotypes were simulated using HYBRIDLAB and the genotypes of the 13 reference wildcats and domestic cats. The 26 genotypes were analysed in NewHybrids to estimate their posterior probabilities of belonging to the parental and F1 classes. The results showed that all genotypes, both observed and simulated, were assigned to their correct class with a mean posterior probability > 0.99 (Table 5). The performance of the panel was also investigated including a second generation of hybridization in a HYBRIDLAB simulation generating 20 cat genotypes of each of the six following categories: pure parental species, first-generation hybrids (F1), second-generation hybrids (F2), and backcrosses to one parental species or another. Similarly to the previous analysis, all genotypes were correctly assigned to their category with a mean posterior probability > 0.95 (Table 5).
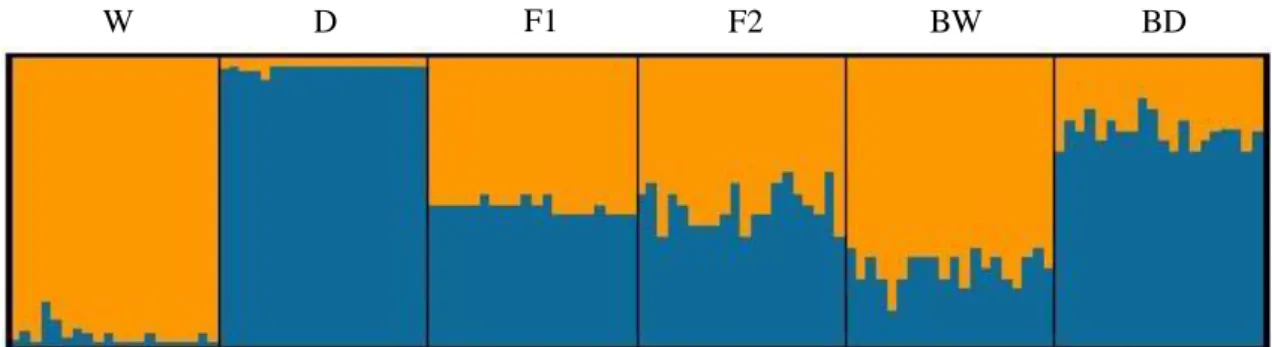
Admixture analysis was also conducted in STRUCTURE with the same 120 genotypes used in the second NewHybrids experiment, and enforcing K = 2 (Fig. 5). STRUCTURE clustered the genotypes in a similar fashion to NewHybrids. The average membership coefficients were > 0.95 for each parental category. All genotypes of the parental and F1 classes were correctly
25 assigned, and the second-generation hybrids and backcrosses also had high percentages of correctly assigned individuals, with 80% or more for each class (Table 7). Thus, in general, the panel had excellent diagnostic power to distinguish pure wildcats from domestic cats and F1 hybrids, and a remarkable ability to even discriminate different hybrid categories.
Table 6. NewHybrids results for the mean posterior probabilities of belonging to pure and hybrid categories. N indicates the number of individuals used for each category. Categories are: parental domestic cat (D), parental wildcat (W), first-generation hybrids (F1), second-first-generation hybrids (F2), backcrosses into domestic cat (BD), and backcrosses into wildcat (BW).
Experiment Category N NewHybrids
D W F1 F2 BD BW Until first generation D 5 0.999 0.000 0.001 - - - W 8 0.000 0.999 0.001 - - - F1 13 0.001 0.001 0.998 - - - Until second generation D 20 0.995 0.000 0.000 0.000 0.005 0.000 W 20 0.000 0.978 0.001 0.003 0.000 0.018 F1 20 0.000 0.000 0.997 0.001 0.001 0.001 F2 20 0.000 0.000 0.001 0.978 0.009 0.012 BD 20 0.005 0.000 0.001 0.017 0.980 0.000 BW 20 0.000 0.003 0.000 0.039 0.000 0.958
Fig. 5. Bar plot of STRUCTURE results, assuming K =2 and averaged across 15 replicate runs, for six genotypic classes (20 genotypes for each class). W - pure wildcats, D – pure domestic cats, F1 – first-generation hybrids, F2 – second-generation hybrids, BW – backcrosses with wildcat, and BD – backcrosses with domestic cat.
F2 BW BD
F1 D