áreas degradadas
SheeP exCreta aS SourCe of NitrouS oxide iN
ryegraSS PaSture iN SoutherN Brazil
Michely tomazi(1,2), emanuelle Cavazini Magiero(1), Joice Mari assmann(1), tatiane Bagatini(1), Jeferson dieckow(3), Paulo Cesar de faccio Carvalho(4) and Cimélio Bayer(5)*
(1) Universidade Federal do Rio Grande do Sul, Departamento de Solos, Programa de Pós-graduação em Ciência do Solo, Porto Alegre, Rio Grande do Sul, Brasil.
(2) Empresa Brasileira de Pesquisa Agropecuária, Embrapa Agropecuária Oeste, Dourados, Mato Grosso do Sul, Brasil. (3) Universidade Federal do Paraná, Departamento de Solos e Engenharia Agrícola, Curitiba, Paraná, Brasil.
(4) Universidade Federal do Rio Grande do Sul, Departamento de Plantas Forrageiras e Agrometeorologia, Porto Alegre, Rio Grande do Sul, Brasil (5) Universidade Federal do Rio Grande do Sul, Departamento de Solos, Porto Alegre, Rio Grande do Sul, Brasil.
* Corresponding author
E-mail: cimelio.bayer@ufrgs.br
aBStraCt
livestock urine and dung are important components of the N cycle in pastures, but little information on its effect on soil nitrous oxide (N2o) emissions is available. We conducted a
short-term (39-day) trial to quantify the direct N2o-N emissions from sheep excreta on an
experimental area of ryegrass pasture growing on a typic Paleudult in southern Brazil. four rates of urine-N (161, 242, 323, and 403 kg ha-1 N) and one of dung-N (13 kg ha-1 N) were applied,
as well as a control plot receiving no excreta. the N2o-N emission factor (ef = % of added N
released as N2o-N) for urine and dung was calculated, taking into account the N2O fluxes in the field, over a period of 39 days. The EF value of the urine and dung was used to estimate the emissions of N2o-N over a 90-day period of pasture in the winter under two grazing intensities
(2.5 or 5.0 times the herbage intake potential of grazing lambs). the soil N2O-N fluxes ranged
from 4 to 353 µg m-2 h-1. the highest N
2O-N fluxes occurred 16 days after application of urine and dung, when the highest soil nitrate content was also recorded and the water-filled pore space exceeded 60 %. the mean ef for urine was 0.25 % of applied N, much higher than that for dung (0.06 %). We found that N2o-N emissions for the 90-day winter pasture period were 0.54 kg ha-1
for low grazing intensity and 0.62 kg ha-1 for moderate grazing intensity. Comparison of the
two forms of excreta show that urine was the main contributor to N2o-N emissions (mean of
36 %), whereas dung was responsible for less than 0.1 % of total soil N2o-N emissions.
Keywords: climate change, emission factor, urine, dung, crop-livestock system.
iNtroduCtioN
Agriculture and land use change in Brazil are responsible for 91 % of the country’s nitrous oxide (N2O) emissions, and deposition of livestock excreta on pasture soils is responsible for 40 % (Brasil, 2010). Despite the importance of the livestock production system, the N2O emission estimates ascribed to livestock in the Brazilian GhG (Greenhouse Gas) National Inventory are still based on default emission factors (EF) used in tier 1 of the IPCC Guidelines (Brasil, 2010): 1 % for sheep and 2 % for cattle excreta. In subtropical southern Brazil, sheep production is an important economic activity and has recently been joined with crop production in what is known as an integrated crop-livestock system (ICl) (Carvalho et al., 2010). however, no study has yet been carried out to assess N2O emissions from dung and urine deposited in those environments and production systems.
the global warming potential of N2O per unit weight is 298 times greater than CO2 and, in addition, it has the capacity of reacting with and depleting stratospheric ozone (Ravishankara et al., 2009; IPCC, 2013), magnifying the negative impacts of its accumulation in the atmosphere. the two main microbial processes of N2O production after urine and dung are deposited on the soil
are nitrification, in which ammonia is oxidized to nitrite and then to nitrate, and denitrification,
in which nitrate is reduced to N2O or N2 (Carter, 2007; Saggar et al., 2008). Both processes probably occur simultaneously due to the diversity of the soil environment (Carter, 2007).
livestock excreta contain readily available N for N2O-producing microorganisms (Castaldi and Smith, 1998; Saggar et al., 2004; Carter, 2007), and in grazed grasslands, urine and dung are considered to be the main N sources for N2O production (de Klein et al., 2003; luo et al., 2008). the magnitude of N2O-N emissions can vary greatly due to the
influence of soil and climate conditions and also
due to the amount of added N. the emission factor (EF) is the rate of emitted N2O-N for added N, and it is used to normalize the effect of added N. For urine, the reported EF ranges from 0.02 to 3.7 % (yamulki et al., 1997; de Klein et al., 2003; luo et al., 2008; hoeft et al., 2012; luo et al., 2013), whereas lower values, ranging from 0.04 to 0.47 %, are reported for dung (Flessa et al., 1996; yamulki et al., 1997; hoeft et al., 2012; luo et al., 2013).
Since little information about the N2O from livestock systems is available for Brazil, we set up an experiment during the winter grazing season under the hypothesis that in Southern Brazil the EF for sheep urine and dung is comparable to the tier 1 default value of 1 % proposed in IPCC guidelines.
Material aNd MethodS
Study site
this study was conducted from September to October 2009 in an integrated crop-livestock system (ICl) experiment established in 2003 at the Agronomic Experimental Station of the Universidade reSuMo: ExcrEtas dE OvinOs cOmO FOntE dE ÓxidO nitrOsO Em PastagEm
dE azEvém nO sul dO Brasil
urina e fezes de ovinos são componentes importantes do ciclo do n em pastagens, mas pouco se sabe sobre o efeito desses nas emissões de óxido nitroso (n2O) para atmosfera. um estudo foi conduzido para
quantificar as emissões de N-N2O provenientes das excretas de ovinos sobre uma pastagem de azevém
num Argissolo Vermelho Distrófico típico no sul do Brasil. Quatro doses de N-urina (161, 242, 323 e 403 kg ha-1 N) e uma de N-fezes (13 kg ha-1 N) foram aplicadas, além de um tratamento-controle sem aplicação de excretas. O fator de emissão de N-N2O (FE = % do N adicionado emitido na forma de N-N2O)
foi calculado para urina e fezes, levando em consideração os fluxos de N2O determinados no período de
39 dias. Os FEs da urina e fezes foram utilizados para estimar as emissões de N-N2O num período de 90
dias da pastagem no inverno, sob duas intensidades de pastejo (2,5 e 5,0 vezes o potencial de consumo dos ovinos). Os fluxos de N-N2O variaram de 4 a 353 µg m-2 h-1. Os fluxos mais elevados de N-N2O ocorreram
16 dias após a aplicação da urina e das fezes, quando os teores mais elevados de nitrato ocorreram e a porosidade preenchida por água excedeu 60 %. O FE médio da urina foi 0,25 % do N aplicado, muito superior ao verificado para as fezes (0,06 %). Considerando o período de 90 dias de utilização da pastagem no inverno, estimou-se que a emissão de N-N2O foi de 0,54 kg ha-1 na intensidade de pastejo baixa e de
0,62 kg ha-1 na intensidade de pastejo moderada. Entre as excretas, a urina foi o principal contribuinte para a emissão de N-N2O (media de 36 %), enquanto as fezes foram responsáveis por menos do que 0,1 %
das emissões totais de N-N2O do solo.
Federal do Rio Grande do Sul, Eldorado do Sul, RS, Brazil (30º 5´ 43” S; 51º 41´ 19” W; altitude 140 m).
Nitrous oxide emissions from sheep urine and dung were monitored in a winter pasture of Italian ryegrass (Lolium multiflorum l.), without grazing. Climate in the area is subtropical, with hot humid summers (Cfa, Köppen) and annual rainfall of 1,440 mm. the soil is a typic Paleudult according to the USA Soil Survey Staff taxonomy
(sandy clay loam Acrisol in the FAO classification
and Argissolo Vermelho Distrófico típico in the
Brazilian classification system), with 190 g kg-1 of clay. At the beginning of the ICl experiment, the soil exhibited the following characteristics in the 0.00-0.20 m depth: 220 g kg-1 of organic matter; 87 and 74 mg dm-3 of K and P (Mehlich-1), respectively; 2.5 cmolc dm-3 of Ca2+, 1.3 cmolc dm-3 of Mg2+, and 0.4 cmolc dm-3 of Al3+. All soil analyses were performed according to tedesco et al. (1995).
dung and urine trial
We previously found that lambs (30 kg live weight) expelled an average of 75 ml urine per urination (10.05 g l-1 of N; 6.8 g l-1 of organic carbon - OC), on an area of 31 cm2 (0.0031 m2); and 2.1 g dry matter (DM) of dung per defecation (9 g kg-1 of N; 414.8 g kg-1 of OC), on an area of 15.5 cm2 (0.00155 m2). Determination of these soil areas influenced by excreta (urine and dung) after
each excretion was used to calculate application rates. Excreta were collected the day before the application and stored at 4 °C. total N was assessed by the semi-micro Kjeldhal method (tedesco et al., 1995) and OC by dry combustion using a tOC-VCSh analyzer (Shimadzu, Japan).
Four application rates of urine, equivalent to 161, 242, 323, and 403 kg ha-1 N (1.6, 2.4, 3.2, and 4.0 l m-2 of urine), and one application rate of dung, equivalent to 13 kg ha-1 N (0.45 kg m-2 of fresh dung), were uniformly applied on separate 1 m2 plots on September 21, 2009, after the Italian ryegrass was cut to 0.10-m height. As a reference, the urine application rate of 242 kg ha-1 N (2.4 l m-2) was the rate equivalent to one urination (75 ml), and the purpose of applying increasing rates of urine was to investigate if urine overlap on the soil would increase the emission factor of N2O. the application rate of dung was equivalent to two defecations because the area where dung is deposited (15.5 cm-2 - 0.00155 m2) is half the area of the soil chamber (31 cm-2 - 0.0031 m2). Control plots received no excreta, and a randomized block design was used, with three replicates.
air sampling and N2o analysis
After excreta application, N2O emissions were measured on days 1, 4, 9, 16, 23, 30, and 39, using the static chamber method (Mosier, 1989). In each 1-m2 plot, we inserted two circular
metal bases, of 0.0031 m2 internal area, up to 0.05 m into the soil. A PVC chamber (Ø = 0.20 m, height = 0.25 m) was water sealed on the metal base and equipped with a three-way valve for air collection, a digital thermometer for headspace temperature measurement, and a fan for air homogenization (zanatta et al., 2010). Air samples were taken with 20-ml polypropylene syringes at the chamber closure and 15, 30 and 45 min later.
Air samples were analyzed in a gas chromatograph equipped with a 63Ni electron capture detector. the soil N2O-N flux rates were calculated for each chamber from the linear increase in headspace N2O concentration over the sampling time. Daily N2O fluxes were calculated from hourly fluxes evaluated
at 9:00 to 11:00 a.m. (Jantalia et al., 2008). More
details of air sampling and gas flux calculation are
presented in Bayer et al. (2015).
We suspended air sampling at 39 days after excreta application because at that time and in the previous sampling (30 days after application), the soil N2O-N emission fluxes had returned to background levels. Cumulative N2O emission was calculated by totaling the daily fluxes across the
39-day assessment period.
N2o emission factor for N sources and estimate of N2o emission for a 90-day grazing season
the N2O-N emission factors (EF) for N applied as urine or dung were calculated using the following equation (de Klein et al., 2003):
EF % N O Ntotal urine or dung N O Ntotal control
( )=( 2 − ( )− 2 − ( ))
×
Urine Dung N applied/ 100 Eq. 1 where EF is the emission factor (N2O-N emitted as % of urine-N or dung-N applied); N2O-N total (urine/dung) and N2O total (control) are the cumulative N2O-N emissions from the soil + urine or dung in the plots with excreta addition, and from soil in the control plots (kg ha-1 N), respectively; and urine/dung N applied is the N rate (kg ha-1 N) applied as urine N or dung.
different statistically) and dung, and the 90-day period, we calculated the N2O emission by excreta. Adding emissions from the control soil in 90 days (extrapolated from the 39-day measurement period), the total N2O-N emission during the grazing season was obtained. We assumed that EF and emissions from the soil were representative for both grazing intensities.
Soil and meteorological parameters
At each air sampling, we measured soil temperature at the 0.05-m depth and collected soil samples in the 0.00-0.10 m layer to determine gravimetric moisture and Nh+4-N and NO−3-N concentrations (tedesco et al., 1995). Soil bulk density and total porosity were measured in cores collected in soil sampling rings of 0.085-m diameter and 0.050-m height. Water-filled pore space (WFPS) was calculated considering gravimetric soil moisture, soil bulk density, and total porosity (Sordi et al., 2014). Rainfall and daily mean air temperature data were recorded in a meteorological station located 500 m away from the study site and
are shown in figure 1.
Statistical analysis
the accumulated N2O-N emission values and the EF values were subjected to analysis of variance, and the difference between means was evaluated by the tukey test at 0.05. Simple and multiple linear regressions were then used to investigate the effect of the soil variables (NO−3-N, Nh
+
4-N and WFPS) on the soil N2O fluxes. The regression was applied to the complete period of measurement and to the beginning (1 to 9 days) and end (16 to 39 days) periods aiming to clarify the effect of soil variables on N2O emissions. In the multiple linear regressions, standardized regression coefficients ß1... ßi were
estimated, which indicate the relative importance of the variables in relation to N2O emissions.
reSultS aNd diSCuSSioN
N2O flux and soil parameters
the N2O-N fluxes from the control soil (without excreta) ranged from 4to 53 µg m-2 h-1 throughout the trial period (Figure 2) and no change occurred
in this flux after dung application, with an almost
negligible effect from the excreta. however, urine increased N2O-N fluxes up to peaks observed 16 days after application. Emission peaks were proportional to urine application rates, with 4.0 l m-2 leading to the maximum flux of 353 µg m-2 h-1. As of 30 days after urine application, no more effect was observed, with N2O-N fluxes returning to the background level. Other studies investigating N2O emissions from urine, likewise under wet winter conditions, reported emission peaks occurring from 12 to 18 days after application (Allen et al., 1996; Williams et al., 1999; luo et al., 2008) and they suggested that the prolonged effect of urine on N2O emissions is associated with the large amount of water in soils
under rainy conditions, where water-filled pore
space (WFPS) can easily exceed 60-65 %.
In our study, the most significant N2O emissions after urine application, observed from 9 to 23 days after application, coincided with a combination of high WFPS (>60 %) (Figure 3a) and high soil NO3-N
Temperature (
oC)
Rainfall (mm)
Days after excreta apllication
30 Rainfall
Temperature
26
22
18
14
12 28
24
20
16
10 100
80
60
40
20
10 90
70
50
30
0
1 4 9 16 23 30 39
figure 1. daily rainfall and mean daily temperature at the study site over the 39-day trial (Sept. 1 to oct. 10, 2009) in an Argissolo Vermelho
Distrófico típico (typic Paleudult).
Days after excreta application
1 4 9 16 23 30
600 Control
Dung Urine 1.6L Urine 2.4L Urine 3.2L Urine 4.0L 500
400
300
200
100
0
39
N2
O-N flux (μg
m
-2
h
-1)
figure 2. N2O-N fluxes after sheep urine and dung
application in a subtropical Argissolo Vermelho
Distrófico típico (typic Paleudult) under italian
ryegrass pasture. urine was applied at four rates (1.6, 2.4, 3.2, and 4.0 l m-2), with 2.4 l m-2
being the mean volume per urination. dung was applied at a rate of 0.135 kg m-2 of dry
(>12 mg kg-1, at the greatest urine application rate) (Figure 3b). the relationship between WFPS and soil N2O emission is shown by the exponential increase in N2O emission from increases in WFPS, especially above 60 % (Figure 4), when denitrification is increased due to the formation of soil anaerobic microsites (Dalal et al., 2003; Smith et al., 2003; Saggar et al., 2004). the effect of soil moisture on N2O emissions is widely recognized (Williams et al., 1999; Saggar et al., 2004; luo et al., 2008), especially when NO−3 (Wrage et al., 2001; de Klein et al., 2003; Carter, 2007; luo et al., 2008) and OC are readily available and not limiting (Allen et al., 1996).
Multiple regression analysis revealed that soil NO−3-N and Nh
+
4-N content were the main factors controlling N2O flux from the soil. linear and positive relationships between soil NO−3 (R2 = 0.50) and Nh+4 (R2 = 0.52) contents and soil N2O emission were observed (table 1). When multiple linear
regression was fitted to jointly account for NO−3 plus Nh+4were jointly accounted, the coefficient of determination increased to 0.76 (table 1). the
normalized β coefficients of the multiple regression,
which express the relative importance of each N form in the emission of N2O, showed similar values for NO−3 (β = 0.52) and NH
+
4 (β = 0.55), suggesting that both forms contributed equally to N2O emissions.
When emission data were grouped into two periods (1 to 9 and 16 to 30 days after application - DAA), we found that from 1 to 9 DAA, Nh+4 (β = 0.87) was much more important than NO−3 (β = 0.04) in explaining variations in N2O emissions (table 1); but they were equally important from 16 to 30 DAA
(β = 0.59 and 0.55 for NH+
4 and NO−3, respectively) (table 1). these findings are in line with soil processes that affect nitrogen transformation, i.e., after urine application, the hydrolysis of urea increased the availability of Nh+4-N (Singh et al., 2008), favoring nitrification (Carter, 2007). When
oxygen is a limiting factor but Nh+4 is not, the alternative nitrifier denitrification may occur, where Nh−3 is oxidized to NO−2, and NO−2 reduced to NO, N2O, and N2 (Wrage et al., 2001; luo et al., 2008). Compared to normal denitrification, this
alternative pathway is less dependent on the level of available OC because the microorganisms participating in nitrifier denitrification are autotrophic (Wrage et al., 2001).
the magnitude of the contributions of each N form in relation to their absolute values is
given by the angular coefficients of the equation
N2O-N = -132.8 + 11.4** NO−
3-N + 4.4** Nh + 4-N (table 1). that means that NO−3-N, with an
angular coefficient of 11.4, had an N2O emission potential about 2.6 times greater than that of Nh+4-N (angular coefficient = 4.4). These results
agree with reports that denitrification is the main
pathway for N2O production when NO−3is available
Figure 3. Water-filled pore space-WFPS (a), soil No3--N
(b), and Nh+4-N (c) after sheep urine and dung application in a subtropical Argissolo Vermelho
Distrófico típico (typic Paleudult) under italian
ryegrass pasture. urine was applied at four rates (1.6, 2.4, 3.2, and 4.0 l m-2), with 2.4 l m-2 being the
mean volume per urination. dung was applied at a rate of 0.135 kg m-2 of dry matter, which is twice
the mean weight per defecation. Bars represent the standard error.
100 (a)
(b)
(c)
Control Dung 90
80
70
50 60
40
30
20
5 25
20
15
10
0
20
1 4 9 16
Days after excreta application
23 30 39
80
60
40
0
Urine 1.6L Urine 2.4L Urine 3.2L Urine 4.0L
WFPS (%)
NO
− -N (mg kg3 -1)
Nh
and OC and humidity are high (Carter, 2007; luo et al., 2008).
Application of dung did not alter soil NO−3 or Nh+4 levels (Figures 3b and 3c), which is the most likely reason for the negligible effect of dung on N2O-N fluxes (Figure 2). This is possibly related to the low amount of N (13 kg ha-1) added by dung in comparison to the high levels provided by urine (161 to 403 kg ha-1). Furthermore, fecal N is mainly organic and its mineralization is gradual, whereas in urine, 50 to 80 % of the N occurs as urea (haynes and Willians, 1993). Finally, the mineralization rate of organic N tends to be lower in sheep than in cattle dung, possibly because sheep dung consists
of pellets covered by a film that makes them more
resistant to fragmentation (Souto et al., 2005). In the present study, it was observed that fecal pellets did not disintegrate until 60 days into the experiment,
which confirms their low mineralization rate.
accumulated N2o emission and emission factors Cumulative N2O-N emission in the 39-day period was similar in the control soil and in dung treated soil (0.16 and 0.17 kg ha-1 N, respectively) (table 2). In urine treated soil, accumulated N2O-N emission ranged from 0.547to 1.423 kg ha-1, increasing linearly with higher application rates of urine-N (N2O-N kg ha-1 = 0.0085 + 0.003 N applied kg ha-1, R2 = 0.95, p<0.01). Our results regarding the treatment of ryegrass pasture with lamb urine were similar to those reported for the application of standard rates of N fertilizer (letica et al., 2010, van Beek et al., 2010). A linear relationship between N2O emission and N-input in various N managed agricultural areas is the concept also used for the current IPCC emission factor methodology (IPCC, 2006).
Comparison of the two forms of excreta show that urine was the main source of N2O-N emission in our study, with an average emission potential four times greater than dung. the EF of dung was 0.06 % and significantly smaller (p<0.05) than the range of 0.22 to 0.31 % (mean of 0.25 %) observed for urine (table 2). however, compared to the default EF of 1 % proposed by the IPCC (2006) and 0.5 % obtained by hoeft et al. (2012) for sheep urine, the mean urine EF of 0.25 % found in our study is comparatively smaller, but similar to the 0.24 % estimated by luo et al. (2013) in a two-year study in four regions of New zealand. Usually, large variations in EF among sites or variation from one year/season to another in
the same site reflect the soil and climatic effects
on N transformation and N2O production. For example, luo et al. (2008) indicated that winter had the potential for producing the highest N2O emissions (EF = 0.73 %) for cattle urine, due to high rainfall and low evapotranspiration, which maintained higher soil moisture and thus
favored denitrification.
the EF value estimated in our study for dung is same of the EF of 0.09 % estimated by hoeft et al. (2012) and the 0.06 % estimated by luo et al. (2013)
table 1. Simple and multiple regression analyses between N2o-N emission (µg m-2 h-1) and No
-3-N and/or
Nh+4-N (mg kg-1) soil contents (Argissolo Vermelho Distrófico típico -(ypic Paleudult), considering the
whole measurement period (1 to 39 days after application-daa), the initial (1 to 9 daa) period, and the final period (16 to 30 DAA)
Period equation fitted r2 β
(1)
No3--N Nh
+ 4-N DAA
N2O-N = -79.9 + 15.3 NO
−
3-N 0.50
1 to 39 N2O-N = - 34.1 + 5.7 Nh +
4-N 0.52
N2O-N = -132.8 + 11.4** NO
−
3-N + 4.4**Nh +
4-N 0.76 0.52** 0.55**
1 to 9 N2O-N = -36.1 + 1.7 NO
−
3-N + 4.59** Nh +
4-N 0.80 0.04 0.87**
16 to 30 N2O-N = -220.4 + 15.3** NO
−
3-N + 5.8** Nh +
4-N 0.78 0.59* 0.55*
(1) β: is the standardized regression coefficient; * and **: significant at 0.05 and 0.01, respectively.
0 30 40 50 60 70 80
WFPS (%) 400
N2O-N = 1.690.064WFPS
R2 = 0.27
p<0.001 300
200
100
0
90
N2
O-N flux (μg m
-2
h
-1)
Figure 4. Relationship between soil water-filled pore space (WfPS) and N2o-N emission after sheep
urine and dung application in a subtropical
Argissolo Vermelho Distrófico típico (typic
for sheep dung. But, the EF estimated here is much lower than the default EF of the N deposited by sheep during grazing of 1 % proposed by the IPCC (2013) and the EF of 0.25 % for dung deposited on grazed pastures in New zealand (Ministry for the Environment, 2012). this result suggests that excreta, urine and dung, should be separately addressed in national greenhouse gas inventories or communications, corroborating the results of Sordi et al. (2014) working with cattle excreta. Due to lack of regional EF values for the South of Brazil, the EF value of 1 % established by the IPCC is adopted in national inventories and potentially overestimates the N2O emissions from pastures.
In our study, we found that the EF values for the different urine application rates did not differ
significantly (p<0.05) from each other, indicating
that there was no difference in N2O emissions by unit of N added if repeated doses of urine were applied to the plots. this is important because it means that EF values can be used to estimate N2O emissions during the grazing of lambs based only on the number of lambs per area, the volume of urine per lamb, and the level of N in the urine and dung. If it had been found that N2O emissions depended on the rate of urine added to an area, it would mean that if urination occurs in an area where urine has recently been deposited, the N2O emission would be greater than if urination had occurred in an area in which urine had not recently been deposited. this
would have made it more difficult to use EF values to
estimate N2O emissions and would have demanded a more probabilistic estimate of the proportion of the area in which more than one consecutive urination had occurred. Fortunately, our result showing that there was no difference between urine rates facilitates the use of EF values.
estimated N2o emission during the entire 90-day grazing season
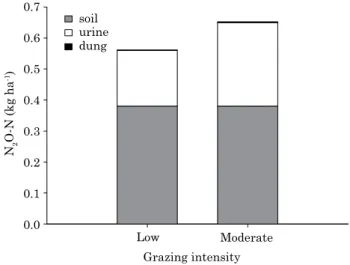
According to the EF values estimated in this study, the soil N2O-N emission over the entire grazing season was 0.54 kg ha-1 for low grazing intensity and 0.62 kg ha-1 under moderate grazing intensity (Figure 5). Across the grazing intensities, more than 63 % of N2O-N emissions came from the soil, 36 % from urine, and less than 1 % from dung (Figure 5).
Considering the use of the default EF of 1 % of N applied as urine and dung proposed by the IPCC (2006), the total N2O-N emissions for the entire 90-day pasture period would be 1.12 and 1.49 kg ha-1 N
2O-N for the low and moderate grazing intensities, respectively. thus, assuming the EF values of this study as more realistic for regional conditions, use of the IPCC default EF overestimated soil N2O emissions from 68 to 94 %. this comparison between total emissions estimated by regional and default
EF highlighted the importance of the present initiatives of regional studies aiming to obtain representative EF values for different soils and sites, including different years with distinct rainfall and temperature conditions.
table 2. Cumulative emission of N2o-N in the whole
measurement period (39 days) and emission factor (ef) of sheep urine and dung applied in a subtropical Argissolo Vermelho Distrófico
típico (typic Paleudult) under italian ryegrass
pasture. urine was applied at four rates (1.6, 2.4, 3.2, and 4.0 l m-2), with 2.4 l m-2 being the
mean volume per urination. dung was applied at a rate of 0.135 kg dry matter m-2, which is
twice the mean weight per defecation
treatment N applied N2o-N emission ef
kg ha-1 %
Control 0 0.156
-Urine 1.6 l 161 0.547 0.24ns
Urine 2.4 l 242 0.697 0.22
Urine 3.2 l 323 0.958 0.25
Urine 4.0 l 403 1.423 0.31
Mean urine 0.25 A
Dung 13 0.164 0.06 B
EF: Emission factor calculated according to equation 1; ns: non-significant differences between means by analysis of variance (p<0.05); values of EF followed by different uppercase letters differ by the tukey test at 0.05. the N-urine applied and the soil N2O-N emission exhibited a quantitative relationship expressed by the following linear equation: N2O-N released = 0.0854 + 0.003 Napplied (R2 = 0.95, p=0.001).
N2
O-N (kg ha
-1) 0.7
0.6
0.5
0.4
0.3
0.2
0.1
0.0
Low soil
urine dung
Moderate
Grazing intensity
figure 5. estimated N2o-N emission from soil plus
sheep urine and dung over the 90-day grazing season in a subtropical Argissolo Vermelho
Distrófico típico (typic Paleudult) under
CoNCluSioNS
For lambs feeding on winter ryegrass pasture in southern Brazil, urine is the main N source responsible for soil N2O emissions.
In this subtropical region, the N2O-N emission factor was 0.25 % for urine and 0.06 % for dung; these emission factors are about 4 and 17 times lower, respectively, than the default 1 % recommended in tier 1 of the IPCC Guidelines. Distinct emission factors for urine and dung suggest that these excreta should be addressed separately in national greenhouse gas inventories.
Considering the site dependence of soil N2O-N emissions, further studies need to be conducted to delineate the N2O emission factors for a wider range of soils and climatic conditions in Brazil.
aCKNoWledgMeNtS
this study was funded by the Brazilian National
Council of Scientific and Technological Development
(CNPq) and by the Research Support Foundation of the State of Rio Grande do Sul (FAPERGS).
refereNCeS
Allen AG, Jarvis SC, headon DM. Nitrous oxide emissions from soils due to inputs of nitrogen from excreta return by livestock on grazed grassland in the U.K. Soil Biol Biochem. 1996;28:597-607.
Bayer C, zschornack t, Pedroso GM, Rosa CM, Camargo ES, Boeni M, Marcolin E, Reis CES, Santos DC. A seven-year study on the effect of fall soil tillage on yield-scaled greenhouse gas
emission from flood irrigated rice in a humid subtropical climate.
Soil till Res. 2015;145:118-25.
Brasil. Ministério da Ciência e tecnologia - MCt. Segunda Comunicação Nacional do Brasil à Convenção-Quadro das Nações Unidas sobre Mudança do Clima. Brasília, DF: 2010. v.1.
Carter MS. Contribution of nitrification and denitrification
to N2O emissions from urine patches. Soil Biol Biochem. 2007;39:2091-102.
Carvalho PCD, Anghinoni I, Moraes A, Souza ED, Sulc RM, lang CR, Flores JPC, lopes Mlt, Silva JlS, Conte O, Wesp CD, levien R, Fontaneli RS, Bayer C. Managing grazing animals to achieve nutrient cycling and soil improvement in no-till integrated systems. Nutr Cycl Agroecosyst. 2010;88:259-73.
Castaldi S, Smith KA. Effect of cycloheximide an N2O and NO3 -production in a forest and an agricultural soil. Biol Fertil Soils. 1998;27:27-34.
Dalal RC, Wnag W, Robertson GP, Parton WJ. Nitrous oxide emission from Australian agricultural lands and mitigation options: a review. Aust J Soil Res. 2003;41:165-95.
de Klein CAM, Barton l, Sherlock RR, li z, littlejohn RP. Estimating a nitrous oxide emission factor for animal urine from some New zealand pastoral soils. Aust J Soil Res. 2003;41:381-99.
Flessa H, Dörsch P, Beese F, König H, Bouwman AF. Influence of cattle wastes on nitrous oxide and methane fluxes in pasture
land. J Environ Qual. 1996;25:1366-70.
haynes RJ, Williams Ph. Nutrient cycling and soil fertility in the grazed pasture ecosystem. Adv Agron. 1993;49:119-99.
hoeft I, Steude K, Wrage N, Veldkamp E. Response of nitrogen oxide emissions to grazer species and plant species composition in temperate agricultural grassland. Agric Ecosyst Environ. 2012;151:34-43. Intergovernmental Panel on Climate Change - IPCC. Climate Change 2013: the physical science basis. Contribution of Working Group I to the Fifth Assessment Report of the Intergovernmental Panel on Climate Change. Cambridge: Cambridge University Press; 2013. Intergovernmental Panel on Climate Change - IPCC. 2006. Guidelines for National Greenhouse Gas Inventories, Prepared by the National Greenhouse Gas Inventories Programme. IGES, Japan; 2006. v.4, Chap. 11.
Jantalia CP, Santos hP, Urquiaga S, Boddey RM, Alves BJR. Fluxes of nitrous oxide from soil under different crop rotations and tillage systems in the South of Brazil. Nutr Cycl Agroecosyst. 2008;82:161-73.
letica SA, De Klein CAM, hoogendoorn CJ, tillmab RW, littlejohn RP, Rutherford AJ. Short-term measurement of N2O emissions from sheep-grazed pasture receiving increasing rates of fertilizer nitrogen in Otago, New zealand. Anim. Prod Sci. 2010;50:17-24.
luo J, lindsey SB, ledgard SF. Nitrous oxide emissions from animal urine application on a New zealand pasture. Biol Fertil Soils. 2008;44:463-70.
luo J, hoogendoornb C, van der Weerdenc t, Saggard S, De Klein C, Giltrapd D, Rolloa M, Rys G. Nitrous oxide emissions from grazed hill land in New zealand. Agric Ecosyst Environ. 2013;181:58-68. Ministry for the Environment. New zealand’s 5th National Communication Climate Change: Policies and Measures; 2012. [Accessed: May 25, 2012]. Available at: http://www.mfe.govt.nz/
publications/climate/nz-fifth-national-communication/page5.html.
Mosier AR. Chamber and isotope techniques. In: Andreae MO, Schimel DS, editors. Exchange of traces gases between terrestrial ecosystems and the atmosphere: report of the Dahlem Workshop. Berlin: Wiley; 1989. p.175-87.
Ravishankara AR, Daniel JS, Portmann RW. Nitrous Oxide (N2O): the dominant ozone depleting substance emitted in the 21st Century. Science. 2009;326:123-5.
Saggar S, Bolan NS, Bhandral R, hedley CB, luo J. A review of emissions of methane, ammonia, and nitrous oxide from animal excreta deposition and farm effluent application in grazed pastures. Nz J Agric Res. 2004;47:513-44.
Saggar S, tate KR, Giltrap Dl, Singh J. Soil-atmosphere exchange of nitrous oxide and methane in New zealand terrestrial ecosystems and their mitigation options: a review. Plant Soil. 2008;309:25-42.
Souto PC, Souto JS, Santos RV, Araujo Gt, Souto lS. Decomposição de estercos dispostos em diferentes profundidades em área degradada no semi-árido da Paraíba. R Bras Ci Solo. 2005;29:125-30. Smith KA, Ball t, Conen F, Dobbie KE, Massheder J, Rey A. Exchange of greenhouse gases between soil and atmosphere: interactions of soil physical factors and biological processes. Eur J Soil Sci. 2003;54:779-91.
Sordi A, Dieckow J, Bayer C, Alburquerque MA, Piva Jt, zanatta JA, tomazi M, Rosa CM, Moraes A. Nitrous oxide emission factors for urine and dung patches in a subtropical Brazilian pastureland. Agric Ecosyst Environ. 2014;190:94-103.
tedesco MJ, Gianello C, Bissani CA, Bohnen h, Volkweiss SJ. Análise de solo, plantas e outros materiais. 2ª.ed. Porto Alegre: Universidade Federal do Rio Grande do Sul; 1995.
van Beek Cl, Pleijter M, Jacobs CMJ, Velthof Gl, van Groenigen JW, Kuikman PJ. Emissions of N2O from fertilized and grazed
grassland on organic soil in relation to groundwater level. Nutr Cycl Agroecosyst. 2010;86:331-40.
Williams Dl, Ineson P, Coward PA. temporal variations in
nitrous oxide fluxes from urine-affected grassland. Soil Biol
Biochem. 1999;31:779-88.
Wrage N, Velthof Gl, van Beusichem Ml, Oenema O. Role of
nitrifier denitrification in the production of nitrous oxide. Soil
Biol Biochem. 2001;33:1723-32.
yamulki S, Jarvis SC. Nitrous oxide emissions from excreta from a simulated grazing pattern and fertilizer application to grassland. In: Jarvis SC, Pain BF, editors. Gaseous nitrogen emissions from grassland. Oxon: CAB International; 1997. p.195-9.
zanatta JA, Bayer C, Vieira FCB, Gomes J, tomazi M. Nitrous
oxide and methane fluxes in South Brazilian Gleysol as affected