BIOMASS OF TREE SPECIES AS A RESPONSE TO PLANTING DENSITY AND
INTERSPECIFIC COMPETITION
1Paulo Sérgio Lima e Silva2, Haroldo Nogueira de Paiva3, Vianney Reinaldo de Oliveira4, Patrícia Liany de
Oliveira Fernandes Siqueira4, Enielson Bezerra Soares5, Alex Lima Monteiro4 e Leonardo Barreto Tavella4
RESUMO– Planting trees is an important way to promote the recovery of degraded areas in the Caatinga region. Experiments (E1, E2, and E3) were conducted in a randomized blocks design, with three, three, and five replicates, respectively. The objectives were to evaluate biomass of the shoots of: a) gliricidia (G) and sabiá (S), as a response to planting density; b) G, S, and neem (N) in competition; c) G, and S in agroforestry. E1 was conducted in split-plots, and planting densities (400, 600, 800, 1000, and 1200 plants ha-1) as subplots. E2 consisted of a factorial comprising the following plots: GGG, NGN, SGS, NNN, GNG, SNS, SSS, GSG, NSN (each letter represents a row of plants). E3 was conducted with G and S in agroforestry experiment. The trees were harvested after 54, 42, and 27 months old, in E1, E2 and E3, respectively. In E1, G presented higher green biomass of the stems and leaf at smaller densities than S, but lower green biomass of branches at most densities. The species did not differ for mean stem dry biomass and leaf dry biomass, but G showed higher branch dry biomass at most densities. Higher planting densities increased green and dry biomass of stems, branches, and leaves in S, but decreased those characteristics in G, with the exception of leaf dry mass, which was not influenced by density. In E2, the behavior of each species was identical in plots containing the same or different species. Griricidia showed the highest green biomass of stems and branches, and the highest values for geren biomass of the leaf were observed for gliricidia and neem. The highest stem, branch, and leaf dry biomass values were obtained for G, S, and N, respectively. In E3, G was superior for stem and leaf green biomass, and for stem and branch dry biomass. There were no differences between species for the other biomass values.
Palavras-chave: Azadirachta indica; Gliricidia sepium; Mimosa caesalpiniifolia.
BIOMASSAS DE ESPÉCIES ARBÓREAS EM RESPOSTA A DENSIDADES DE
PLANTIO E À COMPETIÇÃO INTERESPECÍFICA
ABSTRACT – Existe interesse na recuperação de áreas degradadas da Caatinga com o plantio de árvores. Experimentos (E1, E2 e E3) foram realizados, em blocos ao acaso com três, três e cinco repetições, respectivamente, para avaliar as biomassas da parte aérea: a) da gliricidia (G) e sabiá (S), em resposta à densidade de plantio; b) da G, S e nim (N) em competição; e c) da G e S em experimento agroflorestal. E1 foi realizado com parcelas subdivididas, com densidades de plantio (400, 600, 800, 1.000 e 1.200 plantas ha-1) nas subparcelas. E2 foi um fatorial com as seguintes parcelas: GGG, NGN, SGS, NNN, GNG, SNS, SSS, GSG e NSN (cada letra representa uma fileira de plantas). E3 foi realizado com G e S em experimento agroflorestal. As árvores foram abatidas aos 54, 42 e 27 meses de idade, em E1, E2 e E3, respectivamente. Em E1, G foi superior à S nas biomassas frescas de caules e folhas, nas menores densidades, mas inferior quanto à biomassa fresca de ramos, na maioria das densidades. As espécies não diferiram quanto às biomassas médias secas de caules e folhas, mas G apresentou maior biomassa seca de ramos, na maioria das densidades. O aumento da densidade
1 Recebido em 20.02.2013 aceito para publicação em 11.03.2014.
1. INTRODUCTION
The Northeastern region of Brazil has an area of 1,558,196 km2, which represents almost 18% of the
country’s area. The Brazilian semiarid region comprises about 982,563 km2, and approximately 90% of it lies
within the Northeastern region (IBGE, 2007). The Caatinga biome occupies an area of 844,453 km2 and lies entirely
in the Brazilian semiarid region, comprising nine states (IBGE 2007). The Caatinga importance and characterization with regard to its climate and vegetation have been described by Santos et al. (2010), among others.
In spite of its importance, the Caatinga is threatened by desertification, which is the degradation of land in arid, semi-arid and dry sub-humid areas into desert, resulting from several factors, including climatic variations and human activities (UNITED NATIONS, 1994). Inadequate herd management, abandonment of old cropping areas, firewood extraction to meet the demands of brickyards and potteries, and mining have degraded the Caatinga at different intensities (GALINDO et al., 2010).
One of the strategies for degraded area recovery consists in planting forest species (NICHOLS; CARPENTER, 2006). Planting forest species that improve soil properties via litter deposition is a possibility that reconciles both economic benefits and sustainability (MENDONÇA et al., 2008). Revegetation is the initial activity in the recovery of degraded areas. Maintenance and protection of such areas will allow the recovery process to be completed.
In addition to an interest in degraded area recovery by planting forest species, there is an interest in commercial forest plantations for economic objectives. Such plantations have contributed to reduce degradation in additional areas. Forest plantations have expanded globally and are currently responsible for 5% of the global forest cover, producing 35% of the timber currently traded worldwide (FAO, 2011).
One of the most important decisions in the commercial exploitation of a forest species involves defining its planting density. This is explained because planting density influences several aspects in forest formation, including management practices, timber yield (RONDON, 2002, 2006), and timber quality (JIANG et al., 2007), consequently influencing production costs.
Intercropped forest plantations have been increasingly preferred than monocrops, because the latter can be more resistant to the attack of herbivores and stimulate greater fauna and flora diversity (SEIDEL et al., 2011). In an intercropped system, the objectives are to combine species that provide higher productivity in relation to monocrops, reduce market oscillation risks and the impacts of diseases and pests (KELTY, 2006). Due to the importance of intercropping involving forest species there has been an interest in studying interspecific competition between them (SEIDEL et al., 2011; LEI et al., 2012).
Regarding to degraded area recovery in agroforestry systems and other agricultural systems there has been great interest in fast-growing, well-adapted tree species. Sabiá (Mimosa caesalpiniifolia Benth.), neem (Azadirachta indica A. Juss), and gliricidia [Gliricidia sepium (Jacq) Kunth ex Walp.] meet those requirements and can be used for many purposes. Sabiá is native to the Brazilian semiarid region, while neem and gliricidia are exotic species, which are nevertheless well adapted to the Northeastern semiarid region.
The objectives of this study, targeted at reforestation projects, were: a) estimate gliricidia and sabiá biomass as a response to planting density; b) evaluate gliricidia, sabiá, and neem biomass under competition; c) compare gliricidia and sabiá biomass in an agroforestry experiment.
de plantio aumentou as biomassas frescas e secas de caules, ramos e folhas da S, mas reduziu essas características na G, à exceção da matéria seca de folhas, não influenciada pela densidade. Em E2, cada espécie comportou-se igualmente nas parcelas com a mesma espécie ou com espécies diferentes. As maiores biomassas frescas de caule foram apresentadas por G, as de ramos por G e as de folhas por G e N. As maiores biomassas secas de caules, ramos e folhas foram apresentadas por G, S e N, respectivamente. Em E3, G foi superior quanto às biomassas frescas de caules e folhas e biomassas secas de caules e ramos. Não houve diferenças entre espécies quanto às demais biomassas.
2. MATERIAL AND METHODS
2.1. Common experimental characteristics
Three experiments were carried out at the "Rafael Fernandes" Experimental Farm (5° 3' 38" latitude, -37° 23' 46" longitude, and 18 m elevation). According to Gaussen's bioclimatic classification, the climate in the Mossoró region is classified as type 4ath, or distinctly xerothermic, which means tropical hot with a pronounced, long dry season, lasting from seven to eight months and with a xerothermic index between 150 and 200. The bioclimate in the region is a BSwh, that is, hot, with heavier precipitations delayed toward the fall (KÖPPEN, 1948). The mean minimum temperature in the region is 32.1°C and the maximum is 34.5°C, with June and July as the coolest months, while the mean annual precipitation is around 825 mm.
The soil in the experiment area is classified as a Red-Yellow Argisol, according to the Brazilian Soil Classification System (EMBRAPA, 2006), and as a Ferric Lixisol, according to the Soil Map of the World (FAO, 1988). Soil analyses were conducted according to recommendations outlined by Embrapa (1999).
The trees were felled by cutting at 0.30 m from the ground. The material was separated into three fractions: stems, branches (ramifications with thickness smaller than the thickness of an adult man’s finger, approximately), and leaves. A sample of the three fractions was placed in a forced air circulation oven adjusted at 75°C until constant weight was achieved. In the three experiments, the trees were felled at 54, 42, and 27 months of age, respectively.
We chose to evaluate green and dry biomass, like other authors (BARRETO; FERNANDES, 2001) because the treatment effects on the two types of biomass were often different. In addition, green matter yield can be an interesting parameter for analysis.
The data were submitted to analysis of variance using SAEG - software developed by Universidade Federal de Viçosa (RIBEIRO JÚNIOR, 2001), while regression analyses were made with the software developed by Jandel (1992). The regression equations were selected based on the following criteria: biological explanation of the phenomenon, simplicity of the equation, and testing of equation parameters by Student’s t test at 5% probability.
2.2. Experiment 1: Gliricidia and sabiá biomass as a response to planting density
Sabiá (obtained from natural populations in Mossoró-RN) and gliricidia seeds (obtained from Assessoria e Serviços a Projetos em Agricultura Alternativa - AS-PTA, a non-governmental organization with a branch in Campina Grande-PB), were sown in January 2008. The seeds were sown in black plastic bags, 25 cm tall and 15 cm in diameter, perforated in their bottom third. The bags were filled with substrate consisting of 1/3 manure and 2/3 soil (a Red-Yellow Podzol). The manure analysis indicated: pH (water) = 8.1; Ca = 4.0 cmolc dm-3; Mg = 5.5 cmol
c dm
-3; K = 1.72
cmolc dm-3; Na = 1.84 cmol c dm
-3; Al = 0.00 cmol c dm
-3;
and P = 76.7 mg dm-3
Transplanting was performed in March 2008 in a pristine area that was manually deforested. The seedlings were transplanted to non-fertilized pits measuring 40 cm x 40 cm x 40 cm. The soil analysis indicated: pH = 6.8; Ca = 1.80 cmolc-1dm-3; Mg = 0.40
cmolc dm-3; K = 0.10 cmol c dm
-3; Na = 0.01 cmol c dm
-3;
Al = 0.00 cmolc dm-3; P = 25mg dm-3; organic matter
= 1.90 g kg-1.
Both species were submitted to the following planting densities (plants ha-1): 400 (row spacing of
5.0 m x 5.0 m), 600 (4.0 m x 4.17 m), 800 (4.0 m x 3.12 m), 1000 (4.0 m x 2.5 m), and 1200 (3.0 m x 2.77 m). A complete randomized block design was adopted with five replicates and split-plots (species in plots, planting densities in subplots, and ages in subsubplots). Each subplot consisted of three 30.0 m-long rows of plants. The evaluation (usable) area in each subplot was considered as the space occupied by the plants on the central row, with the elimination of one plant at each end. Control of pests and diseases was performed as needed. Weeds were controlled by hoeing with a harrow attached to a tractor, between plant rows and lines, and by manual hoeing near each plant.
2.3. Experiment 2: Interspecific competition between gliricidia, neem, and sabiá
Transplanting was performed in March/2009, to a soil of the same type previously mentioned, in an area previously cultivated with corn. The seedlings were transplanted to pits measuring 40 cm × 40 cm × 40 cm. The analysis of a soil sample from the experiment area gave the following results: pH = 6.90; P = 40.0 mg dm –3; K+ = 59.0 mg dm –3; Ca2+ = 2.90 cmol
c dm –3; Mg2+ = 1.50 cmol
c dm –3; Al3+ = 0.00 cmolc dm –3;
Na+ = 7.6 mg dm –3; org. matter = 1.29%; textural class
corresponding to sand.
A randomized block design with four replicates was adopted. The cropping systems were compared in plots containing three rows, with four plants in each row, at a spacing of 5.0 m × 5.0 m. In addition to monocrops for the three species, six intercrop combinations were compared: one row of sabiá plants between two rows of gliricidia or neem plants; one row of gliricidia between two rows of sabiá or neem; and one row of neem between two rows of sabiá or gliricidia. In each plot, the area considered for species growth evaluation (usable area) was the area occupied by the two central plants in the central row. A distance of 5.0 m was left between blocks and beside each block. No diseases or pests occurred in the experiment. Weeds were controlled by hoeing with a tractor between plant rows and lines, and by manual hoeing near each plant.
2.4. Experiment 3: Comparison between gliricidia and sabiá biomass in an agroforestry experiment
An agroforestry experiment was set up in April, 2010 in which corn (Zea mays L.), cowpea [Vigna unguiculata (L.) Walp.], gliricidia, and sabiá were grown both as monocrops and intercrops. The experiment was conducted under dryland conditions but received supplementary irrigation as needed. The tree species, with seedlings produced in a similar way as described for experiment-2, were grown at a row spacing of 4.0 m x 4.0 m in plots consisting of three rows, with four trees per row. The analysis of a sample taken from the experimental soil indicated: pH = 7.6; P = 22.6 mg dm –3; K+ = 223.1 mg dm –3; Ca2+
= 3.8 cmolc dm –3; Mg2+ = 2.2 cmol
c dm –3; Al3+ = 0.00 cmolc
dm –3; Na+ = 99.7 mg dm –3; org. matter = 15.9% ; textural
class corresponding to sand.
The experiment was carried out as random blocks with five replicates. Only trees grown as monocrops were felled. Therefore, in the analysis of variance, we considered the data as two treatments organized in five blocks.
3. RESULTS
3.1. Experiment 1
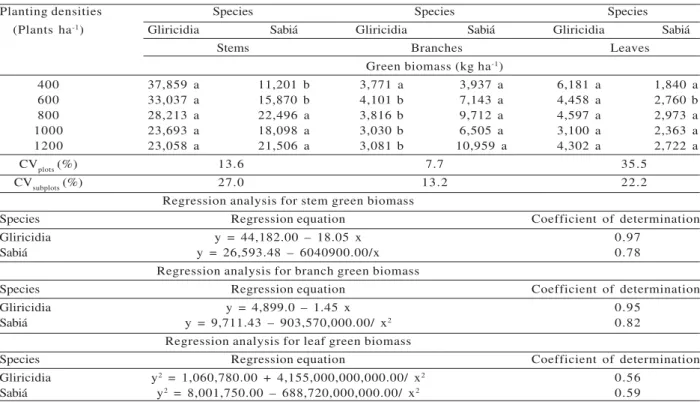
We observed effects of species (E), planting densities (D), and the E x D interaction on green biomass of stem, branch, and leaf. At the two smaller planting densities, gliricidia was superior to sabiá for stem and leaf green biomass (Table 1). At the other densities, no differences were found between species for those characteristics. As to green biomass of the branch, sabiá was superior to gliricidia at the four higher planting densities (Table 1). Increased planting densities reduced gliricidia green biomass of stem, branch, and leaf; in sabiá, however, those characteristics increased (Table 1). The difference in behavior between the two species as a response to increased planting density caused the E x D interaction.
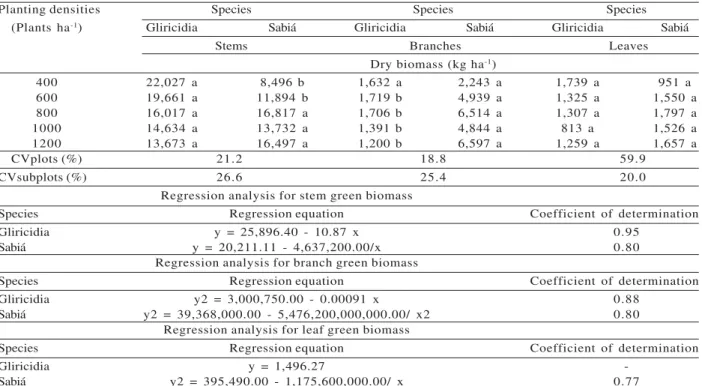
Regarding dry biomass, we also found effects of species (E), planting densities (D), and the E x D interaction on stem, branch, and leaf. Gliricidia was superior to sabiá for stem dry biomass only at the two lower densities. At the other densities, the species did not differ for this parameter. At the four higher densities, sabiá had the greatest branch dry biomass. The two species did not differ for leaf dry biomass at any of the densities evaluated. Increased planting density decreased gliricidia stem and branch dry biomass, but increased those two characteristics as well as leaf dry biomass in sabiá (Table 2).
3.2. Experiment 2
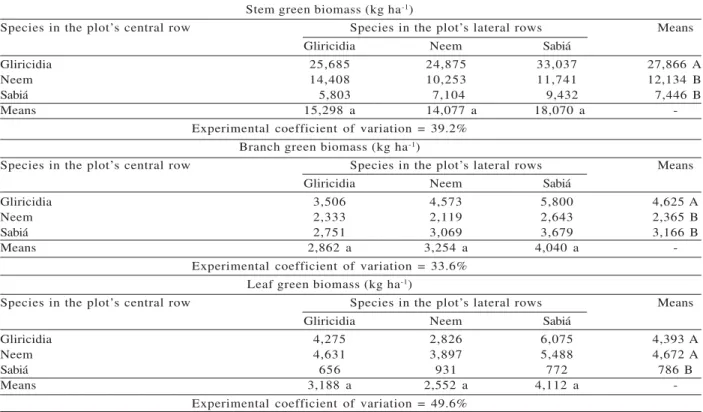
We observed an effect of the plot’s central row (C), but not of the lateral rows (L), or of the C x L interaction, on stem, branch, and leaf green biomass. In other words, the species were different in terms of those biomass values, but all of them showed the same growth when cultivated between rows of plants of the same species or of different species. For this reason, the means comparison test was only applied to the main effect means in both groups of treatments (Table 3). Gliricidia was superior to the other species for stem and branch green biomass, but was only superior to sabiá in terms of leaf green biomass (Table 3).
rows (L), or the C x L interaction, indicating a lack of differences under interspecific competition. However, the means comparison test indicated different results from those obtained for green biomass. Respectively, gliricidia, sabiá, and neem showed the highest stem, branch, and leaf yield values (Table 4).
3.3. Experiment 3
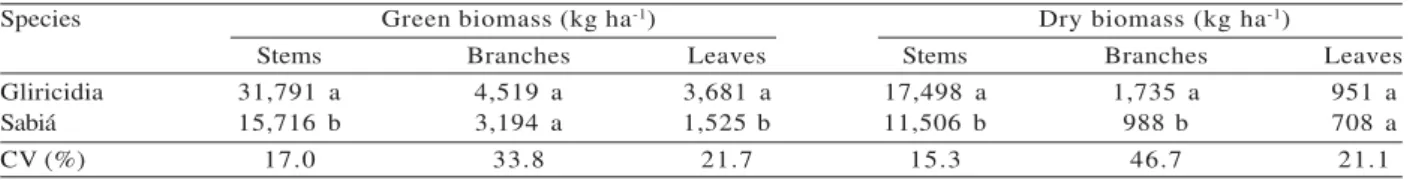
Gliricidia was superior to sabiá regarding to green and dry biomass, with the exception of branch green biomass and leaf dry biomass, characteristics for which the two species did not differ (Table 5).
4. DISCUSSION
4.1. Experiment 1
In plants under relatively small planting densities there is a surplus of resources (water, light, and nutrients) for growth, and competition for those resources is
relatively small. However, as planting density increases, competition also increases and plant growth tends to decrease. Therefore, there is an optimal planting density, i.e., densities smaller than the optimum favor growth, while densities greater than the optimum reduce growth. In trees, this was demonstrated, for example, by Rondon et al. (2002) in Schizolobium amazonicum (Huber) Ducke, and by Kanjanakot and Sahunalu (1999) in Azadirachta indica A. Juss. In this investigation, the amplitude of planting densities tested (from 400 to 1200 plants ha-1) were above the optimal density
for gliricidia, but below the optimal density for sabiá (Tables 1 and 2), since gliricidia biomass decreased while sabiá biomass increased as planting density increased.
The differences in behavior between gliricidia and sabiá in terms of green and dry biomass, is likely associated, at least in part, to growth habit of those species. Gliricidia plants emitted 4.38 shoots per stem,
Table 1 – Mean green biomass yield for stems, branches, and leaves of tree species, at 54 months of age, as a response to planting density1.
Tabela 1 – Médias dos rendimentos de biomassas frescas de caules, ramos e folhas de espécies arbóreas, aos 54 meses de idade, em resposta à densidade de plantio1.
1For each trait, means followed by the same letter in the row do not differ from each other at 5% probability by Tukey’s test. All equation parameters are significant at 5% probability by Student’s t test. CV = experimental coefficient of variation.
1Em cada característica, médias seguidas pela mesma letra na linha não diferem entre si, a 5% de probabilidade, pelo teste de Tukey.
Todos os parâmetros das equações são significativos a 5% de probabilidade, pelo teste t de Student. CV = coeficiente de variação experimental.
Planting densities Species Species Species
(Plants ha-1) Gliricidia Sabiá Gliricidia Sabiá Gliricidia Sabiá
Stems Branches Leaves
Green biomass (kg ha-1)
400 37,859 a 11,201 b 3,771 a 3,937 a 6,181 a 1,840 a
600 33,037 a 15,870 b 4,101 b 7,143 a 4,458 a 2,760 b
800 28,213 a 22,496 a 3,816 b 9,712 a 4,597 a 2,973 a
1000 23,693 a 18,098 a 3,030 b 6,505 a 3,100 a 2,363 a
1200 23,058 a 21,506 a 3,081 b 10,959 a 4,302 a 2,722 a
CVplots (%) 13.6 7.7 35.5
CVsubplots (%) 27.0 13.2 22.2
Regression analysis for stem green biomass
Species Regression equation Coefficient of determination
Gliricidia y = 44,182.00 – 18.05 x 0.97
Sabiá y = 26,593.48 – 6040900.00/x 0.78
Regression analysis for branch green biomass
Species Regression equation Coefficient of determination
Gliricidia y = 4,899.0 – 1.45 x 0.95
Sabiá y = 9,711.43 – 903,570,000.00/ x2 0.82
Regression analysis for leaf green biomass
Species Regression equation Coefficient of determination
Gliricidia y2 = 1,060,780.00 + 4,155,000,000,000.00/ x2 0.56
on average, while sabiá emitted almost half that value (2.45 shoots per stem). In addition, sabiá shoots form smaller angles with the stem than gliricidia shoots. At the same planting density, a higher number of horizontal shoots would imply greater mutual shading in gliricidia plants than in sabiá plants. Under increased planting density, there would be greater mutual shading, which would result in smaller growth. Evidently, other factors associated with the above-ground part as well as with the root system must be related to the difference between growth periods in those two species. For example, Câmara and Endres (2008) verified that sabiá is very tolerant to shading, which suggests higher tolerance at greater planting densities, as observed in this investigation.
No studies were found comparing gliricidia and sabiá biomass. Moura et al. (2006) evaluated sabiá biomass in two stands (containing 1111 and 494 plants
ha-1, respectively) and, contrary to our observations,
verified that total biomass was smaller at a lower planting density. However, the comparison between two stands made by those authors should be conducted cautiously, since their stands were eight and eleven years old, respectively, and age is an important factor that should be taken into consideration in planting density studies involving trees (OLIVEIRA NETO et al., 2003). On the other hand, our results obtained for sabiá were similar to the findings of other authors, that increased planting densities increased biomass (RONDON et al., 2006).
Karim and Savill (1991) observed that increased planting densities in gliricidia increased total biomass per unit area, thus differing from our observations. However, their objective was to evaluate initial growth in that species for alley cropping; they tested planting densities from 1,250 to 20,000 plants ha-1. As highlighted
1For each trait, means followed by the same letter in the row do not differ from each other at 5% probability by Tukey’s test. All equation parameters are significant at 5% probability by Student’s t test. CV = experimental coefficient of variation.
1Em cada característica, médias seguidas pela mesma letra na linha não diferem entre si, a 5% de probabilidade, pelo teste de Tukey.
Todos os parâmetros das equações são significativos a 5% de probabilidade, pelo teste t de Student. CV = coeficiente de variação experimental.
Table 2 – Mean dry biomass yield for stems, branches, and leaves of tree species, at 54 months of age, as a response to planting density1.
Tabela 2 – Médias dos rendimentos de biomassas secas de caule, ramos e folhas de espécies arbóreas, aos 54 meses de idade, em resposta à densidade de plantio1.
Planting densities Species Species Species
(Plants ha-1) Gliricidia Sabiá Gliricidia Sabiá Gliricidia Sabiá
Stems Branches Leaves
Dry biomass (kg ha-1)
400 22,027 a 8,496 b 1,632 a 2,243 a 1,739 a 951 a
600 19,661 a 11,894 b 1,719 b 4,939 a 1,325 a 1,550 a
800 16,017 a 16,817 a 1,706 b 6,514 a 1,307 a 1,797 a
1000 14,634 a 13,732 a 1,391 b 4,844 a 813 a 1,526 a
1200 13,673 a 16,497 a 1,200 b 6,597 a 1,259 a 1,657 a
CVplots (%) 21.2 18.8 59.9
CVsubplots (%) 26.6 25.4 20.0
Regression analysis for stem green biomass
Species Regression equation Coefficient of determination
Gliricidia y = 25,896.40 - 10.87 x 0.95
Sabiá y = 20,211.11 - 4,637,200.00/x 0.80
Regression analysis for branch green biomass
Species Regression equation Coefficient of determination
Gliricidia y2 = 3,000,750.00 - 0.00091 x 0.88
Sabiá y2 = 39,368,000.00 - 5,476,200,000,000.00/ x2 0.80
Regression analysis for leaf green biomass
Species Regression equation Coefficient of determination
Gliricidia y = 1,496.27
by Oliveira Neto et al. (2003), the planting density adopted depends on the objective for which the species is exploited.
4.2. Experiment 2
Under interspecific competition, two processes may occur: competition and facilitation (KELTY, 1992). Competition occurs when two or more plants or populations interact, so that one exerts a negative effect on the other (VANDERMEER, 1989). Such negative effect is manifested via suppression of resources (light, water, and nutrients) or space, or by allelopathy (JOSE et al., 2006). Facilitation occurs when a species has a positive impact on another one (VANDERMEER, 1989). Facilitation may occur in a number of ways a very common example is the
interaction between legumes and non-legumes. Species that are associated with nitrogen-fixing bacteria would increase nitrogen availability for the non-legume species, resulting in superiority of the intercrop over the non-legume monocrop (FORRESTER et al., 2006). Abiotic conditions (PUGNAIRE et al., 2004), such as weather conditions or availability of nutrients (KUNSTLER et al., 2011) will determine the occurrence of competition or facilitation. The biomass of the interacting species will be the net result of the interaction (PUGNAIRE; LUQUE, 2001). Several authors (PUGNAIRE; LUQUE 2001; KUNSTLER et al., 2011) advocate the idea that the role of competition decreases and the role of facilitation increases under stress conditions. The conditions under which this work was conducted were stressful. The region has
Table 3 – Mean green biomass yield of stems, branches, and leaves of tree species at 42 months of age, in the central row of the plot1.
Tabela 3 – Médias dos rendimentos de biomassas frescas de caule, ramos e folhas de espécies arbóreas, aos 42 meses de idade, na fileira central da parcela1.
1In each trait, means followed by the same upper case letter in the column, and by each lower case letter in the row do not differ from one another at 5% probability, by Tukey’s test.
1Em cada característica, médias seguidas pela mesma letra maiúscula na coluna e pela mesma letra minúscula na linha não diferem
entre si, a 5% de probabilidade, pelo teste de Tukey.
Stem green biomass (kg ha-1)
Species in the plot’s central row Species in the plot’s lateral rows Means
Gliricidia Neem Sabiá
Gliricidia 25,685 24,875 33,037 27,866 A
Neem 14,408 10,253 11,741 12,134 B
Sabiá 5,803 7,104 9,432 7,446 B
Means 15,298 a 14,077 a 18,070 a
-Experimental coefficient of variation = 39.2% Branch green biomass (kg ha-1)
Species in the plot’s central row Species in the plot’s lateral rows Means
Gliricidia Neem Sabiá
Gliricidia 3,506 4,573 5,800 4,625 A
Neem 2,333 2,119 2,643 2,365 B
Sabiá 2,751 3,069 3,679 3,166 B
Means 2,862 a 3,254 a 4,040 a
-Experimental coefficient of variation = 33.6% Leaf green biomass (kg ha-1)
Species in the plot’s central row Species in the plot’s lateral rows Means
Gliricidia Neem Sabiá
Gliricidia 4,275 2,826 6,075 4,393 A
Neem 4,631 3,897 5,488 4,672 A
Sabiá 656 931 772 786 B
Means 3,188 a 2,552 a 4,112 a
poor soils and rains are poorly distributed in time and space. As an example, it practically did not rain in the year 2012. Such stressful conditions could contribute to explain why each of the three species studied had the same biomass of the above-ground part when grown between rows of plants of the same species or of different species. In addition, it may have occurred what Kelty (1992) refers to as competitive reduction. Such process may occur spatially, via stratification of leaves or roots, or temporarily due to phenological differences (FORRESTER et al., 2006). Finally, the lack of interspecific competition observed in this work may have been due to the young age of the trees (42 months), in combination with the row spacing adopted (5.0 m x 5.0 m). Some authors have indicated the distance between trees as an important factor in the competition between trees,
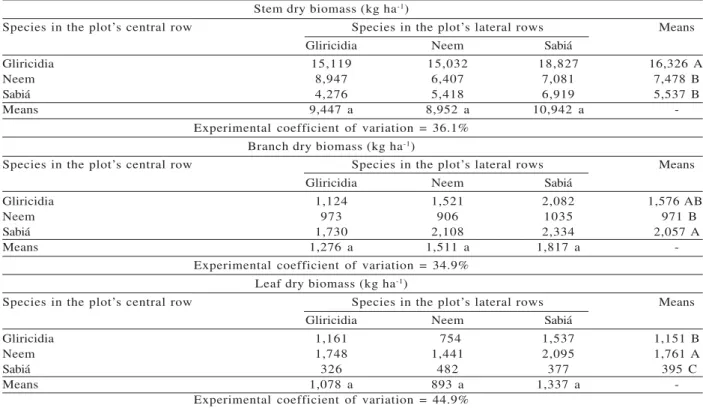
Table 4 – Mean dry biomass yield of stems, branches, and leaves of tree species at 42 months of age, in the central row of the plot1.
Tabela 4 – Médias dos rendimentos de biomassas secas de caules, ramos e folhas de espécies arbóreas, aos 42 meses de idade, na fileira central das parcelas1.
1In each trait, means followed by the same upper case letter in the column, and by each lower case letter in the row do not differ from one another at 5% probability, by Tukey’s test.
1Em cada característica, médias seguidas pela mesma letra maiúscula na coluna e pela mesma letra minúscula na linha não diferem
entre si, a 5% de probabilidade, pelo teste de Tukey.
Stem dry biomass (kg ha-1)
Species in the plot’s central row Species in the plot’s lateral rows Means
Gliricidia Neem Sabiá
Gliricidia 15,119 15,032 18,827 16,326 A
Neem 8,947 6,407 7,081 7,478 B
Sabiá 4,276 5,418 6,919 5,537 B
Means 9,447 a 8,952 a 10,942 a
-Experimental coefficient of variation = 36.1% Branch dry biomass (kg ha-1)
Species in the plot’s central row Species in the plot’s lateral rows Means
Gliricidia Neem Sabiá
Gliricidia 1,124 1,521 2,082 1,576 AB
Neem 973 906 1035 971 B
Sabiá 1,730 2,108 2,334 2,057 A
Means 1,276 a 1,511 a 1,817 a
-Experimental coefficient of variation = 34.9% Leaf dry biomass (kg ha-1)
Species in the plot’s central row Species in the plot’s lateral rows Means
Gliricidia Neem Sabiá
Gliricidia 1,161 754 1,537 1,151 B
Neem 1,748 1,441 2,095 1,761 A
Sabiá 326 482 377 395 C
Means 1,078 a 893 a 1,337 a
-Experimental coefficient of variation = 44.9%
with a strong negative correlation with competitive intensity (SEIDEL et al., 2011).
Some authors (YOSHIDA; KAMITANI, 2000) observed different results from those reported in the present study. In other words, they verified that some species grow less than others, depending on which species were competing. On the other hand, similarly as observed in this study, other authors (KUBOTA; HARA, 1995) observed little interspecific competition between three tree species.
4.3. Experiment 3
superior to sabiá for green and dry biomass, with the exception of branch green biomass and leaf dry biomass, which showed no differences between species.
5. CONCLUSIONS
In E1 gliricidia was superior to sabiá for stem and leaf green biomass at the smaller densities, but was inferior for branch green biomass at most densities. The species did not differ for mean stem dry biomass and leaf dry biomass, but gliricidia showed higher branch dry biomass at most densities. Higher planting densities increased green and dry biomass of stems, branches, and leaves in sabiá, but decreased those characteristics in gliricidia, with the exception of leaf dry matter, which was not influenced by density. In E2, the behavior of each species was identical in plots containing the same species or different species. The highest stem green biomass was obtained for gliricidia; the highest branch green biomass was presented by gliricidia; and the highest leaf green biomass values were obtained for gliricidia and neem. The highest stem, branch, and leaf dry biomass values were obtained for gliricidia, sabiá, and neem, respectively. In E3, gliricidia was superior for stem and leaf green biomass, and for stem and branch dry biomass. There were no differences between species for the other biomass values.
6. REFERENCES
BARRETO, A. C.; FERNANDES, M. F. Cultivo de Gliricídia sepium e Leucaena leucocephala em alamedas visando a melhoria dos solos dos tabuleiros costeiros. Pesquisa
Agropecuária Brasileira, v.36, n.10,
p.1287-1293, 2001.
CÂMARA, C. A.; ENDRES, L. Desenvolvimento de mudas de duas espécies arbóreas: Mimosa caesalpiniifolia Benth e Sterculia foetida L. sob diferentes níveis de sombreamento em viveiro. Floresta, v.38, n.1, p.4351, 2008.
EMPRESA BRASILEIRA DE PESQUISA
AGROPECUÁRIA – EMBRAPA. Centro Nacional de Pesquisa do Solo. Manual de análises químicas de solos, plantas e
fertilizantes. Brasília: 1999. 370p.
EMPRESA BRASILEIRA DE PESQUISA
AGROPECUÁRIA – EMBRAPA. Centro Nacional de Pesquisa do Solo. Sistema brasileiro de classificação de solos. 2.ed. Brasília: 2006. 412p.
FAO. State of the world’s forests. Rome: 2011. 179p.
FORRESTER, D. I. et al. Mixed-species plantations of Eucalyptus with nitrogen-fixing trees: a review.
Forest Ecology and Management, v.233,
n.2-3, p.211-230, 2006.
GALINDO, I. C. L. et al. Relações solo-vegetação em áreas sob processo de desertificação no município de Jataúba-PE. Revista Brasileira de Ciência do Solo, v.32, n.3, p.1283-1296, 2008.
INSTITUTO BRASILEIRO DE GEOGRAFIA E
ESTATÍSTICA - IBGE. Contagem da
população. Rio de janeiro, 2007. (www.ibge.gov.br, acesso em 25/10/2012).
JANDEL. Jandel TBLCURVE. Table
Curve 3.0. Curve fitting software. Corte
Madera: Jandel Scientific, 1992. 280p.
Table 5 – Mean green and dry biomass yield for stems, branches, and leaves of tree species at 27 months of age1.
Tabela 5 – Médias dos rendimentos de biomassas frescas e secas de caules, ramos e folhas de espécies arbóreas aos 27 meses de idade1.
1 For each trait, means followed by the same letter do not differ from each other at 5% probability by Tukey’s test.
1 Em cada característica, médias seguidas pela mesma letra não diferem entre si, a 5% de probabilidade, pelo teste de Tukey.
Species Green biomass (kg ha-1) Dry biomass (kg ha-1)
Stems Branches Leaves Stems Branches Leaves
Gliricidia 31,791 a 4,519 a 3,681 a 17,498 a 1,735 a 951 a
Sabiá 15,716 b 3,194 a 1,525 b 11,506 b 988 b 708 a
JIANG, Z. et al. Effect of stand and tree attributes on growth and wood quality
characteristics from a spacing trial with Populus xiaohei. Annals of Forest Sciences, v.64, n.8, p.807-814, 2007.
JOSE, S.; WILLIAMS, R.; ZAMORA, D. Belowground ecological interactions in mixed-species forest plantations. Forest E c o l o g y a n d M a n a g e m e n t, v. 2 3 3 , n . 2 , p.231-239, 2006.
KARIM, A.B.; SAVILL, P.S. Effect os spacing on growth and biomass production of Gliricidia sepium (Jacq) Walp. in alley cropping system in Sierra Leone. Agroforestry Systems, v.16, n.3, p.213-222, 1991.
KANJANAKOT, C.; SAHUNALU, P. Effect of stand density on growth and yield of 12-year old Azadirachta indica A. Jusss. Var. siamensis Valeton plantation. Thai Journal of Forestry, v.18, n.1, p.106-116, 1999.
KELTY, M. J. The role of species mixtures in plantation foresty. Forest Ecology and Management, v.233, n.1-2, p.195-204, 2006.
KELTY, M.J. Comparative productivity of monocultures and mixed-species stands. In: KELTY, M.J.; LARSON, B.C.; OLIVER, C.D. (Ed.). The ecology and silviculture of mixed-species forests. Dordrecht: Springer, 1992. 308p. pp.125-141.
KÖEPPEN, W. Climatologia; con un
estudio de los climas de la tierra.
México : Fondo de CulturaEconomica, 1948. 478 p.
KUBOTA, Y.; HARA, T. Tree competition and species coexistence in a sub-boreal Forest Northern Japan. Annals of Botany, v.76, n.5, p.503-512, 1995.
KUNSTLER, G. et al., Effects of competition on tree radial-growth vary in importance but not in intensity along climatic gradients. Journal of Ecology, v.99, n.2, p.300-312, 2011.
LEI, P.; SCHERER-LORENZEN, M.; BAUHUS, J. Belowground facilitation and competition in Young tree species mixtures. Forest Ecology and Management, v.265, n.2, p.191-200, 2012.
MENDONÇA, A. V. R. et al. Desempenho de quatro espécies de Eucalyptus spp em plantios puros e consorciados com sabiá (Mimosa caesalpiniaefolia Benth) em cava de extração de argila. Revista Árvore, v.32, n.3, p.395-405, 2008.
MOURA, O. N. et al. Distribuição de biomassa e nutrientes na parte aérea de Mimosa
caesalpiniaefolia Benth. Revista Árvore, v.30, n.6, p.877-884, 2006.
NICHOLS, J. D.; CARPENTER, F. L. Interplanting Inga edulis yields nitrogen benefits to Terminalia amazonia. Forest Ecology and
Management, v.233, n.2/3, p.344-351, 2006.
OLIVEIRA NETO, S. N. et al. Produção e distribuição de biomassa em Eucalyptus
camaldulensis Dehn. Em resposta à adubação e ao espaçamento. Revista Árvore, v.27, n.1, p.15-23, 2003.
PUGNAIRE, F. I.; ARMAS, C.; VALLADARES, F. Soil as a mediator in plant-plant interactions in a semi-arid community. Journal of Vegetation Science, v.15, n.1, p.85-92, 2004.
PUGNAIRE, F. I.; LUQUE, M. T. Changes in plant interactions along a gradient of environmental stress. Oikos, v.93, n.1, p.42-49, 2001.
RIBEIRO JÚNIOR, J. I. Análises estatísticas no SAEG. Viçosa, MG: Universidade Federal de Viçosa, 2001. 301p.
RONDON, E. V. Estudo de biomassa de Tectona grandis L.f. sob diferentes espaçamentos no estado de São Paulo. Revista Árvore, v.30, n.3, p.337-341, 2006.
RONDON, E. V. Produção de biomassa e crescimento de árvores de Schizolobium amazonicum (Huber) Ducke sob diferentes espaçamentos na região de mata. Revista Árvore, v.26, n.5, p.573-576, 2002.
SEIDEL, D. et al. Crown plasticity in mixed forests – Quantifying assymmetry as a measure of
competition using terrestrial laser scanning. Forest
Ecology and Management, v.261, n.11,
p.21234-2132, 2011.
UNITED NATIONS. Agenda 21. Brasília: Senado Federal, 1994. 591p.
VANDERMEER, J. H. The ecology of
intercropping. New York: Cambridge University Press, 1989. 237p.