R E S E A R C H
Open Access
Mathematical modelling of vector-borne
diseases and insecticide resistance evolution
Maria Laura Gabriel Kuniyoshi
*and Fernando Luiz Pio dos Santos
Abstract
Background: Vector-borne diseases are important public health issues and, consequently, in silico models that simulate them can be useful. The susceptible-infected-recovered (SIR) model simulates the population dynamics of an epidemic and can be easily adapted to vector-borne diseases, whereas the Hardy-Weinberg model simulates allele frequencies and can be used to study insecticide resistance evolution. The aim of the present study is to develop a coupled system that unifies both models, therefore enabling the analysis of the effects of vector population genetics on the population dynamics of an epidemic.
Methods: Our model consists of an ordinary differential equation system. We considered the populations of susceptible, infected and recovered humans, as well as susceptible and infected vectors. Concerning these vectors, we considered a pair of alleles, with complete dominance interaction that determined the rate of mortality induced by insecticides. Thus, we were able to separate the vectors according to the genotype. We performed three numerical simulations of the model. In simulation one, both alleles conferred the same mortality rate values, therefore there was no resistant strain. In simulations two and three, the recessive and dominant alleles, respectively, conferred a lower mortality.
Results: Our numerical results show that the genetic composition of the vector population affects the dynamics of human diseases. We found that the absolute number of vectors and the proportion of infected vectors are smaller when there is no resistant strain, whilst the ratio of infected people is larger in the presence of insecticide-resistant vectors. The dynamics observed for infected humans in all simulations has a very similar shape to real epidemiological data.
Conclusion: The population genetics of vectors can affect epidemiological dynamics, and the presence of
insecticide-resistant strains can increase the number of infected people. Based on the present results, the model is a basis for development of other models and for investigating population dynamics.
Keywords: Epidemiology, Population genetics, Tropical diseases, Insecticides, Theoretical modelling, Numerical simulation, ODE system
Background
Vector-borne diseases represent one sixth of the sick-nesses suffered by the global population, and more than 50% of the world is at risk of coming down with them [1]. One of the most common vector-borne diseases is dengue fever, as 2.5 billion people from more than 100 countries are infected with this illness [2]. Dengue is a
*Correspondence: [email protected]
Department of Biostatistics, Institute of Biosciences of Botucatu, São Paulo State University (UNESP - Universidade Estadual Paulista), Street Prof. Dr. Irina Delanova Gemtchujnicov, no number, Rubião Júnior, zip code 18618-693, PO box 510, Botucatu, SP, Brazil
febrile infectious disease caused by a virus of the fam-ily Flaviridae, which has four distinct serotypes: DEN1, DEN2, and DEN3 DEN4. The transmission mechanism is through bites of female mosquitos from the genus
Aedes, especially of the speciesAedes aegypti[3, 4]. Rapid and unorganized urban growth, which is related to a country’s development and rural flight, contributes to mosquito proliferation and, consequently to the epidemic of this urban disease. A serious characteristic is thatAedes aegyptican also transmit the zika and chikungunya virus. The triple epidemic dengue-zika-chikungunya coexists in many endemic areas [5]. Despite all efforts, developing
new tools and improving the existing strategies is very important, necessary and still far from ideal.
Therefore, it is relevant to create models to simulate the phenomenology of epidemic diseases and to understand the respective dynamics. This kind of in silico research, performed entirely on computer, is supposed to be very advantageous. As mathematical modelling and numeri-cal simulation involve no laboratorial experiments, they imply economy of time and resources, and can even sub-stitute pilot experiments [6]. Furthermore, as they involve no live models, there are no bioethical restraints, so their association with in vivo and in vitro experiments can reduce the number of animals that would undergo stress-ful and harmstress-ful situations [6].
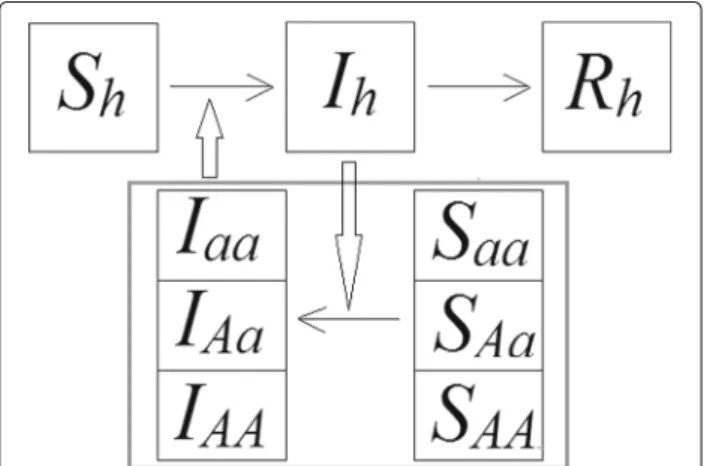
The susceptible-infected-recovered (SIR) model was firstly proposed by Kermack and McKendrick [7], and since then many studies based on their idea have been developed. This model enables scientists to simulate the dynamics of a population under an epidemic of an infec-tious disease over time. Three classes of individuals are considered (Fig. 1): susceptible, those who are at risk of contracting the disease; infected, those people who have the pathogen in their organism and are able to transmit it; and recovered, those who have been cured and are immune to the illness [7]. The original SIR model focuses only on host-to-host transmission [7]. However, there is a useful class of SIR models to study vector-borne diseases [8]. For instance, Bailey [9] described the susceptible-infected-recovered/susceptible-infected (SIRSI) model, in which the host population is divided into susceptible, infected and recovered, and the vector population into susceptible and infected.
Another important field of research related to vector-borne diseases is population genetics, specifically stud-ies regarding the selection of insecticide-resistant vector strains [10]. Population genetics is the branch of biology that investigates frequencies of alleles and genotypes in populations [11]. Resistant strains of vectors are those that resist and survive the effects of insecticides, and usually have their origin in genetic causes [12]. Positive selec-tion of particular phenotypes, such as insecticide resis-tance, occur because they confer a long-term survival or reproduction rate (i.e., a greater fitness to the environ-ment), and therefore individuals that express them have
Fig. 1Classical SIR model scheme. The susceptible population becomes infected, which, in turn, becomes recovered.S= susceptible; I= infected;R= recovered
more chance of transmitting their genes to the next gen-eration. Subsequently, the frequency of the allele which determines resistance increases over time, and so does the proportion of individuals that portray this gene [13]. This situation is an example of the natural selection, pro-posed by Darwin [14]. The importance of understanding the genetics of vector insecticide resistance is emphasized in the Global Plan for Insecticide Resistance Manage-ment from the World Health Organization, in which the relevance of theoretical modelling is also highlighted [12]. In population genetics, another important concept is the Hardy-Weinberg equilibrium. Its conditions are the absence of evolutionary factors, including the natural selection. To make it possible, all the allelomorphs and genotypes must confer the same fitness, so that the allele frequencies remain constant over time [15]. In addition, the pattern of inheritance must be Mendelian; the propor-tion of males and females must be equal; and the popula-tion must be panmictic and large [16]. Considering only two alleles, the Hardy-Weinberg equilibrium is achieved when the proportions of the genotypes remain constant and are represented by the following equation [1]:
p2+2pq+q2=1 (1)
Wherepandqare the frequencies of the dominant and the recessive allele, respectively, andp+q=1.p2, 2pqand
q2are the proportions of pure dominants, heterozygotes and pure recessives, and also sum 1.
Considering all this information, it is important to high-light that studying the alleles which confer resistance to the vectors might influence various aspects of control strategies, such as the usage of insecticides [17]. For exam-ple, in Zambia, this kind of research determined that pyrethroids should not be used anymore in insecticide rotation strategies forAnophelessp. control [18]. Another example is the work of Luz et al. [19], in which mathe-matical simulations were used to determine the efficiency of insecticide control againstA. aegyptiand to study the evolution of insecticide resistance. In the model of Luz et al. [19], it is considered that the insecticide resistance is linked to one locus with two alleles, so thatA. aegypti
for control of vector-borne diseases. However, few stud-ies have investigated mathematical models that couple SIR models and population genetics.
In this study, we propose a mathematical model of ordinary differential equations that represents a vector-borne disease epidemic and connects the main ideas of SIR mathematical models and population genetics. Our model is based on arboviral diseases, specially chikun-gunya, dengue and yellow fever. Using this approach, we considered the possibility of splitting the vector popula-tion according to the genotype into three groups, each of them with different characteristics, represented by dis-tinct values of biological parameters. In our case, we consider different mortality values. Therefore, it is possi-ble to simulate the variation of the genetic composition of vector population over time. There are two primary aims of this study: 1. To investigate whether the dom-inance of an insecticide resistance gene influences the epidemics dynamics 2. To create a model that inte-grates epidemiology and population genetics, from which more sophisticated models and new approaches can be developed.
Methods
We took into account infectious diseases that affect humans and are transmitted by an insect vector, specially arboviral diseases, such as yellow fever and chikungunya.
General assumptions
First of all, in order to better understand our model, the assumptions we made for its development should be mentioned:
• Assumption 1: The breeding in the populations is
random, i.e., all the individuals have the same chance of reproduction and they mate with any other individual in the population with the same probability;
• Assumption 2: The disease is transmitted only
horizontally. Vertical transmission occurs in real situations, but we disregarded it in order to present a clearer model;
• Assumption 3: There are no evolutionary factors
except for the biological selection (we disregard genetic drift and mutation, for instance), because of the same reason presented in the previous
assumption;
• Assumption 4: The lifetime span of the vectors is not
long enough for the recovery of an infected insect;
• Assumption 5: There are no immigrants or
emigrants in the populations considered, since considering human mobility would imply additional features, such as separation of population into patches [21], which is not the focus of this investigation.
Development of the model
Human populations
In our model, we considered both the populations of humans and vectors. The humans were divided into sus-ceptible, infected and recovered (Fig. 2). New human individuals are introduced into the susceptible population according to expressionc·Nh, in whichcis the birth rate andNhis the total human population. Susceptible humans are infected when they are bitten by an infected vec-tor, which happens at a probabilityβh. Infected humans recover at a rateγ, and the human mortality rate isμh, which does not vary with the compartment considered.
Population genetics
We take into account a pair of alleles in the vector population. These alleles determine the presence or not of insecticide resistance, and, consequently, the value of the animal’s mortality rate. They hold an interaction of complete dominance. We represented the recessive allelo-morph byaand the dominant one byA. We calculated the frequency of each allele by [22]:
f(a)=q= 2Naa+NAa
2NT
(2)
f(A)=p= 2NAA +NAa
2NT
(3)
whereNaa,NAa,NAAandNTare the populations of reces-sive homozygotes, heterozygotes, dominant homozygotes, and the total population, respectively.
Considering the frequencies of the alleles, the probabil-ity of there being a gamete portraying allele Ais pand allele aisq. Therefore, the probability of the formation
Fig. 2Scheme of the SIRSI model considering genetics aspects of the vector.AA,Aaandaamean dominant homozygotes, heterozygotes and recessive homozygotes, respectively, for the Susceptible (S) and Infected (I) mosquito populations.Sh,IhandRhare the susceptible,
of each genotype during fertilization is given in Table 1 below.
Consequently, the proportion of the genotypesaa,Aa
andAAin the next generation in timet+1 can be calcu-lated byp2, 2pqandq2, in this order. Considering thatθ
is the vector birth rate and that the total population in the next generation is equal toNT ·θ, we have the following equations:
Nt+1
aa =q2θNTt +Naat (4)
Nt+1
Aa =2pqθNTt +NAat (5)
Nt+1
AA =p2θNTt +NAAt (6) WhereNTt = Naat +NAat +NAAt in timetandNT0 = Naa0 +NAa0 +NAA0 . As we consider that there are no verti-cal transmission, all new individuals are introduced in the susceptible compartment therefore:
St+1
aa =q2θNTt (7)
StAa+1=2pqθNTt (8)
StAA+1=p2θNTt (9)
Vector populations
As we considered a pair of alleles for the vector population, we could separate the vector population into recessive homozygotes, heterozygotes and dominant homozygotes. Each of these compartments were subdi-vided into susceptible and infected (Fig. 2). New indi-viduals are introduced into the populations through the susceptible compartment, according to what is described in the previous item. Susceptible insects become infected when they bite infected humans, with a probability βv. This way, βv represents the proportion of vectors that effectively gets infected. This parameter is particularly useful because field studies demonstrate that only a small percentage of vectors gets infected with the pathogen [23]. The mortality rate has two components: the natural mortality rate (μN), whose value is equal for all vector groups considered here; and the insecticide-induced mor-tality rate (μI), whose value was smaller for the resistant strain and greater for the wild type. Eq. 10 shows the com-ponents of the total mortality rate. We considered μaa,
μAa and μAA as the total mortality rates for recessive homozygotes, heterozygotes and dominant homozygotes,
respectively. As alleleAis dominant overaand we con-sider a complete dominance interaction,μAaandμAAwill always have the same value.
μT =μN+μI (10) This way, according to our system, the increase in susceptible vector populations is dependent of allele fre-quencies and total vector population, and limited by a carrying capacity (K). The decrease of susceptible vector population is proportional to its own size and the per-centage of vectors that become infected. On the other hand, the increase in infected vector populations is depen-dent on the proportion of infected humansIh
Nh
and on the number of susceptible vectors with the correspon-dent genotype (Sv). In contrast, the decrease of infected vector populations is proportional only to its own size, independently of other populations.
The system of ordinary differential equations
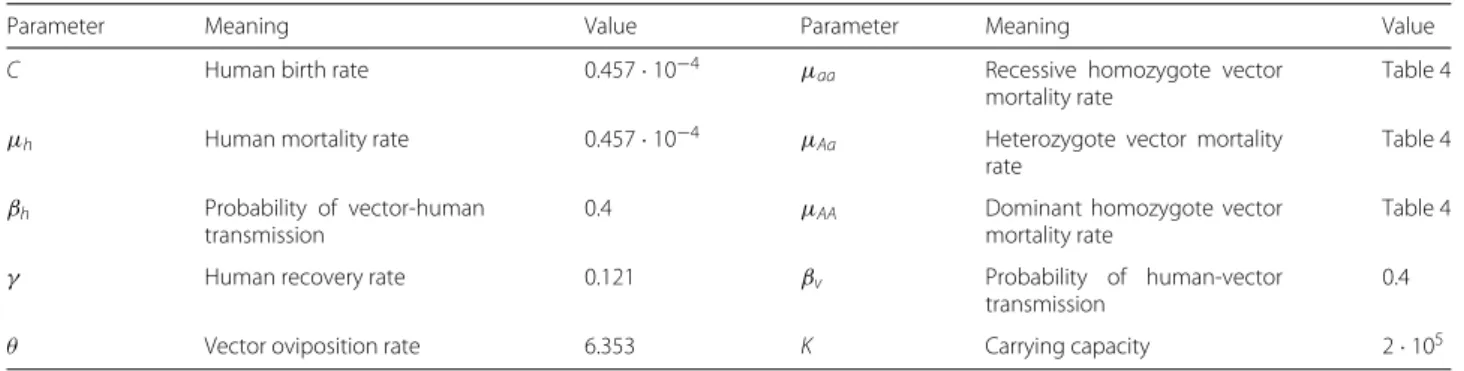
Our model was based on the one proposed by Santos [21]. The variables and parameters are summarized in Tables 2, 3 and 4. Our mathematical model can be represented by the following system of ordinary differential equations:
⎧ ⎪ ⎪ ⎪ ⎪ ⎪ ⎪ ⎪ ⎪ ⎪ ⎪ ⎪ ⎪ ⎪ ⎪ ⎪ ⎪ ⎪ ⎪ ⎨ ⎪ ⎪ ⎪ ⎪ ⎪ ⎪ ⎪ ⎪ ⎪ ⎪ ⎪ ⎪ ⎪ ⎪ ⎪ ⎪ ⎪ ⎪ ⎩ Sh
dt =cNh− β
hIv Nh +μh
Sh Ih
dt = βhIv
NhSh−(γ+μh)Ih Rh
dt =γIh−μhRh Saa
dt =q2θNv
1− NKv
−
βvIh
Nh +μaa
Saa Iaa
dt = βvIh
Nh Saa−μaaIaa SAa
dt =2pqθNv
1− Nv
K
−
βvIh
Nh +μAa
SAa IAa
dt = βvIh
NhSAa−μAaIAa SAA
dt =p2θNv
1− Nv K
−
β
vIh Nh +μAA
SAA IAA
dt = βvIh
NhSAA−μAAIAA
(11)
Computational simulations
The simulations were made using the software MatLab®. We ran the discrete form of system 11, which was obtained through the Euler method (Additional file 1). The time, which was measured in days, varied from 0 to 100, and
twas equal to 0.1. The parameter values were obtained from Santos [21] and are shown in Tables 2 and 4. The initial values of the variables are shown in Table 3. We assume the initial vector population is the double of the
Table 1Probability of formation of genotypes in the next generation
Probability of a gamete portrayingA=p Probability of a gamete portrayinga=q
Probability of a gamete portraying A=p
Probability of the formation of genotype AA=p·p
Probability of the formation of genotype Aa=p·q
Probability of a gamete portraying a=q
Probability of the formation of genotype Aa=p·q
Table 2Biological parameter values and meanings
Parameter Meaning Value Parameter Meaning Value
C Human birth rate 0.457·10−4 μ
aa Recessive homozygote vector
mortality rate
Table 4
μh Human mortality rate 0.457·10−4 μ
Aa Heterozygote vector mortality
rate
Table 4
βh Probability of vector-human
transmission
0.4 μAA Dominant homozygote vector
mortality rate
Table 4
γ Human recovery rate 0.121 βv Probability of human-vector
transmission
0.4
θ Vector oviposition rate 6.353 K Carrying capacity 2·105
Values obtained in Santos [21]
human population, according to the work of Menach et al. [24]. The algorithm of the simulation can be found in Additional file 2.
According to these values, the initial values ofpandq
would be 0.375 and 0.625, respectively.
A total of three main simulations were made, each one with different insecticide resistance situations. In the first one, we considered that both alleles (aandA) conferred a mortality rate of 0.25day−1. In this case, we intended to simulate the Hardy-Weinberg equilibrium conditions, in which all the individuals of a population have the same chance of surviving and reproducing, regardless of its genotype. This situation would also represent the absence of an insecticide-resistant strain, i.e., a popu-lation totally susceptible to insecticides. In the other two simulations, we aimed to simulate the presence of an insecticide-resistant strain and the natural selection,
which is characterized by differential reproduction and survival of organism. For this reason, in the second sim-ulation, the recessive allele attributed a smaller mortality value, while the dominant allelomorph conferred a higher rate. Finally, the last simulation was similar, but then the dominant allele conferred a greater fitness. The values of the mortality rates can be seen in Table 4.
We also did four other minor simulations. One of them was similar to simulation 1, but the time ranged from
t=0 tot=500. The other three simulations were analo-gous to the three main simulations, except by the fact that the initial values of variables were ten times smaller than the values shown in Table 3, andt =0.01. These simu-lations with smaller popusimu-lations are referred as 1s, 2s and 3s. 1s, 2s and 3s have, respectively, no insecticide-resistant gene, recessive insecticide resistance gene and dominant insecticide resistance gene.
Table 3Variable values and meanings
Variable Meaning Initial value Variable Meaning Initial value
Sh Human susceptible
popu-lation
9·103 S
aa Recessive homozygote vector
sus-ceptible population
4.75·103
Ih Human infected
popula-tion
2·102 I
aa Recessive homozygote vector
infected population
4.75·103
Rh Human recovered
popula-tion
3·102 N
aa Recessive homozygote vector total
population
9.5·103
Nh Human total population 9.5·103 SAA Dominant homozygote vector
sus-ceptible population
2.375·103
SAa Heterozygote vector
sus-ceptible population
2.375·103 I
AA Dominant homozygote vector
infected population
2.375·103
IAa Heterozygote vector
infected population
2.375·103 NAA Dominant homozygote vector total
population
4.75·103
NAa Heterozygote vector total
population
4.75·103 N
v Vector total population 1.9·104
Iv Infected vector population 3·104 f
aa Frequency of recessive
homozy-gotes
Naa
Nv
fAa Frequency of
heterozygotes
NAa
Nv fAA Frequency of dominant
homozy-gotes
NAA
Nv
q Frequency of recessive
allele
Table 4Values of mortality rates for the three simulations
Allele Genotypes in which the
allele expresses
Mortality rate (day−1)
Simulation 1 Simulation 2 Simulation 3
Recessive (a) aa 0.25 0.01 0.25
Dominant (A) Aa,AA 0.25 0.25 0.01
In the outputs of all simulations, genotypesAAandAa
were represented together asA_, since they express the same phenotype.
Results Simulation 1
Figures 3 and 4 show the graphs obtained from simulation 1, in which we aim to represent the Hardy-Weinberg equi-librium conditions, and a population without resistant strains. In Fig. 3a, the human populations are represented. The number of susceptible humans decreases until it reaches the value zero, while the population of recovered
humans increases almost linearly. On the other hand, the population of infected humans raised to a peak at time 28 and then diminished. In relation to the vectors (Fig. 3b, c and d), their populations exhibited both periods of growth and decline. The proportion of A_ vectors were always greater than the proportion of recessive homozygotes, except in the initial time, when their values were the same. The frequencies of the dominant (p = 0.375) and the recessive allele (q=0.625) remained constant during the whole time considered, as expected for the absence of evo-lution factors. According to Fig. 4b, the genotype frequen-cies varied very fast at the beginning of the simulation, and
Fig. 3Results of simulation 1.aSusceptible (blue), infected (green) and recovered humans (red).bInfectedaa(blue) andA_ (green) vectors. cSusceptibleaa(blue) andA_ (green) vectors.dSusceptible (blue), infected (green) and total (red) populations of vectors disregarding the genetic separation.c=0.457·10−4,μ
h=0.457·10−4,β
h=0.4,γ=0.121,θ=6.353,βv=0.4,K=2·105,μ
aa=μAa=μAA=0.25,Sh=9·103, Ih=2·102,R
h=3·102,N
h=9.5·103,S
Aa=2.375·103,I
Aa=2.375·103,N
Aa=4.75·103,S
aa=4.75·103,I
aa=4.75·103,N
aa=9.5·103, SAA=2.375·103,I
AA=2.375·103,N
AA=4.75·103,I
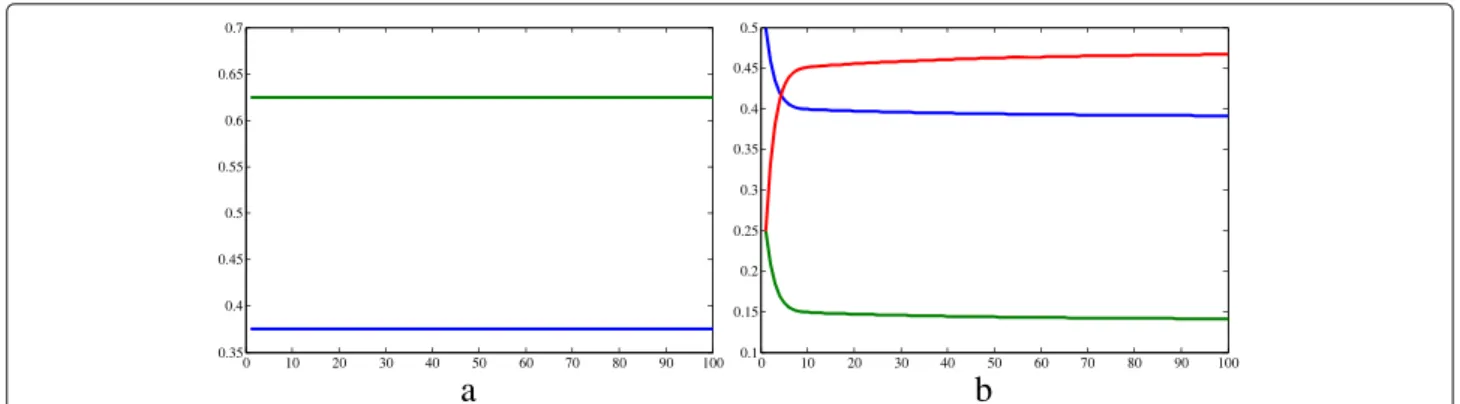
Fig. 4Results of simulation 1 (continued).aAllele frequencies ofa(green) andA(blue).bGenotype frequencies ofaa(blue),Aa(red) andAA(green). c=0.457·10−4,μ
h=0.457·10−4,β
h=0.4,γ=0.121,θ=6.353,βv=0.4,K=2·105,μ
aa=μAa=μAA=0.25,Sh=9·103,I
h=2·102, Rh=3·102,N
h=9.5·103,S
Aa=2.375·103,I
Aa=2.375·103,N
Aa=4.75·103,S
aa=4.75·103,I
aa=4.75·103,N
aa=9.5·103,S
AA=2.375·103, IAA=2.375·103,N
AA=4.75·103,I
v=3·104,N
v=1.9·104.X axisrepresents time (days) andY axisrepresents freqquency.Image produced with MatLab®
then they started to increase or decrease very slowly. The Hardy-Weinberg equilibrium would be achieved when:
f(aa)=q2=0.390625 f(Aa)=2·p·q=0.468750
f(AA)=p2=0.140625
According to another simulation with the same condi-tions, but in a longer time frame, the Hardy-Weinberg equilibrium is achieved at t = 488. Note that f(aa)+ f(Aa)+f(AA)=1.
Simulation 2
The results of simulation 2, in which the recessive allele conferred a greater fitness, are shown in Figs. 5 and 6. The recessive homozygotes represent the resistant strain, which is positively selected.
Regarding the humans (Fig. 5a), the susceptible popu-lation decreased during the whole time considered, until the zero value. The infected population increased until time 27 of the simulation and then reduced up to the end of simulation. Finally, the recovered population had an approximately linear growth. This human dynamics is approximately similar to simulation 1, although the val-ues vary lightly. On the other hand, the vector population showed different dynamics (Fig. 5b and c). The dynam-ics of the susceptible vectors (Fig. 5c) can be split into two moments. In the first one, the populations increased quickly and the proportion ofA_ individuals was greater than that of aa individuals. At a second moment, the number ofA_ andaasusceptible vectors decreased and the proportion of pure recessives overcame the propor-tion of the other genotypes. The number of pure recessive infected vectors all increased over the time, while the quantity of infected individuals that carry the dominant allele had periods of growth and decline.
The recessive allele tended to fixation while the fre-quency of the dominant one decreased over time (Fig. 6a). According to another simulation with the same condi-tions, but a bigger time, fixation occurs whent = 722. Despite the beginning of the simulation, the frequency of the genotypeaaincreased, while the frequency of the others decreased.
Simulation 3
The graphs in Figs. 7 and 8 show the results of the third simulation, in which the dominant allele conferred insecticide resistance (i.e., a smaller mortality value), therefore the resistant strain consists ofAAandAa indi-viduals. Regarding the human population (Fig. 7a), the number of susceptible individuals decrease until reach-ing the value zero, while the quantity of recovered grew during the whole time considered. On the other hand, the infected population increased to a maximal at day 27 and then started to go down. Concerning the vec-tors, the dominant homozygotes and heterozygotes were more numerous than the recessive homozygotes through-out the whole simulation (Fig. 7b and c), except for the initial time. As for the infected compartment (Fig. 7b), the A_ compartment increased, while the group of pure recessives barely varied over the whole time considered. The susceptible vectors (Fig. 7) had an initial period of growth followed by a period of decrease, and the
A_ susceptible vectors were more numerous than the
aa ones. The population of susceptible vectors grew until day 11, when it started to decrease (Fig. 7d), and then was eventually overcome by the infected population.
Fig. 5Results of simulation 2.aSusceptible (blue), infected (green) and recovered humans (red).bInfectedaa(blue) andA_ (green) vectors.c Susceptibleaa(blue) andA_ (green) vectors.dSusceptible (blue), infected (green) and total (red) populations of vectors disregarding the genetic separation.c=0.457·10−4,μ
h=0.457·10−4,β
h=0.4,γ=0.121,θ=6.353,βv=0.4,K=2·105,μ
aa=0.01,μAa=μAA=0.25,Sh=9·103, Ih=2·102,Rh=3·102,Nh=9.5·103,SAa=2.375·103,IAa=2.375·103,NAa=4.75·103,Saa=4.75·103,Iaa=4.75·103,Naa=9.5·103, SAA=2.375·103,IAA=2.375·103,NAA=4.75·103,Iv=3·104,Nv=1.9·104.X axisrepresents time (days) andY axisrepresents number of individuals.Image produced with MatLab®
simulation over time varying from 0 to 100000, but even in these conditions the fixation was not yet reached. Figure 8b shows that the frequencies of heterozygotes and pure dominants, which had a bigger fitness, increased; while the frequency of pure recessive, that had a smaller fitness, decreased.
Simulations with bigger time interval and smaller population
Figure 9 shows the results for the simulation in interval 0<t<500. Unlike the preceding simulations, it enables us to see that the infected human population almost reaches the value zero, when all the human compartments
Fig. 6Results of simulation 2 (continued).aAllele frequencies ofa(green) andA(blue).bGenotype frequencies ofaa(blue),Aa(red) andAA(green). c=0.457·10−4,μ
h=0.457·10−4,β
h=0.4,γ=0.121,θ=6.353,βv=0.4,K=2·105,μ
aa=0.01,μAa=μAA=0.25,Sh=9·103,I
h=2·102, Rh=3·102,N
h=9.5·103,S
Aa=2.375·103,I
Aa=2.375·103,N
Aa=4.75·103,S
aa=4.75·103,I
aa=4.75·103,N
aa=9.5·103,S
AA=2.375·103, IAA=2.375·103,N
AA=4.75·103,I
v=3·104,N
Fig. 7Results of simulation 3.aSusceptible (blue), infected (green) and recovered humans (red).bInfectedaa(blue) andA_ (green) vectors. cSusceptibleaa(blue) andA_ (green) vectors.dSusceptible (blue), infected (green) and total (red) populations of vectors disregarding the genetic separation.c=0.457·10−4,μ
h=0.457·10−4,β
h=0.4,γ=0.121,γ=6.353,βv=0.4,K=2·105,μ
aa=0.25,μAa=μAA=0.01,Sh=9·103, Ih=2·102,R
h=3·102,N
h=9.5·103,S
Aa=2.375·103,I
Aa=2.375·103,N
Aa=4.75·103,S
aa=4.75·103,I
aa=4.75·103,N
aa=9.5·103, SAA=2.375·103,I
AA=2.375·103,N
AA=4.75·103,I
v=3·104,N
v=1.9·104.X axisrepresents time (days) andY axisrepresents number of individuals. Image produced with MatLab®
practically arrive at a stable value (i.e., reaching the equilibrium).
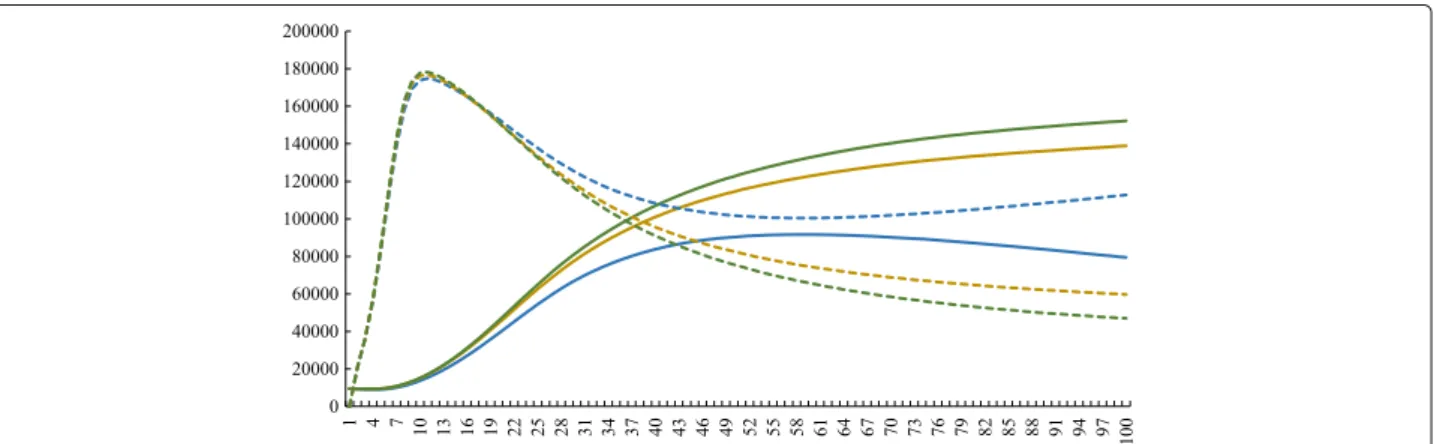
On the other hand, Fig. 10 shows the dynamics of humans populations of 1s, 2s, and 3s. The results show a slight difference between them. In the presence of an allele
that confers resistance, the number of infected people is bigger and the number of susceptible, smaller. Conversely, when there are no resistant strains, the number of infected humans is smaller and the susceptible compartment is bigger.
Fig. 8Results of simulation 3 (continued).aAllele frequencies ofa(green) andA(blue).bGenotype frequencies ofaa(blue),Aa(red) andAA(green). c=0.457·10−4,μ
h=0.457·10−4,β
h=0.4,γ=0.121,θ=6.353,βv=0.4,K=2·105,μ
aa=0.25,μAa=μAA=0.01,Sh=9·103,I
h=2·102, Rh=3·102,N
h=9.5·103,S
Aa=2.375·103,I
Aa=2.375·103,N
Aa=4.75·103,S
aa=4.75·103,I
aa=4.75·103,N
aa=9.5·103,S
AA=2.375·103, IAA=2.375·103,N
AA=4.75·103,I
v=3·104,N
Fig. 9Simulation with the same conditions to first simulation, with time varying from 0 to 500. Legend: Susceptible (blue), infected (green) and recovered humans (red).c=0.457·10−4,
μh=0.457·10−4,βh=0.4,γ=0.121,θ=6.353,βv=0.4,
K=2·105,μaa=μAa=μAA=0.25,Sh=9·103,Ih=2·102,
Rh=3·102,Nh=9.5·103,SAa=2.375·103,IAa=2.375·103,
NAa=4.75·103,Saa=4.75·103,Iaa=4.75·103,Naa=9.5·103,
SAA=2.375·103,IAA=2.375·103,NAA=4.75·103,Iv=3·104,
Nv=1.9·104.X axisrepresents time (days) andY axisrepresents
number of individuals. Image produced with MatLab®
Discussion
In this study, we propose a SIR model that considers the population genetics of vector insecticide resistance. We did three computational simulations: in one of them, all vectors of the population had the same insectide-induced mortality, so that there was no selection and no resistant strain. In the second, the recessive homozygotes vec-tors were resistant to an insecticide, and therefore they had a smaller mortality rate and a bigger fitness. In the third, those who carried the dominant allele had insecti-cide resistance. Therefore, they had more probability of
passing their genes to the next generation. Our model is based on the biology of several vector-borne diseases such as dengue fever, yellow fever and chikungunya. All of them are caused by viruses of the genusFlavivirusand are transmitted by Aedes spp., especiallyAedes aegypti
[25–27].
These tropical neglected diseases are extremely impor-tant nowadays: in Brazil, until the 21st epidemiological week of 2016, almost 1.3 million people came down with dengue and 122762 probable cases of chikungunya were registered [28]; in one year, 60000 people died because of yellow fever in Sub-Saharian Africa [29]. However, the present model must be interpreted with caution because it disregards important factors, such as seasonal varia-tion of temperature [19], different life stages of the vector [19, 20], spatial distribution of populations [21] and the existence of various strains of a pathogen [30]. Therefore, it is important to bear in mind that the computational simulations may fail in accurately representing all aspects of a real epidemics. Notwithstanding these restrictions, our model is important for understanding the influence of insecticide resistance genetics on dynamics of an epi-demics, without influence of other factors. In addition, it may serve as a basis for the development of more complex and realistic approaches.
In our model, we considered a pair of allelomorphs with complete dominance interaction and Mendelian inheritance, which affected the mortality rate of the vector. Using this approach, we intended to simulate a genetic-induced insecticide resistance. Several similar real cases are described in the literature. According to Saavedra-Rodriguez et al. [31], an isoleucine replace-ment in codon 1016 of voltage-gated sodium channel
transmembrane protein gene of Aedes aegypti is linked to knockdown resistance to pyrethroids, which is a very common type of insecticide. The allele that contains this mutation is recessive and increased in frequency when under insecticide selection [31]. Another interest-ing example is found in the study by Bonin et al. [32], who researched some alleles inAedes aegyptirelated to resis-tance to the bioinsecticide Bacillus thuringiensis israe-lensis. These allelomorphs have dominant characteristics. However, the genes considered in that study [32] are poli-genes,i.e., they determine a quantitative character, which is different from our mathematical model, which con-siders that insecticide resistance is qualitative. There are many different mutations of this kind in several mosquito populations around the world [33].
Analyzing Figs. 3d, 5d and 7d, it is clear that the total vector population is smaller in the first simulation than in the others. This can be easily explained by the fact that more individuals are removed there, since the mean mor-tality rate is bigger because all vectors have a mormor-tality value of 0.25day−1
. In contrast, in the other two simu-lations, there is a portion of the population withμT =
0.01day−1
, and therefore the mean mortality is smaller and the total number of vectors is bigger.
Another interesting observation to make about Figs. 3d, 5d and 7d is that when there is an insecticide-resistant strain, the proportion of vectors infected with the pathogen is bigger. In addition, this proportion is even bigger when the resistance is caused by a dominant allele instead of a recessive one. This can be easily seen in Fig. 11. One possible explanation for this phenomenon is that when there is a resistant strain, the mean mortality rate is smaller, as stated above in this section. Therefore, less susceptible vectors die, and this compartment become more numerous.
According to the expression βvIh
Nh · Sv of system 11,
the bigger the number of susceptible vectors, the more
they become infected and the bigger the compartment of infected vectors. The larger proportion of infected vectors in the presence of resistance was also observed in laboratory experiments in vivo. For instance, Labout et al. [34] studied three strains ofAnopheles gambiae, the malaria vector: all of them had the same genetic back-ground, despite the fact that one group was susceptible to insecticides, another had a mutation that conferred resistance to organophosphates and carbamates; and the third had a knockdown mutation that determined resis-tance to pyrethroids and DDT. The mosquitoes were fed on blood withPlasmodium falciparum; the protozoan that causes malaria, and then the prevalence ofP. falciparum
infection in the vectors strains was measured. They found that the prevalence was higher in insecticide resistant strains than in the susceptible one. Alout et al. [34] explain this phenomenon through a molecular mechanism, while our present paper justify it through population dynamics. Probably, during an epidemic, both mechanisms influence the proportion of infected vectors.
When the outputs of the three simulations are com-pared, a slight difference between the human population dynamics can be observed. This difference is more visible when there are less individuals (Fig. 10). It can be noted that the number of infected people is greater in pres-ence of resistant vectors, and smaller in their abspres-ence. The inverse is valid for susceptible humans. This might hap-pen because of the larger proportion of infected vectors in simulations 2s and 3s and smaller in simulation 1s, in conformity to the statements of the previous paragraph. The more vectors are infected, the faster humans become infected. The bigger is the compartment of infected peo-ple, the smaller is the compartment of susceptible people. Although we diminished the populations in the sim-ulation in Fig. 10 and it had interesting results, in real situations the natural selection becomes less relevant in small populations, in which the genetic drift is the most
actable evolution factor [15]. For this reason, we con-sidered greater variable values in the other simulations, even though the effect in humans was more subtle. One can argue that the differences between the simulations of Fig. 10 are a bias due to the small size of populations. As a matter of fact, in vivo and in vitro approaches that involve small samples usually face this issue. However, our in silico study used only non-stochastic mathemati-cal tools, so that the results are always exact or depends only on the variables and parameters considered. In order to confirm this, the computational simulations were per-formed several times, and all of them presented the same results. Therefore, the differences in human populations did not occur because of the small population size, but because of the genetics of the vector insecticide resistance. Taken together, the results of simulations 1, 2, 3, 1s, 2s and 3s suggest that the genetics of insecticide resis-tance have stronger effect on the vector population than in the human population. This result may be explained by the fact that the insecticide resistance gene have direct effect on the vectors populations, but only indirectly influ-ences the human populations. As a matter of fact, the insecticide resistance have direct effect on vector mor-tality rate, which influences the size of susceptible and infected vector populations. In turn, changes in vector infected population causes changes in human susceptible and infected populations, that are also restrained by βh
andNh. Indeed, in simulations 2, 3, 2s and 3s, the differ-ences in genotype frequencies among the simulations can be noticed in the first days of simulation (Figs. 6b, 8b), the differences in size of vector infected populations can be seen from day 20 on (Fig. 11), while the differences in size of human infected populations only can be noticed from day 80 on (Fig. 10b). Overall, this information show that the genetics of the vectors affects the epidemiological dynamics of a vector-borne disease as to several important aspects. Therefore, the present model could be an impor-tant start point for investigating population dynamics in epidemics.
Another relevant observation is that, in all simulations of our model, the populations of susceptible humans always decreased and reached zero, and never went up. This happens because of the combination of two factors: (1) the value of the human birth rate is equal to the value of the human mortality rate, and (2) the immunity of
the recovered was lifelong, so they would never become susceptible again. This situation could be reversed by con-sidering different values ofcandμh, but it was decided to use the same values for both parameters in order to main-tain constant the size of total human population during all the time of simulation. It was decided to consider life-long immunity because this characteristic is observed for important vector-borne diseases such as chikungunya [35] and for each dengue serotype [36].
It is interesting to note that the curve obtained for infected humans in all three computational simulations has a very similar shape to many line graphs made with real epidemiological data. For example, we can cite the Brazilian dengue epidemics in the years of 2013, 2014, and 2015, whose line graphs for the number of infected people over time can be found in the epidemiological bulletins of the Brazilian Secretary of Health Vigilance [28]. In all of them, during the rainy season, the number of infected people increases until it reaches a peak, and then it starts to decrease, similar to the outputs obtained here. The same trend is observed in the number of yellow fever suspect cases in Angola, from December, 2015 to March, 2016 [2].
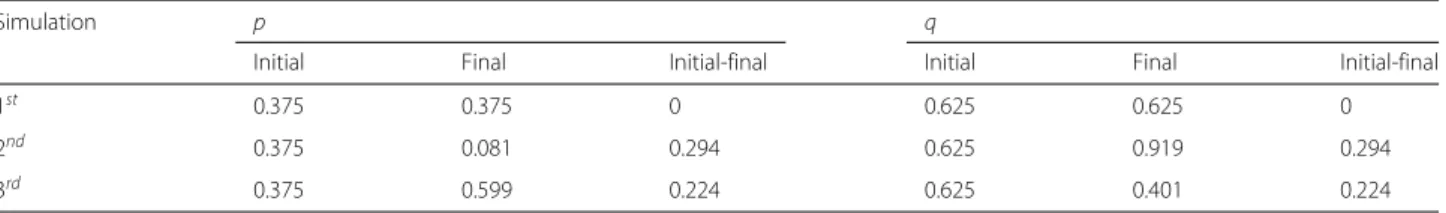
Regarding the allele frequencies, in all simulations, the initial pandqwere 0.375 and 0.625, respectively. How-ever, these variables changed very differentially according to the simulation. As stated in the results of simulation 1, in the first simulation, the frequencies did not change because of the lack of evolutionary factors. Comparing simulations 2 and 3, we can infer that the resistance allele fixes faster when this allele is recessive than when it is dominant: the time it takes to reach the frequency 100% is longer whenA confers resistance; and the vari-ation of frequency between 0 < t < 100 is smaller in the third simulation (Table 5). According to Freeman and Herron [15], this happens because, when a domi-nant allele is positively selected, the recessive allele that confer a smaller fitness is maintained through the het-erozygotes, that “hide” the recessive alleles, since they carry them but express the phenotype of bigger fitness. When the recessive allelomorph is positively selected, the situation is different: the heterozygotes have a smaller fitness despite the fact they carry the two forms of the gene, and therefore they tend to be eliminated from the population.
Table 5Initial and final allele frequencies in the simulation
Simulation p q
Initial Final Initial-final Initial Final Initial-final
1st 0.375 0.375 0 0.625 0.625 0
2nd 0.375 0.081 0.294 0.625 0.919 0.294
The frequencies of the genotypes in simulations 2 and 3, at the beginning of the time considered, have similar dynamics to the first simulation. After this initial period, they start to vary according to the selective pressure.
Conclusion
In conclusion, the model presented in this work exhib-ited results in conformation with the literature, and the numerical results show that the genetics of the vectors do influence human population dynamics. The compu-tational simulations have shown that the presence of an insecticide resistance gene is related to a bigger number of infected humans and vectors. The numerical investigation has also shown that this aspect depends on the inheritance pattern of the gene, since a dominant insecticide resis-tance gene implies in an even greater number of infected people and vectors.
This study does not consider factors such as differ-ent life stages of vectors and the possibility of diverse serotypes of a pathogen. Notwithstanding these restric-tions, our model could be a basis for the development of more sophisticated epidemiological models that consid-ers insecticide resistance genetics. These, in turn, could be used for monitoring diseases such as yellow fever and predicting trends of epidemics. This way, the present investigation open new perspectives for further studies. For example, our model could be a starting point to cal-culate the optimum control in which insecticides are used in a manner that minimizes the evolution of resistance in vector population.
Additional files
Additional file 1:The Discretized form of the model obtained through the Euler method that was used for the numerical simulations. (PDF 95 kb)
Additional file 2:Algorithim used for the numerical simulations of the mathematical models that indicates the steps necessary to obtain the results. (PDF 69 kb)
Abbreviations
K: Carrying capacity;A: Dominant allele;μAA: Dominant homozygote vector mortality rate;SAA: Dominant homozygote vector susceptible population;IAA: Dominant homozygote vector infected population;NAA: Dominant homozygote vector total population;p: Frequency of the dominant allele in the population;q: Frequency of the recessive allele in the population;Aa: Heterozygote;c: Human birth rate;μh: human mortality rate;γ: Human recovery rate;μAa: Heterozygote vector mortality rate;Sh: Human susceptible population;Ih: Human infected population;Rh: Human recovered population; Nh: Human total population;SAa: Heterozygote vector susceptible population; IAa: Heterozygote vector infected population;NAa: Heterozygote vector total population;Iv: Infected vector population;aa: Pure recessive;AA: Pure dominant;A_: Pure dominants and heterozygotes;βh: probability of vector-human transmission;βv: Probability of human-vector transmission;a: Recessive allele;μaa: Recessive homozygote vector mortality rate;Saa: Recessive homozygote vector susceptible population;Iaa: Recessive homozygote vector infected population;Naa: Recessive homozygote vector total population;SIR: Susceptible-Infected-Recovered;Nv: Vector total population;θ: Vector oviposition rate
Acknowledgements
We would like to thank Luiz Kiyoshi Nishida for the technical support and Jane Godwin Coury for the writing assistance.
Funding
The authors received financial support from Programa de Internacionalização de Pesquisa da UNESP da Pró-reitoria de Pesquisa e Pró-reitoria de Pós-Graduação (PROINTER-PROPe/PROPG) with process number 2016/1361.
Availability of data and materials
The programations used for the numerical simulations can be found on the website Zenodo, on the webpage http://doi.org/10.5281/zenodo.212519 (DOI: 10.5281/zenodo.212519). Other datasets that support the conclusions of this article are included within the manuscript and the Additional files 1 and 2.
Authors’ contributions
MLGK participated in the development of the mathematical model, execution and design of the numerical simulations, analysis of the results and preparation of the manuscript. FLPS participated in the design of the numerical simulations, analysis of the results and preparation of the manuscript. All authors read and approved the final manuscript.
Competing interests
The authors declare that they have no competing interests.
Consent for publication
Not applicable.
Ethics approval and consent to participate
Not applicable.
Publisher’s Note
Springer Nature remains neutral with regard to jurisdictional claims in published maps and institutional affiliations.
Received: 21 December 2016 Accepted: 13 June 2017
References
1. World health organization, (ed). A global brief on vector-borne diseases, 1st ed. Genevè: WHO Press; 2014. Available from: http://apps.who.int/iris/ handle/10665/111008.
2. World health organization, (ed). Vector Borne Diseases; 2016. Available from: http://www.who.int/mediacentre/factsheets/fs387/en/. Accessed 14 November 2016.
3. McBride WJH, Bielefeldt-Ohmann H. Dengue viral infections; pathogenesis and epidemiology. Microb Infect. 2000;2:1041–50. Available from: http:// www.sciencedirect.com/science/article/pii/S1286457900012582. 4. Halstead SB. Dengue. Lancet. 2007;370:1644–52. Available from: http://
www.thelancet.com/journals/lancet/article/PIIS0140-6736(07)61687-0/ abstract.
5. Gubler DJ, Clark GG. Dengue/dengue hemorrhagic fever: the emergence of a global health problem. Emerg Infect Dis. 1995;1:55–7. Available from: http://wwwnc.cdc.gov/eid/article/1/2/95-0204_article.
6. Vedani A, Smiesko M. In Silico Toxicology in Drug Discovery — Concepts Based on Three-dimensional Models. Altern Lab Anim. 2009;37:477–96. 7. Kermack WO, McKendrick AG. A contribution to the mathematical theory
of epidemics. Proc Math Phys Eng Sci. 1927;115:700–21. Available from: http://rspa.royalsocietypublishing.org/content/115/772/700. 8. Andraud M, Hens N, Marais C, Beutels P. Dynamic epidemiological
models for dengue transmission: a systematic review of structural approaches. Plos One. 2012;7:e49085. Available from: http://journals.plos. org/plosone/article?id=10.1371/journal.pone.0049085.
9. Bailey NTJ. The mathematical theory of infectious diseases and its applications, 2nd ed. London: Griffin; 1975.
10. Hemingway J, Field L, Vontas J. An Overview of Insecticide Resistance. Science. 2002;298:96–7. Available from: http://science.sciencemag.org/ content/298/5591/96.
12. World health organization, (ed). Global plan for insecticide resistance management in malaria vectors, 1st ed. Genevè: WHO Press; 2012. Available from: http://www.who.int/malaria/publications/atoz/gpirm/en/. 13. Liu N. Insecticide Resistance in Mosquitoes: Impact, Mechanisms, and
Research Directions. Ann R Entom. 2015;60:537–59. Available from http:// www.annualreviews.org/doi/abs/10.1146/annurev-ento-010814-020828. 14. Darwin CR. On the origin of species by means of natural selection, or the
preservation of favoured races in the struggle for life, 1st ed. London: Murray; 1859. Available from: http://darwin-online.org.uk/content/ frameset?itemID=F373&viewtype=text&pageseq=1.
15. Freeman S, Herron JC. Evolutionary analysis, 4th ed. London: Pearson; 2007.
16. Hardy GH. Mendelian proportions in a mixed population. Science. 1908;28: 49–50. Available from: http://science.sciencemag.org/content/28/706/49. 17. Gourbière S, Dorn P, Tripet F, Dumonteil E. Genetics and evolution of
triatomines: from phylogeny to vector control. Heredity. 2011;108: 190–202. Available from: http://www.nature.com/hdy/journal/v108/n3/ full/hdy201171a.html.
18. Chanda E, Thomsen EK, Musapa M, Kamuliwo M, Brogdon WG, Norris DE, et al. An operational framework for insecticide resistance management planning. Emerg Infect Dis. 2016;22:773–9. Available from: http://wwwnc. cdc.gov/eid/article/22/5/15-0984_article.
19. Luz PM, Codeco CT, MedLock J, Struchiner CJ, Valle D, Galvani AP. Impact of insecticide interventions on the abundance and resistance profile of Aedes aegypti. Epidemiol Infect. 2009;137:1203–15. Available from: https://www.ncbi.nlm.nih.gov/pubmed/19134235.
20. Schechtman H, Souza OM. Costly Inheritance and the Persistence of Insecticide Resistance in Aedes aegypti Populations. Plos ONE. 2015;7: 450. Available from: http://parasitesandvectors.biomedcentral.com/ articles/10.1186/1756-3305-7-450.
21. Santos FLP. Patches approach to investigate the population dynamics in dengue; 2017. p 30–14. Available from: http://dx.doi.org/10.5540/tema. 2017.018.01.0003.
22. Hastings A. Population Biology: concepts and models, 1st ed. New York: Springer; 1997.
23. Chouin-Carneiro T, Vega-Rua A, Vazeille M, Yebakima A, Girod R, Goindin D, et al. Differential Susceptibilities of Aedes aegypti and Aedes albopictus from the Americas to Zika Virus. Plos One. 2016. Available from: http:// journals.plos.org/plosntds/article?id=10.1371/journal.pntd.0004543. 24. Menach A, McKenzie FE, Flahault A, Smith DL. The unexpected
importance of mosquito oviposition behaviour for malaria:
non-productive larval habitats can be sources for malaria transmission. Malar J. 2005;4:23. Available from: http://malariajournal.biomedcentral. com/articles/10.1186/1475-2875-4-23.
25. Dias LBA, Almeida SCL, Haes TM, Mota LM, Roriz-Filho JS. Dengue: transmissão, aspectos clínicos, diagnóstico e tratamento. Medicina (Ribeirão Preto). 2010;43:143–52. Available from: http://revista.fmrp.usp. br/2010/vol43n2/Simp6_Dengue.pdf.
26. Nishino K, Yactayo S, Garcia E, Aramburu GJ, Manuel E, Costa A, et al. Yellow fever urban outbreak in Angola and the risk of extension: World Health Organization; 2016. Available from http://www.who.int/wer/2016/ wer9114.pdf?ua=1.
27. Pialoux G, Gaüzère BA, Jauréguiberry S, Strobel M. Chikungunya, an epidemic arbovirosis. Lancet Infect Dis. 2007;7:319–27. Available from: http://www.thelancet.com/journals/laninf/article/PIIS1473-3099(07)70107-X/fulltext.
28. Monitoramento dos casos de dengue, febre de chikungunya e febre pelo vírus Zika até a Semana Epidemioló. Brasília: Secretary of Health Vigilance; 2016. Available from http://portalsaude.saude.gov.br/images/pdf/2016/ junho/30/2016-021.pdf.
29. Chan M. Yellow fever: the resurgence of a forgotten disease; 2016. Available from: http://www.who.int/entity/mediacentre/commentaries/ yellow-fever/en. Accessed: 10 Jun 2016.
30. Garcia AG, Ferreira CP, Consoli FL, Godoy WAC. Predicting evolution of insect resistance to transgenic crops in within-field refuge configurations, based on larval movement. Ecological Complexity. 2016;28:94–103. Available from: http://www.sciencedirect.com/science/article/pii/ S1476945X16300563.
31. Saavedra-Rodriguez K, Urdaneta-Marquez L, Rajatileka S, Moulton M, Flores AE, Fernandez-Salas I, et al. A mutation in the voltage-gated sodium channel gene associated with pyrethroid resistance in Latin
AmericanAedes aegypti. Insect Mol Biol. 2007;16:785–98. Available from: http://onlinelibrary.wiley.com/doi/10.1111/j.1365-2583.2007.00774.x/full. 32. Bonin A, Paris M, Frérot H, Bianco E, Tetreau G, Després L. The genetic
architecture of a complex trait: Resistance to multiple toxins produced by Bacillus thuringiensis israelensisin the dengue and yellow fever vector, the mosquitoAedes aegypti. Infect Genet Evol. 2015;35:204–13. Available from: http://www.sciencedirect.com/science/article/pii/S1567134815003214. 33. Silva APB, Santos JMM, Martins AJ. Mutations in the voltage-gated
sodium channel gene of anophelines and their association with resistance to pyrethroids - a review. Parasit Vectors. 2014. Available from: http:// journals.plos.org/plosone/article?id=10.1371/journal.pone.0123961. 34. Alout H, Ndam NT, Sandeu MM, Djégbe I, Chandre F, Dabiré RK, et al.
Insecticide Resistance Alleles Affect Vector Competence ofAnopheles gambiae s.sforPlasmodium falciparumField Isolates. Plos One. 2013;8: e63849. Available from: http://journals.plos.org/plosone/article?id=10. 1371/journal.pone.0063849.
35. Nitatpattana N, Kanjanopas K, Yoksan S, Satimai W, Vongba N, Langdatsuwan S, et al. Long-term persistence of Chikungunya virus neutralizing antibodies in human populations of North Eastern Thailand. Virol J. 2014;11. Available from: https://virologyj.biomedcentral.com/ articles/10.1186/1743-422X-11-183.
36. Normmile D. New dengue virus throws a spanner in disease control efforts. Science. 2013;342:415. Available from: http://science.sciencemag. org/content/342/6157/415.
• We accept pre-submission inquiries
• Our selector tool helps you to find the most relevant journal • We provide round the clock customer support
• Convenient online submission • Thorough peer review
• Inclusion in PubMed and all major indexing services • Maximum visibility for your research
Submit your manuscript at www.biomedcentral.com/submit