Intake, apparent digestibility, production, and composition of milk from cows
fed diets with different sources of lipids
Rogério Mendes Murta1, Cristina Mattos Veloso2, Aureliano José Vieira Pires3, Fabiano Ferreira da Silva3, Gleidson Giordano Pinto de Carvalho4, Antônio Eustáquio Filho5, Camila
Maida de Albuquerque Maranhão6, Cláudia Horne da Cruz7
1 Instituto Federal do Norte de Minas Gerais, Pró-reitoria de Pesquisa e Inovação, Montes Claros, MG, Brasil. 2 Universidade Federal de Viçosa, Departamento de Zootecnia, Viçosa, MG, Brasil.
3 Universidade Estadual do Sudoeste da Bahia, Departamento de Tecnologia Rural e Animal, Itapetinga, BA, Brasil. 4 Universidade Federal da Bahia, Departamento de Zootecnia, Salvador, BA, Brasil.
5 Instituto Federal de Educação, Ciência e Tecnologia do Norte de Minas Gerais, Departamento de Zootecnia, Montes Claros, MG, Brasil. 6 Universidade Estadual de Montes Claros, Departamento de Zootecnia, Montes Claros, MG, Brasil.
7 Universidade Federal da Bahia, Programa de Pós-graduação em Zootecnia, Salvador, BA, Brasil.
ABSTRACT - The objective of this study was to evaluate the effect of different sources of lipids in the diets of dairy cows on the intake and digestibility of nutritional fractions, and milk production and composition. The experiment was conducted in a 42-hectare area divided into eight paddocks covered with Brachiaria brizantha. Twelve crossbred Holstein × Zebu cows were distributed into three simultaneous 4 × 4 Latin squares. The treatments consisted of different sources of lipids, as follows: diet with no extra source of lipids; diet with cottonseed as the source of lipids; diet with soy oil; and diet with used frying soy oil. The intakes of dry matter, neutral detergent fiber, crude protein, total carbohydrates, and non-fibrous carbohydrates were similar for all diets. The use of lipid sources caused a decrease in the apparent digestibility of dry matter, neutral detergent fiber, non-fibrous carbohydrates, and crude protein. The levels of protein, lactose, and defatted dry matter were reduced with the use of lipid sources but did not affect milk production. The use of cottonseed, soy oil, and used frying soy oil as sources of lipids in diets for lactating cows at pasture do not improve milk production, and their use is therefore optional.
Key Words: cottonseed, dairy cows, fat, performance, ruminant nutrition, soy
ISSN 1806-9290
www.sbz.org.br R. Bras. Zootec., 45(2):56-62, 2016
Received May 12, 2015 and accepted October 26, 2015. Corresponding author: [email protected] http://dx.doi.org/10.1590/S1806-92902016000200003
Copyright © 2016 Sociedade Brasileira de Zootecnia. This is an Open Access article distributed under the terms of the Creative Commons Attribution License (http://creativecommons.org/licenses/by/4.0/), which permits unrestricted use, distribution, and reproduction in any medium, provided the original work is properly cited.
Introduction
The search for low production costs in animal products has led to rational use of all feed resources available. Taking into consideration the high costs involved in dairy farming, the productive sector seeks lower-cost feed alternatives.
The use of supplementary lipid sources in diets is a common practice when feeding dairy cows, especially because it improves the energy content of their diet (Grummer, 2004). Low-energy diets lead to reduced milk production and promote excessive weight loss, especially during early lactation, as dairy cows mobilize body fat to keep milk production, thus jeopardizing reproduction. However, diets with excess energy raise production costs
due to more spending on feed, and can be a problem for the cow’s metabolism (Costa et al., 2007).
Responses to lipid supplementation are varied. One of the reasons for this variation consists of changes to feed intake and to ruminal fermentation patterns, especially in the evaluation of ruminal fermentation parameters, pH, concentration of ammoniacal nitrogen, and production of short-chain fatty acids.
Sources of lipids such as soy oil, soybeans, and fatty acid calcium salts have been used in diets for dairy cows. They each have specific characteristics that impart different effects on ruminal fermentation, nutrient digestibility, dry matter intake, and milk production and composition (Freitas Júnior et al., 2010). Generally, alternative sources of lipids such as frying oil and cottonseed are low-cost, which increases interest in maximizing their use in the dairy cow diets.
Material and Methods
The experiment was conducted in Macarani, Bahia, Brazil.
The fieldwork was conducted in a 42-hectare area divided into eight paddocks measuring an average of 5.3 ha each, covered with Brachiaria brizantha,and with water available for all animals on all paddocks. Testing animals were used to keep the paddock’s capacity adjusted, at 1.21 AU/ha (animal units per hectare). The time spent by the animals in the paddocks varied according to the number of days taken to reach an exit height of 20 cm.
Twelve crossbred Holstein × Zebu cows were used (breed degree varying between ½ and ¾) with 100 to 150 days into lactation in the beginning of the experiment period, and mean body weight of 466.9±33.2 kg. The lactating cows were distributed through three simultaneous 4 × 4 Latin squares. The experiment consisted of four periods lasting 17 days each (the first 10 days were for adaptation and the last 7 days were used for data collection), as recommended by Oliveira (2000).
We tested different sources of lipids in the animals’ diet, as follows: diet with no extra source of lipids; diet with cottonseed as the source of lipids; diet with soy oil; and diet with used frying soy oil (Table 1). The used frying soy oil was supplied by pastry shops in town. The diets were calculated to meet maintenance requirements and production of 15 kg milk/day, containing 35 g/kg of fat, according to NRC (2001), based on data from the chemical composition of diet ingredients analyzed previously, in the beginning of the adaptation period.
The diets were calculated so as to be isonitrogenous, keeping the forage to concentrate ratio at 70:30.
The concentrates (Table 2) were supplied to the animals in individual stalls provided with a trough and drinker, and
an area of 4 m2. The concentrate feed was offered twice
daily soon after milking. The animals were weighed at the beginning of the experiment and at the end of each period to check the live weight of the animals in each diet.
Cows were milked manually throughout the experiment by the same professional twice a day, at 05.30 h and at 15.00 h, and the milk was weighed during the entire collection period, from the 11th to the 17th day of each experiment period. Samples of 200 mL of milk were collected in the afternoon of the 15th day and in the morning of the 16th day. The samples obtained in the afternoon of the 15th day were kept refrigerated at a temperature between 2 and 6 °C. After being proportionally mixed with the samples collected in the morning of the next day (16th day), per animal, they were immediately analyzed for fat, density, solids non-fat, total solids, proteins, and lactose, according to the methodology described by the International Dairy Federation (1996).
The milk production corrected (CMP) for 35 g/kg of fat was calculated according to Sklan et al. (1992) using the following formula CMP = (0.432 + 0.1625 × % milk fat) × production of milk in kg/day.
To estimate the availability of forage (Table 3), we used the zero-cut agronomic technique employed by Penati (2002). For each simultaneous entry and exit of the animals into and out of each of the eight paddocks, an iron square measuring 0.25 m2 was introduced. All grass stems and leaf
blades that sprouted within the square space were cut close to the ground with a steel pruning knife. All grass stems and leaf blades within the square space that sprouted outside were disregarded. The procedure was repeated 52 times
Table 1 - Proportion of diet ingredients in g/kg of dry matter
Ingredient
Extra source of lipids
Absent Cottonseed Soy oil Used frying soy oil
Estimated pasture 700.0 700.0 700.0 700.0
Ground corn kernel 212.9 149.9 188.5 188.5
Soybean meal 71.0 36.8 76.6 76.6
Cottonseed 0.0 97.3 0.0 0.0
Soy oil 0.0 0.0 18.3 0.0
Used frying soy oil 0.0 0.0 0.0 18.3
Urea 5.0 5.1 5.1 5.1
Calcitic lime 1.9 2.6 2.5 2.5
Mineral mixture1 9.2 8.3 9.0 9.0
1 Composition: calcium - 185 g/kg; phosphorus - 90 g/kg; magnesium - 4 g/kg;
sulfur - 10 g/kg; sodium - 117 g/kg; selenium - 30 ppm; copper - 1,500 ppm; zinc - 4,000 ppm; manganese - 1,200 ppm; iodine - 150 ppm; cobalt - 150 ppm.
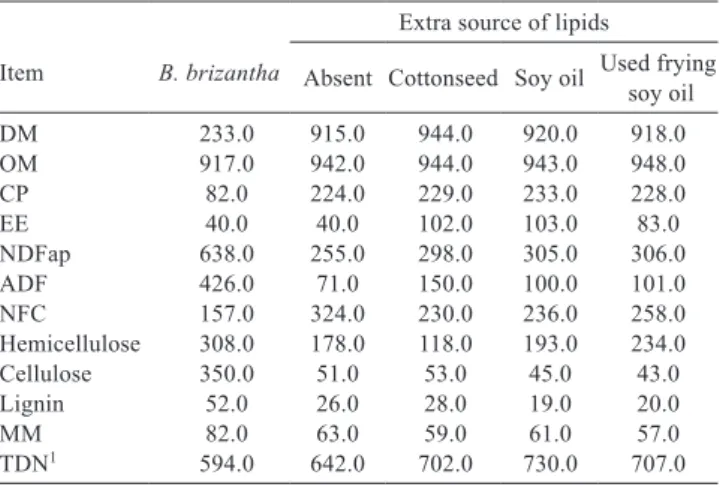
Item B. brizantha
Extra source of lipids
Absent Cottonseed Soy oil Used frying soy oil
DM 233.0 915.0 944.0 920.0 918.0
OM 917.0 942.0 944.0 943.0 948.0
CP 82.0 224.0 229.0 233.0 228.0
EE 40.0 40.0 102.0 103.0 83.0
NDFap 638.0 255.0 298.0 305.0 306.0
ADF 426.0 71.0 150.0 100.0 101.0
NFC 157.0 324.0 230.0 236.0 258.0
Hemicellulose 308.0 178.0 118.0 193.0 234.0
Cellulose 350.0 51.0 53.0 45.0 43.0
Lignin 52.0 26.0 28.0 19.0 20.0
MM 82.0 63.0 59.0 61.0 57.0
TDN1 594.0 642.0 702.0 730.0 707.0
DM - dry matter; OM - organic matter; CP - crude protein; EE - ether extract; NDFap - neutral detergent fiber corrected for ash and proteins; ADF - acid detergent fiber; NFC - non-fibrous carbohydrates; MM - mineral matter; TDN - total digestible nutrients.
1 Values estimated according to Detmann et al. (2007).
per paddock: 12 to collect the material to be weighed, and another 40 times to estimate the forage biomass before and after grazing in each paddock, estimated in kg/ha, using the equation proposed by Gardner (1986).
During the experimental period, the environmental variables temperature and rainfall (Table 4) were recorded.
To estimate the production of feces, we used chromium oxide as an external marker, supplied daily soon after each animal was milked, in a single dose of 10 g for 10 days, five of which were for adaptation and regulation of the marker excretion flow and five to collect the feces inside each 17-day experiment period. The feces samples were collected directly from the rectal ampulla at alternate times: at 14.00 h on the 13th day, 14.00 on the day after, 12.00 h on the 15th day, 10.00 h on the 16th day, and 08.00 h on the last sampling day. These were stored in a freezer at –10 ºC.
The feces samples were packaged in aluminum containers and pre-dried in a forced-air oven at 60 °C for 72 to 96 h. They were later milled through a 1-mm mesh sieve mill, grouped proportionally based on their air-dry weight, forming compound samples of each animal per period, and were then stored for further analyses. Feces samples were analyzed by atomic absorption spectrophotometry (AAS) to measure the chromium. Fecal production was determined according to the following equation:
PF = COS/COF,
in which PF is the daily production of feces (g/day); COS refers to the chromium oxide supplied (g/day); and COF is the concentration of chromium oxide in the feces (g/g DM).
As an internal marker, we used indigestible neutral detergent fiber (iNDF), according to Detmann et al. (2001)
and Detmann et al. (2007). Samples of the feed supplied (forage, concentrates) and feces were incubated for 240 h (Casali et al., 2008), in duplicate (20 mg DM/cm2), in
nonwoven fabric bags (100 g/m2), within the rumen of two
crossbred Holstein-Zebu cows fed a forage and concentrate diet. After this period, the material left from the incubation was extracted with neutral detergent according to the methodology by Van Soest (1994) for the quantification of iNDF levels.
Dry matter intake was obtained by the following equation: DMI = {[(PF*CMF) – MS]/CMFR} + DMIS, in which DMI is dry matter intake (kg/day); PF is the production of feces (kg/day); CMF is the concentration of marker present in the feces (kg/kg); MS is the marker present in the supplement (kg/day); CMFR is the concentration of the marker present in the forage (kg/kg); and DMIS is the intake of dry matter from the supplement (kg/day).
During the entire experimental period, the feed supplied and the feces were collected, packed in plastic bags, and stored in a freezer at a temperature of –10 ºC.
The forage and concentrate samples were pre-dried in a forced-air oven at 60 ºC and milled through a 1-mm mesh sieve cutting mill for chemical analysis.
Dry matter (DM), organic matter (OM), crude protein (CP), ether extract (EE), neutral detergent fiber (NDF), acid detergent fiber (ADF), non-fibrous carbohydrates (NFC), cellulose (CEL), hemicellulose (HEM), lignin (LIG), and mineral matter (MM) contents were analyzed. The level of neutral detergent fiber corrected for ash and proteins (NDFap) was determined as recommended by Mertens (1994).
The concentration of neutral detergent fiber was determined using the method described by Van Soest et al. (1991), with the addition of heat-stable amylase, but without sodium sulphite.
Total carbohydrates (TC) were obtained according to Sniffen et al. (1992): TC = 100 – (%CP + %EE + % of ash).
Total digestible nutrients (TDN) were calculated according to Weiss (1999), but with NDF and NFC corrected for ash and proteins, by the following equation:
TDN (%) = DCP + DNDFap + DNFCap + 2.25DEE, in which DCP = digestible CP; DNDFap = digestible NDFap; DNFCap = digestible NFCap; and DEE = digestible EE.
To determine the digestibility coefficients of the dry matter (DCDM), neutral detergent fiber (DCNDF), acid detergent fiber (DCADF) and crude protein (DCCP) in the diets, we used the following equation:
DC = (ingested nutrient – excreted nutrient) × 100 ingested nutrient
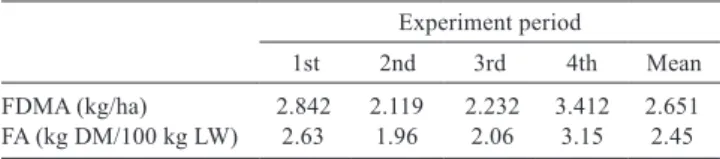
Table 3 - Availability and offer of forage per experiment period Experiment period
1st 2nd 3rd 4th Mean
FDMA (kg/ha) 2.842 2.119 2.232 3.412 2.651
FA (kg DM/100 kg LW) 2.63 1.96 2.06 3.15 2.45
FDMA - forage dry matter availability; FA - forage allowance; LW - live weight.
Table 4 - Mean maximum, minimum, and average temperatures, and total rainfall per month observed during the experimental period
Month
February March April
Maximum temperature (ºC) 34.0 37.0 36.0
Minimum temperature (ºC) 20.0 20.0 21.0
Average 28.0 28.9 27.6
All statistical analyses were performed using PROC GLM of SAS (Statistical Analysis System, version 9.4). Animals were allocated to four 4 × 4 Latin squares (Kuehl, 2000), containing sixteen animals, four experimental periods, and four treatments. Each animal within a period was the experimental unit. The statistical model is shown below:
yijkl = µ + αi + βj +c(α)ki + tl + εijkl,
in which yijkl represents the observation of cow k in square i at period j subjected to treatment l; αi represents the fixed effect of square i (i = 1, 2, 3 ,4); βj represents the fixed effect of period j (j = 1, 2, 3, 4); c(α)ki represents the fixed effect of cowk within square i; and εijkl represents the random error.
The results for intake, feed efficiency, variation in body weight, milk production, milk composition, and digestibility were subjected to analysis of variance and test of means, with Tukey’s test applied at 0.05 probability for comparison of the means. All statistical procedures were carried out using SAS software (Statistical Analysis System, version 9.4).
Results
The intakes of DM, NDF, CP, TC, and NFC were similar (P>0.05) for all diets with different sources of lipids (Table 5). The intakes of CP, TC, and NFC did not differ (P>0.05) among the studied diets.
The lowest (P<0.05) EE intake was found in animals fed diets with no extra source of lipids, followed by animals supplemented with used frying oil (Table 5). However, the EE intake did not differ (P>0.05) between animals supplemented with soy oil and cottonseed, both being higher than the others diets. This change is probably
due to the chemical characteristics of the experimental diets (Table 2). Total digestible nutrients intake did not differ (P>0.05) among the studied diets, which can be explained by the absence of effect on DM intake and the similarity in levels of TDN between the experimental diets (Table 5).
A difference was noted (P<0.05) in apparent digestibility of DM, NDF, CP, and NFC (Table 6).
An unexpected behavior was observed for apparent digestibility of NDF, with higher (P<0.05) values for diets containing saturated fat sources and lower digestibility for the diet containing cottonseed as the source of lipids.
The apparent digestibility of CP was higher (P<0.05) for the diet with no source of lipids and did not vary (P>0.05) among the evaluated diets.
The different sources of lipids did not change (P>0.05) milk production or corrected milk production (35 g/kg fat) (Table 7).
There was little variation (P>0.05) in milk density with the use of sources of lipids in the diets. The numbers found for milk fat (Table 7) indicate no influence (P>0.05) of sources of lipids on fiber digestion as well as changes in the acetate and propionate rates.
The levels of protein, lactose, total dry extract, and defatted dry matter in the milk were different (P<0.05) among the diets with sources of lipids. Variables protein, lactose, and defatted dry matter in milk differed (P<0.05) between the diet with no lipid source and those with lipid sources. However, they did not differ (P>0.05) among themselves, showing that lipid sources promoted a decrease in the level of these variables. The total dry extract differed (P<0.05) between the diet with soy oil and the diet with no lipid source, resulting in lower levels.
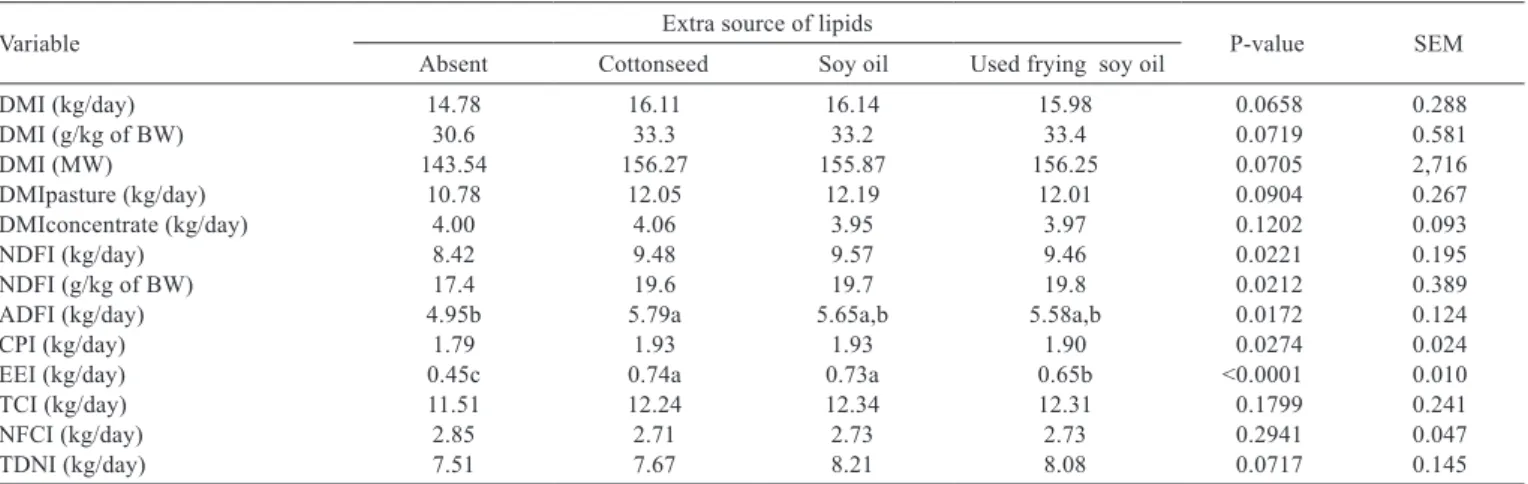
Table 5 - Intake of nutritional fractions by lactating cows fed diets with different sources of lipids
Variable Extra source of lipids P-value SEM
Absent Cottonseed Soy oil Used frying soy oil
DMI (kg/day) 14.78 16.11 16.14 15.98 0.0658 0.288
DMI (g/kg of BW) 30.6 33.3 33.2 33.4 0.0719 0.581
DMI (MW) 143.54 156.27 155.87 156.25 0.0705 2,716
DMIpasture (kg/day) 10.78 12.05 12.19 12.01 0.0904 0.267
DMIconcentrate (kg/day) 4.00 4.06 3.95 3.97 0.1202 0.093
NDFI (kg/day) 8.42 9.48 9.57 9.46 0.0221 0.195
NDFI (g/kg of BW) 17.4 19.6 19.7 19.8 0.0212 0.389
ADFI (kg/day) 4.95b 5.79a 5.65a,b 5.58a,b 0.0172 0.124
CPI (kg/day) 1.79 1.93 1.93 1.90 0.0274 0.024
EEI (kg/day) 0.45c 0.74a 0.73a 0.65b <0.0001 0.010
TCI (kg/day) 11.51 12.24 12.34 12.31 0.1799 0.241
NFCI (kg/day) 2.85 2.71 2.73 2.73 0.2941 0.047
TDNI (kg/day) 7.51 7.67 8.21 8.08 0.0717 0.145
Means sharing a common letter are not significantly different from one another, and means with no letters had no significant effect.
Discussion
The mean dry matter intake (DMI) of 33.0 g/kg of body weight (BW) was higher than the 25.0 g/kg of body weight recommended by the NRC (2001). This is probably due to the absence of negative effects on ruminal microorganisms from the lipid sources. Duarte et al. (2005) did not find any effects of the supplementation or the source of fat used on DMI in dairy cows. The mean DMI (15.7 kg/day) observed in this work was similar to the 15.9 and 16.1 kg/day found by Borba et al. (2006) and Costa et al. (2007), respectively. These authors also worked with sources of lipids for lactating cows.
Vargas et al. (2002) observed a reduction in dry matter intake when soybeans and soy oil were used in the diets of dairy cows, with a higher decrease in DMI occurring in the diet containing soy oil. Moallem et al. (2007) and Freitas Júnior et al. (2010) also reported a reduction in DMI with the use of protected (calcium salts) and unprotected (soy oil) lipid sources.
Although a reduction in DMI is expected from energy satiation when sources of lipids are used in the diet of dairy cows, especially if they are lactating, no difference (P>0.05) in intake is observed when the source of lipids is
mixed in the concentrate satisfactorily, or when animals are previously adapted to the supplementary fat supply (NRC, 2001).
Neutral detergent fiber intake (19 g/kg of body weight) was higher than the 12 g/kg of body weight recommended by Mertens (1994), evidencing that crossbred lactating cows kept in tropical pastures consume larger quantities of NDF, probably due to the higher fraction of this component in tropical forages compared with temperate forages, and to enhanced ruminal distension.
The intakes of CP, TC, and NFC did not differ among the studied diets, which can be justified by the attempt to formulate diets with similar composition, by the fixed level of concentrates, and by the similar dry matter intake.
A difference was observed in apparent digestibility of DM, NDF, CP, and NFC, probably caused by the use of supplementary lipid sources that caused a reduction of the apparent digestibility of DM in relation to the diet without any sources of lipids. However, there was no variation between the sources. It is important to stress that the low digestibility of DM in the experimental diets, of 0.504 (g/g) on average, can be explained by the levels of NDF in diet ingredients (Table 2). Freitas Junior (2008) obtained a mean DM digestibility of 0.680 (g/g) and found no effect on Table 6 - Digestibility coefficients of nutrients in lactating cows fed diets containing different sources of lipids
Item (g/g) Extra source of lipids P-value SEM
Absent Cottonseed Soy oil Used frying soy oil
DCDM 0.569a 0.486b 0.474b 0.486b <0.0001 0.004
DCNDF 0.444b 0.423c 0.462ab 0.469a <0.0001 0.003
DCCP 0.545a 0.451b 0.465b 0.461b 0.0425 0.004
DCEE 0.424 0.412 0.456 0.457 0.1500 0.009
DCNFC 0.826a 0.772b 0.778b 0.772b 0.0035 0.005
TDN 0.508 0.475 0.500 0.508 0.1028 0.005
Means sharing a common letter are not significantly different from one another, and means with no letters had no significant effect.
SEM - standard error of the mean; DCDM - digestibility coefficient of dry matter; DCNDF - digestibility coefficient of neutral detergent fiber; DCCP - digestibility coefficient of crude protein; DCEE - digestibility coefficient of ether extract; DCNFC - digestibility coefficient of non-fibrous carbohydrates; TDN - total digestible nutrients.
Table 7 - Average milk production and composition, feed efficiency, and variation in body weight of crossbred cows with and without lipid supplementation
Variable Extra source of lipids P-value SEM
Absent Cottonseed Soy oil Used frying soy oil
Milk production (kg/day) 12.25 11.80 12.32 12.31 0.4443 0.097
Corrected milk yield (kg/day) 12.20 11.49 11.46 11.65 0.8114 0.213
Density (g/mL) 1031.25 1030.53 1030.75 1030.59 0.3165 0.149
Fat (g/kg) 34.8 33.5 30.8 31.7 0.2417 0.886
Protein (g/kg) 34.7a 33.8b 33.9b 33.7b 0.0415 0.113
Lactose (g/kg) 45.5a 44.5b 44.4b 44.5b 0.0314 0.149
Total dry extract (g/kg) 122.5a 119.1ab 116.4b 117.1ab 0.0254 0.928
Defatted dry matter (g/kg) 87.8a 85.6b 85.7b 85.4b 0.2224 0.285
Feed efficiency (kg of milk/kg of DM) 0.83 0.73 0.76 0.77 0.0900 0.017
Body weight 6.63 8.29 2.29 5.96 0.9611 1.627
Body weight/day 0.39 0.49 0.14 0.35 0.9611 0.082
the apparent digestibility of DM in relation to the control diet. Leite (2006) and Silva et al. (2007) did not observe any difference, either, in the apparent digestibility of DM when different sources of lipids were used in the diet. The results of the present study helped to confirm the effect of reduced dry matter digestibility from the use of lipid sources. However, in this work, the reduction in digestibility did not cause any changes to intake or to milk production.
A number of studies report depression of apparent digestibility of the fiber with the use of lipids (Leite, 2006; Costa, 2008), although there are reports such as that of Havartine and Allen (2006), who observed no effect of saturated fat sources and of the mixture of both on the apparent digestibility of nutrients in diets containing 83 g/kg of fatty acids in the diet DM. The mean digestibility of NDF (0.449 g/g) was similar to that reported by Freitas Júnior (2008), who found no effect of the different sources of lipids on the digestibility of NDF.
According to Silva et al. (2007), the reduced DCCP with the inclusion of a source of lipids is explained by a higher escape of dietary protein, by the inhibiting effect of lipids on the protozoa population decreasing the level of ammonia, increasing the flow of bacteria to the intestine and therefore promoting higher participation of dietary nitrogen in the fecal matter and reducing the apparent digestibility coefficient of crude protein. The apparent digestibility of crude protein observed (0.480) in this work was lower than the 0.708 reported by Freitas Júnior et al. (2010). The apparent digestibility of non-fibrous carbohydrates showed the same behavior as the digestibility coefficient of crude protein, and can be explained by the lack of effect on DCEE and by the effect of DCCP and DCDM. Oliveira (2005) reported values close to 0.850 for the digestibility of lipids in diets with high proportion of forage for dairy cows.
The different sources of lipids did not change milk production or corrected milk production, showing that the performance of lactating cows is not changed when lipid sources are used in the proportion of 58 g/kg of dry matter of the diet. Furthermore, we believe that the quality of the pasture provided a satisfactory intake of nutrients, which met the requirements of the animals when associated with the forage, thus fulfilling the requirements for their milk production levels. Freitas Júnior et al. (2010) did not find any effects on the corrected milk production when using different sources of lipids in the diet of lactating cows with 55.0 g/kg of EE in the dietary dry matter. According to the results of Borba et al. (2006), Freitas Júnior et al. (2010), and the present work, levels of up to 80 g/kg of EE in the diet do not interfere with the production, and the producer may opt for the diet that is most economic.
Costa et al. (2007) reported increased corrected milk production when using diets with 50.0 g/kg of EE containing protected oil, whole rice meal plus rice oil, and whole rice meal plus bovine tallow as sources of lipids. This increase in production when using lipids in the diet is related to the increased ingestion of energy. The mean production of milk was 12.2 kg, below the production expected (15.0 kg) from the diet formulation (NRC, 2001). This lower production is explained by the breed degree of the animals used in the experiment, showing lower efficiency in milk production in relation to animals of specialized breeds.
The numbers found for milk fat indicate no influence of sources of lipids on fiber digestion as well as changes in the acetate and propionate rates. It is important to stress that the diets with sources of lipids resulted in higher levels of milk fat than the minimum limit of 30.0 g/kg established by Regulatory Instruction #51 (Brasil, 2002).
The diet with no source of lipids had higher levels of milk protein in relation to the other diets, a fact that can be explained by the reduced production of microbial protein in the rumen, the use of sources of lipids, and, consequently, by the reduced availability of amino acids to form milk protein. Although diets with lipid sources had decreased levels of protein, these values were above the minimum limit of 29.0 g/kg established by Regulatory Instruction #51 (Brasil, 2002). Working with soy oil, soybeans and fatty acid calcium salts, Freitas Júnior et al. (2010) did not obtain any effects on the level of milk protein with the inclusion of sources of lipids in the diet (55.0 g/kg of EE) when compared with the control diet (25.0 g/kg of EE).
Conclusions
The use of cottonseed, soy oil, and used frying soy oil in diets for lactating cows on tropical pastures does not change the intake of nutritional fractions or milk production; therefore, the use of these feedstuffs is optional.
References
Borba, L. R. O.; Stumpf Junior, W.; Fischer, V. and Fernandes, A. 2006. Níveis crescentes de gordura na dieta de vacas leiteiras de alta produção. Revista Brasileira de Agrociência 12:87-92. Brasil. Ministério da Agricultura, Pecuária e Abastecimento. 2002.
Instrução normativa Nº 51, de 18 de setembro de 2002. Diário Oficial (República Federativa do Brasil), Brasília, DF, 20 set. 2002. Seção 1, p.13-22.
Costa, M. G. 2008. Desempenho, perfil de ácidos graxos do leite e dinâmica de nutrientes de vacas leiteiras submetidas a diferentes fontes lipídicas. Tese (D.Sc.). Universidade Federal de Viçosa, Viçosa, MG.
Costa, P. B.; Stumpf Júnior, W.; Nörnberg, J. L.; Fischer, V.; Queiroz, A. C. and Mello, R. 2007. Suplementação de lipídeos de diferentes fontes em dietas para vacas Jersey na fase inicial de lactação. Revista Brasileira de Zootecnia 36:888-895.
Detmann, E.; Paulino, M. F.; Zervoudakis, J. T.; Valadares Filho, S. C.; Euclydes, R. F.; Lana, R. P. and Queiroz, D. S. 2001. Cromo e indicadores internos na determinação do consumo de novilhos mestiços, suplementados, a pasto. Revista Brasileira de Zootecnia 30:1600-1609.
Detmann, E.; Valadares Filho, S. C.; Henriques, L. T.; Pina, D. S.; Paulino, M. F.; Magalhães, A. L. R.; Figueiredo, D. M.; Porto, M. O. and Chizzotti, M. L. 2007. Reparametrização do modelo baseado na lei de superfície para predição da fração digestível da fibra em detergente neutro em condições brasileiras. Revista Brasileira de Zootecnia 36:155-164.
Duarte, L. M. D.; Stumpf Júnior, W.; Fischer, V. and Salla, L. E. 2005. Efeito de diferentes fontes de gordura na dieta de vacas Jersey sobre o consumo, a produção e a composição do leite. Revista Brasileira de Zootecnia 34:2020-2028.
Freitas Junior, J. E. Utilização de fontes de gordura nas rações de vacas leiteiras. 2008. Dissertação (M.Sc.). Faculdade de Medicina Veterinária e Zootecnia, Universidade de São Paulo, Pirassununga.
Freitas Júnior, J. E.; Rennó, F. P.; Santos, M. V.; Gendra, J. R.; Maturana Filho, M. and Venturelli, B. C. 2010. Productive performance and composition of milk protein fraction in dairy cows supplemented with fat sources. Revista Brasileira de Zootecnia 39:845-852. Gardner, A. L. 1986. Técnicas de pesquisa em pastagem e
aplicabilidade de resultados em sistema de produção. IICA/ EMBRAPA CNPGL, Brasília. 197p.
Grummer, R. R. 2004. Gordura da dieta: Fonte energética e/ou regulador metabólico? p.83-108. In: Anais do 8o Curso Novos Enfoques na Produção e Reprodução de Bovinos. CONAPEC Jr - UNESP-Botucatu, Uberlândia.
Harvatine, K. J. and Allen, M. S. 2006. Effects of fatty acid supplements on feed intake, and feeding and chewing behavior of lactating dairy cows. Journal of Dairy Science 89:1104-1112. International Dairy Federation. 1996. Quality of raw milk. Bulletin
International Dairy Federation 310:1-178.
Kuehl, R. O. 2000. Design of experiments: statistical principles of research design and analysis. 2nd ed. Duxbury Press, New York. Leite, L. C. 2006. Perfil dos ácidos graxos do leite e metabolismo de
lipídios no rúmen de vacas recebendo dietas com alto ou baixo teor de concentrado e óleo de soja ou de peixe. Tese (D.Sc.). Escola Superior de Agricultura “Luiz de Queiroz”, Piracicaba.
Mertens, D. R. 1994. Regulation of forage intake. p.450-493. In: Forage quality evaluation and utilization. Fahey, G. C.; Collins, M.; Mertens, D. R. et al., eds. ASA. CSSA, SSSA, Madison.
Moallem, U.; Katz, M.; Arieli, A. and Lehrer, H. 2007. Effects of peripartum propylene glycol or fats differing in fatty acid profiles on feed intake, production, and plasma metabolites in dairy cows. Journal of Dairy Science 90:3846-3856.
NRC - National Research Council. 2001. Nutrient requirements of dairy cattle. 7th ed. National Academy of Sciences, Washington, D.C. Oliveira, A. S. 2000. Consumo, digestibilidade, produção e composição
do leite, produção de proteína microbiana e estimativas das excreções de derivados de purinas e de uréia em vacas lactantes alimentadas com rações contendo diferentes teores de uréia. Dissertação (M.Sc.). Universidade Federal de Viçosa, Viçosa, MG. Oliveira, M. A. 2005. Proporção de forragem e teor de lipídeos na dieta
de vacas leiteiras, sobre o consumo, produção e a composição do leite. Dissertação (M.Sc.). Universidade Federal de Minas Gerais, Belo Horizonte.
Penati, M. A. 2002. Estudo do desempenho animal e produção do capim tanzânia (Panicum maximum, Jacq) em um sistema rotacionado de pastejo sob irrigação em três níveis de resíduo pós pastejo. Tese (D.Sc.). Escola Superior de Agricultura “Luiz de Queiroz”, Universidade de São Paulo, Piracicaba.
Silva, M. M. C.; Rodrigues, M. T.; Branco, R. H.; Rodrigues, A. F.; Sarmanto, J. L. R.; Queiroz, A. C. and Silva, S. P. 2007. Suplementação de lipídios em dietas para cabras em lactação: consumo e eficiência de utilização de nutrientes. Revista Brasileira de Zootecnia 36:257-267.
Sklan, D.; Ashkenazi, R.; Braun, A.; Devorin, A. and Tabori, K. 1992. Fatty acids, calcium soaps of fatty acids and cottonseeds fed to high yielding cows. Journal of Dairy Science 75:2463-2472. Sniffen, C. J.; O’ Connor, J. D.; Van Soest, P. J.; Fox, D. G. and Russel,
J. B. 1992. A net carbohydrate and protein system for evaluating cattle diets. 2. Carbohydrate and protein availability. Journal of Animal Science 70:3562-3577.
Van Soest, P. J.; Robertson, J. B. and Lewis, B. A. 1991. Symposium: Carbohydrate methodology, metabolism, and nutritional implications in dairy cattle. Methods for dietary fiber neutral detergent fiber and non-starch polysaccharides in relation to animal nutrition. Journal of Dairy Science 74:3583-3597.
Van Soest, P. J. 1994. Nutritional ecology of the ruminant. 2nd ed. Cornell University Press, Ithaca. 476p.
Vargas L. H.; Lana, R. P.; Jham, G. N.; Santos, F. L.; Queiroz, A. C. and Mancio, A. B. 2002. Adição de lipídios na ração de vacas leiteiras: parâmetros fermentativos ruminais, produção e composição do leite. Revista Brasileira de Zootecnia 31:522-529.