Cross-cultural adaptation of the Safety Attitudes Questionnaire - Short
Form 2006 for Brazil
1Rhanna Emanuela Fontenele Lima de Carvalho
2Silvia Helena De Bortoli Cassiani
3The objective of this study was to perform a cross-cultural adaptation of the Safety Attitudes
Questionnaire - Short Form 2006 for Brazil. The instrument was applied in six hospitals in three
regions of Brazil. Content, face, and construct validity was performed. Analysis of the instrument’s
reliability was performed by verifying the items’ internal consistency through Cronbach’s alpha.
The sample was composed of 1301 professionals working in clinical and surgical wards of six
hospitals. Conirmatory analysis showed that the model including 41 items was satisfactory. The
Portuguese version presented an alpha of 0.89. The item-total correlations among the domains
were moderate to strong, except for the domain Stress Recognition. We concluded that the
instrument’s version adapted to Portuguese and applied in our sample is valid and reliable.
Descriptors: Translating; Validation Studies; Organizational Culture.
1 Paper extracted from Doctoral Dissertation “Adaptação transcultural do Safety Attitudes Questionnaire para o Brasil - Questionário de Atitudes de Segurança” presented to Escola de Enfermagem de Ribeirão Preto, Universidade de São Paulo, WHO Collaborating Centre for Nursing Research Development, Brazil. This research was supported by Fundação de Amparo à Pesquisa do Estado de São Paulo
(FAPESP), process # 09/16231-6 and Organização Mundial da Saúde (OMS), process # PS08041.
2 RN, PhD.
3 PhD, Full Professor, Escola de Enfermagem de Ribeirão Preto, Universidade de São Paulo, WHO Collaborating Centre for Nursing Research Development, Brazil.
Corresponding Author:
Rhanna Emanuela Fontenele Lima de Carvalho
Av. Mister Hull, 2933, Apto. 401 B Violete
Bairro: Presidente Kenedy
CEP: 60356-000, Fortaleza, Ceará, Brasil E-mail: [email protected]
Rev. Latino-Am. Enfermagem
2012 May.-June;20(3):575-82
www.eerp.usp.br/rlae
Questionário Atitudes de Segurança: adaptação transcultural do Safety Attitudes Questionnaire - Short Form 2006 para o Brasil
O objetivo deste estudo foi realizar a adaptação transcultural do Safety Attitudes
Questionnaire - Short Form 2006 para o Brasil. O instrumento foi aplicado em seis hospitais
de três Regiões do Brasil. Foi realizada a validade de conteúdo, face e de construto. A análise da coniabilidade do instrumento foi realizada por meio da análise da consistência interna dos itens por meio do alfa de Cronbach. A amostra do estudo foi composta por 1.301 proissionais das enfermarias clínicas e cirúrgicas de seis hospitais. A análise conirmatória mostrou que o ajuste do modelo inal dos 41 itens foi considerado satisfatório. Aversão do instrumento em Português apresentou alfa de 0,89. As correlações item/total entre os domínios foram consideradas de moderada a forte, com exceção do domínio percepção do estresse. Conclui-se, portanto, que a versão do instrumento adaptada para o Português é considerada válida e coniável nesta amostra.
Descritores: Tradução (Processo); Estudos de Validação; Cultura Organizacional.
Cuestionario de actitudes de seguridad: adaptación transcultural del Safety Attitudes Questionnaire - Short Form 2006 para Brasil
El objetivo de este estudio fue el de adaptación transcultural del cuestionario Actitudes de Seguridad – Short Form 2006 para Brasil. Métodos: El instrumento fue aplicado en seis hospitales en tres regiones del Brasil. Se realizó la validez de contenido, la cara y la construcción. El análisis de coniabilidad del instrumento se realizó mediante el análisis de la consistencia interna de los ítems a través de alfa de Cronbach. Resultados: La muestra del estudio fue compuesto por 1.301 profesionales en salas clínicas y cirugía. El análisis conirmatorio mostró que el ajuste del modelo inal de los 41 ítems fue satisfactorio. La versión en portugués del instrumento mostró un alfa de 0,89. Las correlaciones ítem-total entre los dominios se consideran entre moderados y fuertes, con la excepción de dominio Percepción del Estrés. Conclusión: Se concluye, que la versión adaptada del instrumento al portugués se considera válida y iable en la muestra.
Descriptores: Traducción (Proceso); Estudios de Validación; Cultura Organizacional.
Introduction
The use of scales to measure the safety climate in
healthcare organizations has been implemented since the
early 1980’s. This way of measuring the safety climate
is an important method to assess the quality of care
provided to patients and scales can be applied before and
after the implementation of interventions, such as staff
training and stress minimizing activities.
Safety climate is related to unsafe practices, with
an increase in injuries among professionals(1). Among the most widely used instruments to analyze safety climate,
only two (CSS-Safety Culture Survey and SAQ - Safety
Attitudes Questionnaire) show a positive association
between the obtained scores and improvements in patient
care delivery, although the SAQ is more sensitive to
evaluate individual safety attitudes than the CSS(1). The results of this scale can also be compared with patient
safety indicators, such as hospital infection rates, pressure
ulcer rates and length of hospital stay(2). That is, the higher the score obtained on the scale, the shorter the patients’
length of stay at the unit and the lower the number of
hospital infections.
Before applying any scale or questionnaire, however,
researchers need to ensure the instruments’ validity.
Another important aspect is the cultural context in which
these scales will be used. Before implementing any
instruments, it is essential to culturally adapt them to the
country or city where they will be applied(2).
Based on these recommendations, we aimed to provide for the irst Brazilian scale, capable of assessing the safety climate based on professionals’ perception. The
scale chosen was the Safety Attitudes Questionnaire -
Carvalho REFL, Cassiani SHB. 577
properties (Cronbach 0.7 to 0.8) and is the assessment
tool most commonly used in the United States, UK and
Australia(3). This scale is capable of providing information about factors that need to be implemented within the institution and inluence the safety climate, such as teamwork, job satisfaction and working conditions.
Method
This is a methodological and cross-sectional study
with a quantitative approach. In this study, we performed
content, face and construct validity.
The instrument
The Safety Attitudes Questionnaire - Short Form
2006 was created to evaluate how professionals perceive patient safety issues. The instrument has 41 questions that attempt to measure perceptions of safety climate
through six domains: Teamwork Climate, Job Satisfaction,
Perception of the Management Unit and the Hospital,
Working Conditions and Stress Recognition(4). Answers to
questions follow a ive-point Likert scale: disagree strongly (A), disagree slightly (B), neutral (C), agree slightly (D),
agree strongly and (E) not applicable.
The instrument is divided into two parts: the irst part is composed of 41 questions that address the six domains; the second part collects data from professionals
(gender, profession, and years in specialty).
The inal score of the instrument ranges from 0 to 100, where zero represents the worst and 100 the best
perception of the safety climate. Values are considered
positive when the total score is equal to or higher than
75. The score is ordered as follow: disagree strongly (A)
equals 0 points, disagree slightly (B) 25 points, neutral (C)
50 points, agree slightly (D) 75 points and agree strongly
(E) 100 points. Scores are counted as follows: Initially,
the questions are recoded, i.e. the answer “I totally
disagree” becomes “totally agree”, and so on. Then, the
questions are grouped per domain. Finally, responses to
the questions in each domain are added up and divided
by the number of questions in each area. For example,
Stress Recognition is composed of four questions. If the
participant’s answers to each question are, respectively,
neutral, agree slightly, neutral and disagree slightly, the score for this area will be: (50+ 75+ 50+25)/4=50.
Local data collection
After the translation process of the Safety Attitudes
Questionnaire, we proceeded with the application of the
questionnaires to evaluate the scale’s psychometric properties,
reliability and validity. The instrument was administered at six
public tertiary hospitals in three regions of Brazil.
Team Training
Before initiating data collection, technical visits were
conducted at each hospital in order to learn about the
institutions and clarify the importance of the study to the
hospital managers.
A coordinator and two research assistants were
appointed to each hospital. All coordinators are members
of the same research group and were familiar with
the studied hospitals. The project coordinators and
researchers selected the research assistants. To be
chosen, research assistants should be health professionals
and have knowledge of the routine at the hospitals where
the research would be conducted.
The research coordinators were responsible for
meeting with the managers and the staff, study the
logistics, guide the research assistants, and distributing
and collecting the questionnaires. The research assistants
were responsible for applying the questionnaire to the
professionals.
Training was implemented at each research center
and took one week. The training was aimed at familiarizing
the research assistants with the instrument, address
potential doubts that could arise during the completion of
the scale, and train them to approach the professionals.
Participants
The study population consisted of all professionals
working in the clinical and surgical wards of the six health
facilities chosen for the study. Professionals should meet
the following inclusion criteria to participate: having worked
at the hospital for at least one month and working in the
surgical or clinical area at least 20 hours per week. Two to
ten respondents per items are required to perform the factor
analysis; ten respondents were considered in this study(5).
Data Collection
Before data collection, a meeting was held with the
management of each unit to explain the importance and
objectives of the study, as well as the technical procedures
to carry out the research. Data collection was conducted
from July to December 2010.
The professionals were addressed at the workplace
and, at times they were available to participate in the
study. Some instruments were handed over to be answered
and returned within a pre-established return date. Each
term to sign, one of which was returned to the researcher.
Those who agreed to participate received an envelope,
containing a color copy of the scale, along with a pencil and an eraser required to ill out the questionnaire.
Before completing the questionnaire, the researchers
provided each professional with explanations about the
study objectives, how to complete the instrument, and the approximate time to complete the scale (≈ 15 minutes)(3).
Evaluation of psychometric properties
Content, face and construct validity was veriied in this study. A panel of judges conducted the content validity,
face validity was conducted by a group of professionals
during the pre-test, and construct validity was assessed through exploratory and conirmatory factor analysis.
The following steps were followed for the translation
and validation of the instrument: translation, synthesis of
translations, back translation to the source language (back
translation), synthesis of back translation, review by a panel
of judges, pre-test, submission and evaluation of reports
by the instrument authors and psychometric evaluation(6). Before starting the study, the authors of the instrument gave
their permission to translate and validate the instrument.
Two independent bilingual translators translated the
instrument into Portuguese. After this process, a synthesis of
the two versions was developed to obtain a consensus version.
The third phase included the translation of the instrument
back to the source language (back translation). This phase involved two bilingual translators, one of them luent in the target language and the other a native English speaker.
After the translation phase (original and back
translation), a panel of nine judges evaluated all versions
generated during the translation process and back
translation and the original questionnaire to produce a inal version, modiied and adapted to guarantee a faithful replicate to the same language of its intended use(6).
Nine judges were chosen from various specialties
(psychologists, doctors and nurses) and from different
regions of Brazil, aiming to assess the instrument’s
conceptual, semantic, idiomatic and cultural equivalence.
The judges should meet at least one of three criteria to be
chosen: knowledge of the English language; experience in the ield of patient safety; or previous participation in research involving the translation and validation of scales.
The items were considered equivalent when 80%
of the judges agreed on all equivalences. When the item
had a disagreement rate of 80% or higher, the author and
orientador discussed the issues and, in most cases, the
judges’ suggestions were followed.
All documents generated in each phase of the
scale translation and suggested changes for the cultural
adaptation were sent to the author of the scale for
approval.
Following the evaluation of the inal version by the scale author, a pre-test (face validity) was developed with
ten professionals from the studied hospitals, in order to
assess whether the instrument was comprehensible, as
well as to estimate the time spent for its completion.
Secondary-level professionals took longer to answer the
questionnaire than those at the professional level. The
average time to complete the questionnaire was ten
minutes. The secondary-level professionals also showed more dificulties to interpret the questions, which explains the delay to complete the instrument.
All reports concerning each stage of the translation process and the inal instrument were sent to the scale author. The author approved the inal version.
For the analysis of psychometric properties, it is
also important to analyze the reliability of the measuring
instrument. The instrument was subject to reliability
analysis, using Cronbach’s alpha for the scale as a whole and for each domain. This indicator relects the items’ degree of covariance. Its value ranges from zero
to one. The higher the value, the greater the internal
consistency and coherence among the proposed items. Alpha coeficients around 0.8 are considered reasonable, while those under seven are insuficient to demonstrate the instrument’s reliability(7).
Data were entered into an Excel® spreadsheet for further processing and analysis. Data processing was
performed using Statistical Package for Social Science
(SPSS) version 15.0. Factor analysis was performed using
the statistical software R.
Ethical issues
The study received approval from the ethics
committees at the six institutions studied and by the
ethics committee of the World Health Organization, as the
project is funded by this institution. Before applying the
scale, all professionals who agreed to participate in the study received informed consent terms and conidentiality was guaranteed.
Results
Cultural adaptation of the Safety Attitudes Questionnaire - Short Form 2006 for Brazil
After the translation of the Safety Attitudes
Questionnaire-Short Form 2006, the psychometric
properties, reliability and validity were assessed. Of the
Carvalho REFL, Cassiani SHB. 579
The return rate of the questionnaires ranged from 40% to 94% among the study hospitals.
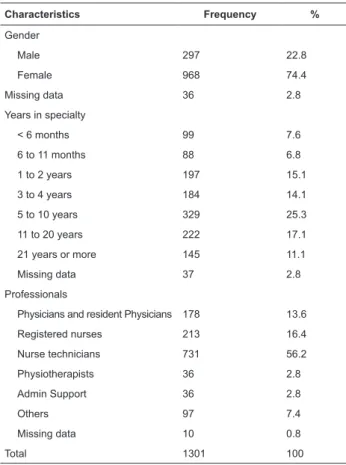
With regard to the characteristics of the study subjects
from all six hospitals: female gender predominated;
technicians and registered nurses were the professionals who most frequently illed out the questionnaire, followed by physicians; 25.3% of the participants had between 5
and 10 years of experience in the specialty (Table 1).
t-test showed that the behavior of the missing data for these
questions could not be regarded as random. Therefore, it
was not possible to use data correction methods.
Thus, we decided to exclude 95 instruments with
missing data in all questions on the Perception of Hospital Management (Q.24A, Q.25A, Q.26A, Q.27A, Q.28A). Analysis of psychometric properties was performed for
1206 out of the 1301 completed instruments. For the
instrument’s remaining questions, in which missing
data were considered random, and could therefore be
corrected, missing data were completed by averaging the
questions in each domain(9).
No questionnaire was excluded because of atypical
responses that tended to extremes. The item “not
applicable” was considered as having a semantic meaning
in the Portuguese version, but it was not included in the
questionnaire average or score calculations.
Reliability and construct validity
After the recoding of reverse items, the score was
calculated for each domain, following the formula: (m-1) x 25,
where m is the average of the items of the domain in question,
with a possible range from 0 to 100. Values greater than 75
express strong agreement among the professionals on the
patient safety questions.
The reliability analysis of the SAQ Portuguese version
was performed by analyzing the internal consistency of its
items through Cronbach’s alpha, both for the total scale
and its domains.
The study results show an alpha coeficient of 0.89 for the Portuguese version (Table 2). The analysis by area showed that ive of its domains presented an alpha above 0.70. The domain of Perception Management Unit
revealed the best internal consistency (0.79) and the
areas Working Conditions and Teamwork Climate the lowest coeficient (0.65).
Table 2 presents the mean and median total score of
the questionnaire and per domain.
Characteristics Frequency %
Gender
Male 297 22.8
Female 968 74.4
Missing data 36 2.8
Years in specialty
< 6 months 99 7.6
6 to 11 months 88 6.8
1 to 2 years 197 15.1
3 to 4 years 184 14.1
5 to 10 years 329 25.3
11 to 20 years 222 17.1
21 years or more 145 11.1
Missing data 37 2.8
Professionals
Physicians and resident Physicians 178 13.6
Registered nurses 213 16.4
Nurse technicians 731 56.2
Physiotherapists 36 2.8
Admin Support 36 2.8
Others 97 7.4
Missing data 10 0.8
Total 1301 100
Table 1- Characteristics of the professionals studied.
Brazil, 2011
Before the quantitative analysis of results related to
the instrument, we performed a descriptive analysis of
missing data and atypical responses.
Study of missing data and atypical responses
When the total of missing data exceeded 5%
per variable, the t-test was performed. This test was
performed to identify whether the unanswered questions would inluence the analysis(8). Missing data percentages higher than 5% were observed for all questions on the perception of Hospital Management: Q.24A (7.8%), Q.25A (8.8%), Q.26A (8 2%), Q.27A (8.1%), Q.28A (8.5%).
The t-test was then conducted for these questions
only. Two groups were formed to compare the averages:
one group of missing data and another group without missing data. The signiicance level was set at 0.05. The
Domains No. of
item
Cronbach’s
alpha Median Average SD
SAQ total 41 0.89 75 61.5 33.4
Teamwork climate 6 0.65 75 69.46 29.9 Safety climate 7 0.67 75 60.5 32.3
Job satisfaction 5 0.77 75 77.66 27.8 Stress recognition 4 0.78 87.5 71.51 33.4 Perception of
management
Unit 6 0.79 50 47.02 35.5
Hospital 4 0.75 50 49.67 33.9
Working
conditions 3 0.65 50 54.69 34.8
Table 2 – Descriptive analysis of the Safety Attitudes
Teamwork climate
Safety Climate
Job Satisfaction
Perception of management of
the Hospital
Perception of management of
the Unit
Working conditions
Stress recognition
SAQ total
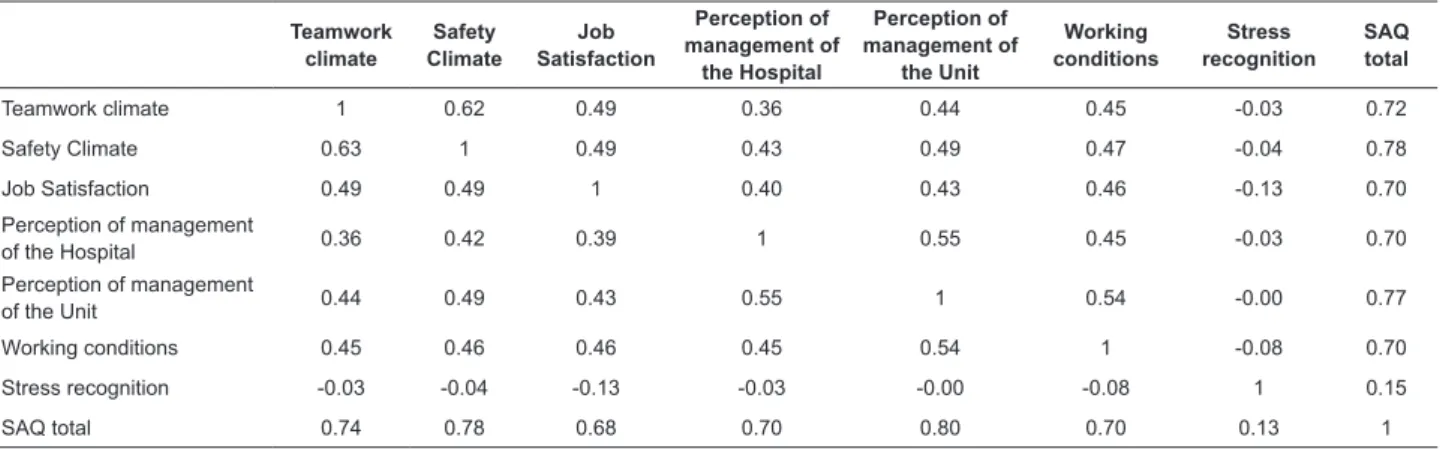
Teamwork climate 1 0.62 0.49 0.36 0.44 0.45 -0.03 0.72
Safety Climate 0.63 1 0.49 0.43 0.49 0.47 -0.04 0.78
Job Satisfaction 0.49 0.49 1 0.40 0.43 0.46 -0.13 0.70
Perception of management
of the Hospital 0.36 0.42 0.39 1 0.55 0.45 -0.03 0.70
Perception of management
of the Unit 0.44 0.49 0.43 0.55 1 0.54 -0.00 0.77
Working conditions 0.45 0.46 0.46 0.45 0.54 1 -0.08 0.70
Stress recognition -0.03 -0.04 -0.13 -0.03 -0.00 -0.08 1 0.15
SAQ total 0.74 0.78 0.68 0.70 0.80 0.70 0.13 1
Table 3 – Pearson correlation coeficient between the domains of the Safety Attitudes Questionnaire - Portuguese version. Brazil, 2011
The construct validity of the SAQ version adapted to Brazil was assessed through an exploratory, conirmatory factor and comparison analysis between different groups.
Exploratory factor analysis of the SAQ adapted
version was performed through Varimax rotation matrix
for the components of Teamwork Climate, Safety Climate,
Job Satisfaction, Perception of Hospital Management,
Perceptions of Unit Management, Working Conditions and Stress Recognition, using 41 items.
According to the correlation matrix of the nine components, we observed that the irst component grouped the items from the domain Teamwork Climate and Safety
Climate. The second component grouped the items related
to the domain Job Satisfaction. The third component is
related to the items of the domain Perception of Management
of the Unit. The fourth component grouped the items of
the domain Perception of Management of the Hospital and item 14, which the author of the SAQ had not allocated to any domain initially. The ifth component grouped the items related to the domain Stress Recognition. The sixth
component grouped the items related to the domain
Working Conditions. The seventh component grouped items 33, 34 and 35, which were not allocated to any domain either. The eighth component grouped two items, which in
the original instrument belonged to the domain Perception
of Management. The ninth component grouped the reverse
items of the instrument, 2, 11 and 36. Nine components were identiied. Each of the nine components coincided with the questions speciic to each area, according to the original scale. However, some differences were found, namely: the irst component divided the areas of Teamwork Climate and Safety Climate. Question 14, “My suggestions about safety would be acted upon if I expressed them to
management” was allocated to the domain Perception of
Hospital Management. This question is not part of any
domain, however, based on the correlation values of the
exploratory factor analysis and the semantic aspect of this
question, the decision was made to allocate it in the domain
of Perception of the Hospital Management.
Conirmatory factor analysis, adjusting the inal 41-item model, was satisfactory. The total scale yielded the
following indexes: Bentler Comparative Fit Index of 0.98, Goodness of it index (GFI) 0.92, Adjusted Goodness of it index (AGFI) of 0.9 and Root Mean Square Error of Approximation (RMSEA) 0.04.
Finally, the following hypotheses were conirmed through the method of group comparison, another type
of construct validation: (1) There is no difference in SAQ
scores between male and female professionals. (2) There
is a difference in the levels of the instrument scores
among hospitals. (3) There is no difference between the
scores of participants with a high school diploma and those with higher education. (4) There is no difference in participants’ scores according to the time of experience.
We consider the following variables in the division of the
groups: gender, education, hospitals and work experience. We conirmed all hypotheses, since the perception of the safety climate did not depend on the professionals’
gender and level of training. A difference between
perceptions of safety climate was expected, though,
according to the hospital and length of experience. It
is natural that the professionals’ perception of safety
climate differs among hospitals, and also according to
the professionals’ experience, since it is assumed that
professionals with less time at the unit tend to evaluate
the institution that had just admitted them positively. The intercorrelation factor of the customized version
of the SAQ for Brazil was moderate to strong. The
correlation of each domain with the total ranged from
0.70 to 0.78, except for the domain of Stress Recognition,
which showed negative correlations and a low item-total
Carvalho REFL, Cassiani SHB. 581
Discussion
With regard to the reliability analysis, our results
showed that the version adapted to Portuguese presented
a total Cronbach’s alpha of 0.89. This ratio ranged from
0.65 to 0.79 among the areas. Similar values were
obtained in other validation studies of the SAQ in Norway,
where Cronbach’s alpha ranged from 0.68 to 0.85; in China, where the coeficient igured between 0.79 and 0.9; in Switzerland, between 0.72 and 0.89; and in the
U.S., between 0.65 and 0.88(10-13). According to literature, these values show acceptable internal consistency among
the instrument items(14).
The areas Teamwork Climate (alpha 0.65), Safety
Climate (alpha 0.67) and Working Conditions (alpha 0.65), however, presented Cronbach’s alpha coeficients below 0.70, indicating low correlation among items. A sample
size similar to ours (1306 professionals) most closely
approached the internal consistency levels found in the SAQ version adapted to Brazil, with alpha coeficients of 0.68 and 0.71 for Teamwork Climate and Working
Conditions, respectively(10).
Cronbach’s alpha is a coeficient we rely on to conirm the instrument’s reliability. Only the repeated use of the instrument in different samples can indicate its
validity and reliability though. Only a scale that repeatedly
generates reliable data can be considered reliable with
greater certainty(15).
Moderate to strong correlation between domains was
observed for the adapted version of the SAQ. The
item-total correlation ranged between 0.70 and 0.78, except
in the domain of Stress Recognition, which showed low correlation coeficients. These results have also been identiied by the authors of the questionnaire(3) and for the version of the instrument translated and validated for
Sweden(12). This negative correlation is expected because, the higher the perceived stress, the lower the total score
of the questionnaire should be.
Item-domain correlation analysis showed mostly positive and signiicant moderate to strong coeficients, except for the reverse questions 2 and 11. When removed,
these questions increase the Cronbach’s alpha of their
respective domains, Teamwork Climate (alpha 0.69) and
Safety Climate (alpha 0.68).
As the authors conducted exploratory factor analysis,
this did not have to be repeated in this study. However, as questions 14 and 33 to 36 were added after the tests the authors conducted, exploratory analysis was necessary
to identify in what areas these questions would obtain a better correlation coeficient. Item 14 was allocated to the domain Perception of Management of the Hospital
and items 33 to 35, which had not been allocated to any
domain either, were allocated to a unique component,
with the suggested name Safe Behavior/ Safe Practices. Question 14, which does not belong to any domain, will be included in the domain Perception of Management in the
SAQ version adapted to Portuguese.
Conirmatory factor analysis, adjusting the inal 41-item model, was generally satisfactory and similar to the
results found by the instrument authors(3), and for the versions adapted for Norway(10) and China(11).
Conclusion
The SAQ Brazilian version is the irst valid and reliable instrument in Portuguese able to assess the safety
climate in healthcare institutions. Based on this study,
further research can be developed in Brazil to identify the
patient safety climate in various hospital sectors, offering
new perspectives to discuss this issue and pursue a better
quality of health care delivery.
References
1. Colla JB, Bracken AC, Kinney LM, Weeks WB. Measuring
patient safety climate: a review of surveys. Qual Safety Health Care. 2005;14(5):364-6.
2. Pronovost P, Sexton B. Assessing safety culture:
guidelines and recommendations. Qual Safety Health
Care. 2005;14(4):231-3.
3. Sexton JB, Helmreich RL, Neilands TB, Rowan K, Vella
K, Boyden J, et al. The Safety Attitudes Questionnaire:
psychometric properties, benchmarking data, and
emerging research. BMC Health Serv Res. 2006; 44(6):1-10.
4. Thomas EJ, Sexton JB, Helmreich RL. Discrepant attitudes about teamwork among critical care nurses and
physicians. Crit Care Med. 2003;31(3):956-9.
5. Hughes-Hammer C, Martsolf D, Zoller R. Development
and testing of the codependency assessment tool. Arch Psychiatr Nurs. 1998;12(5):264-72.
6. Beaton D, Bombardier C, Guillemin F, Ferraz M B.
Recommendations for the cross-cultural adaptation of
health status measures. American Academy of Orthopedic Surgeons Institute for Work & Health. 2002. [acesso 14 abr 2009]. Disponível em: http://www.dash.iwh.on.ca/ assets/images/pdfs/xculture2002.pdf.
7. Pasquali L. Psicometria - Teoria dos testes na psicologia
e na educação. 3ed. Rio de Janeiro: Vozes; 2003. 397 p.
8. Tabachnick BG, Fidell L S. Using Multivariate Statistics.
5th ed. Boston: Allyn and Bacon; 2007. 1008 p.
9. Cohen J, Cohen P. Applied multiple regression
10. Deilkas ET, Hofoss D. Psychometric properties of the
Norwegian version of the Safety Attitudes Questionnaire
(SAQ), Generic Version (Short Form 2006). BMC Health
Serv Res. 2008;22(8):191.
11. Lee WC, Wung HY, Liao HH, Lo CM, Chang FL, Wang
PA, et al. Hospital safety culture in Taiwan: a nationwide
survey using Chinese version safety attitude questionnaire. BMC Health Serv Res. 2010;10(10):234.
12. Nordén-Hägg A, Sexton JB, Kälvemark-Sporrong
S, Ring L, Kettis-Lindblad A. Assessing Safety Culture in
Pharmacies: The psychometric validation of the Safety
Attitudes Questionnaire (SAQ) in a national sample of
community pharmacies in Sweden. Clin Pharmacol.
2010;10(8):1-12.
13. Patterson PD, Huang DT, Fairbanks RJ, Wang HE.
The Emergency Medical Services Safety Attitudes
Questionnaire. Am J Med Qual. 2001;25(2):109-15. 14. Terwee CB, Bot SD, de Boer MR, van der Windt DA, Knol DL, Dekker J, Bouter LM, et al. Quality criteria were
proposed for measurement properties of health status questionnaires. J Clin Epidemiol. 2007;60(1):34-4. 15. Maroco J, Garcia-Marques T. Qual a iabilidade do alfa de Cronbach? Questões antigas e soluções modernas?Lab Psicol. 2006;4(1):65-90.