Universidade de Lisboa
Faculdade de Farmácia
Validation of tacrolimus UHPLC method and its phase
solubility studies with β-cyclodextrin and its derivates
Ana Teresa Ferreira Nakov
Mestrado Integrado em Ciências Farmacêuticas
Universidade de Lisboa
Faculdade de Farmácia
Validation of tacrolimus UHPLC method and its phase
solubility studies with β-cyclodextrin and its derivates
Ana Teresa Ferreira Nakov
Monografia de Mestrado Integrado em Ciências Farmacêuticas apresentada à Faculdade de Farmácia da Universidade de Lisboa
Orientador: Professor Doutor Þorsteinn Loftsson Co-orientador: Professora Doutora Helena Cabral Marques
(Professora Associada c/ Agregação)
The work accomplished on this monograph was possible thanks to the
Faculty of Pharmaceutical Sciences of the University of Iceland,
I dedicate this project to all those who have been with me and helped me with love, strength, motivation and wisdom on this wonderful journey.
A big thank you to my parents Sílvia and Krassimir, who gave me all the love and support I needed, especially my mom that made great efforts to make all this possible.
My siblings Catarina and Miguel enlightened me and motivated me to finish this and show them that we can achieve our dreams with work and persistence.
I appreciate all the help my grandparents gave me in the process and I dedicate this with all my heart to my grandfather Isidro who is now watching me from heaven.
My uncles Dulce and Vítor have also played a very important role in the last 5 years. I see my aunt as a second mom and there are no words to describe how grateful I am. To my godmother Susana, a big thank you for making my time in Iceland so amazing, full of love and great experiences. I have now a portuguese family there.
This work was done in collaboration with Beatriz Alves under the mentorship of Manisha Prajapati and professor Þorsteinn Loftsson, who guided us and gave the necessary help in the development of this project.
All of this was possible thanks to professor Helena Marques who helped me from the beginning to make my Icelandic dream come true. And I will be grateful forever.
6
RESUMO
O Tacrolimus (FK-506) é um fármaco imunossupressor amplamente utilizado na profilaxia contra a rejeição de órgãos em doentes transplantados. Formulações parentéricas, orais e tópicas têm sido alvo de investigação científica a fim de prevenir a rejeição de aloenxertos e de tratar doenças do foro imunitário, como a dermatite atópica e a conjuntivite alérgica grave. Um dos grandes desafios relativos a este fármaco é a sua reduzida solubilidade em água. Uma possível abordagem para superar essa limitação é a complexação com ciclodextrinas.
O objetivo deste projeto é validar um método de Cromatografia Líquida de Ultra Alta Performance (UHPLC) que seja rápido, simples e versátil o suficiente para detetar e quantificar o FK-506. De seguida, esta técnica analítica será utilizada num estudo de solubilidade de fase. A formação de complexos de FK-506 com a β-CyD e com alguns dos seus derivados (HP-β-CyD e SBE-β-CyD), em solução aquosa, e o efeito solubilizante dessas CyDs na taxa de dissolução deste fármaco foram avaliados. Através da análise dos diagramas de solubilidade de fase, assim como da constante de estabilidade e da eficiência de complexação foi possível compreender como cada uma das CyD em estudo influenciam a solubilidade do FK-506 em água.
Para a validação do método UHPLC, a seletividade, linearidade e intervalo, limite de deteção e limite de quantificação, exatidão, repetibilidade e precisão intermediária foram avaliadas. Foi possível detetar e quantificar o FK-506 sem interferência de outros componentes. Esta técnica analítica demonstrou ter uma elevada sensibilidade, boa seletividade, exatidão e precisão, o que a torna adequada para análises de controlo de qualidade de formulações contendo este fármaco.
De acordo com os diagramas de solubilidade de fase definidos por Higuchi e Connors, dois tipos diferentes de perfis foram observados: os sistemas β-CyD e HP-β-CyD exibiram uma curva de solubilidade de fase do tipo AP, enquanto o sistema SBE-β-CyD apresentou
uma curva do tipo BS. A β-CyD apresentou uma capacidade de solubilização superior, com
uma maior formação de complexos estáveis 1:1 FK-506/β-CyD, apresentando melhor afinidade para o FK-506.
7
ABSTRACT
Tacrolimus (FK-506) is a potent immunosuppressive drug who has been widely used in prophylaxis against organ rejection. Parenteral, oral and topical formulations have been developed in order to prevent allograft rejection and to treat immune diseases, such as atopic dermatitis and severe conjunctival allergic diseases. One of the biggest challenges handling this drug is its very low water solubility. One of the possible approaches to overcome this limitation is the use of CyD drug complexation technique.
The aim of this work is to validate a UHPLC method that could be fast, simple and versatile enough for the detection and quantification of FK-506. Then, this analytical technique will be used to perform a phase solubility study. The complex formation of tacrolimus with β-CyD and some of its derivates (HP-β-CyD and SBE-β-CyD) in aqueous solution and the solubilizing effect of these CyDs on FK-506 dissolution rate were evaluated. Through the analysis of the phase solubility diagrams, as well as the stability constants and the complexation efficiency, it was possible to understand how each CyD influence FK-506 solubility in water.
For the validation of the UHPLC method, the selectivity, linearity and range, limit of detection and limit of quantification, accuracy, repeatability and intermediate precision were analysed. It was possible to detect and quantify FK-506 without interference from other components. This analytical technique demonstrated to have a high sensitivity, good selectivity, accuracy and precision, which makes it suitable for quality control analysis of complex pharmaceutical preparations containing tacrolimus and its impurities.
According to phase solubility diagrams defined by Higuchi and Connors, two different types of profiles were noted: the β-CyD and HP-β-CyD systems exhibited an AP type phase
solubility curve while the SBE-β-CyD system presented a BS type phase solubility curve.
β-CyD has the greatest solubilizing ability with a higher formation of 1:1 FK-506/β-β-CyD stable complexes. The affinity of FK-506 to this natural CyD is the best when compared to HP-β-CyD and SBE-β-HP-β-CyD.
8
CONTENTS
FIGURES ... 9 TABLES ... 9 ABREVIATIONS ... 10 1. INTRODUCTION ... 112. MATERIALS AND METHODS ... 14
2.1. Materials ... 14
2.2. UHPLC method ... 14
2.3. Working solutions ... 15
2.3.1. Stock standard solution ... 15
2.3.2. 5% HP- β-CyD solution ... 15
2.3.3. CyD solutions for phase solubility studies ... 15
2.4. Determination of water content ... 16
2.5. Validation of tacrolimus UHPLC method ... 16
2.6. Stability study of FK-506 in aqueous CyD solutions ... 19
2.7. Phase solubility studies ... 19
2.7.1. Theoretical background ... 20
3. RESULTS AND DISCUSSION ... 21
3.1. Validation of tacrolimus UHPLC method ... 21
3.2. Stability study of FK-506 in aqueous CyD solutions ... 25
3.3. Phase solubility studies ... 25
4. CONCLUSION ... 29
9
FIGURES
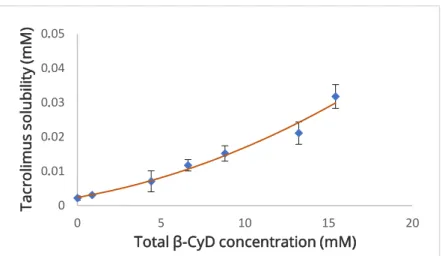
Figure 1.1 Molecular structure of FK-506 ... 11 Figure 1.2 Molecular structure of β-CyD ... 13 Figure 3.1 Selectivity parameter of tacrolimus UHPLC method ... 21 Figure 3.2 Phase solubility diagram of FK-506/β-CyD system in water at 24 ºC. Each point
represents the average of 3 experiments and the respective SD ... 26
Figure 3.3 Phase solubility diagram of FK-506/HP-β-CyD system in water at 24 ºC. Each
point represents the average of 3 experiments and the respective SD ... 26
Figure 3.4 Phase solubility diagram of FK-506/SBE-β-CyD system in water at 24 ºC. Each
point represents the average of 3 experiments and the respective SD ... 26
TABLES
Table 2.1 CyD aqueous solutions concentrations at 25 ºC ... 16 Table 2.2 FK-506 calibration curve in the range 10-200% ... 17 Table 2.3 Accuracy essay groundwork at 3 concentration levels covering the range of 50%
to 150% from nominal FK-506 standard concentration 10 µg/mL ... 18
Table 3.1 Linearity from standard solutions in the range 10-200% of the FK-506 nominal
standard concentration 10 µg/mL ... 22
Table 3.2 Accuracy at three concentration levels (50%, 100%, 150%) from nominal FK-506
standard concentration 10 µg/mL ... 23
Table 3.3 Repeatability of tacrolimus UHPLC method by 8 replicate samples from nominal
FK-506 standard concentration 10 µg/mL (Day 1) ... 23
Table 3.4 Intermediate precision of tacrolimus UHPLC method using 16 replicate samples
from nominal FK-506 standard concentration 10 µg/mL ... 24
Table 3.5 Stability study of FK-506 in 5% HP-β-CyD aqueous solution at 24 ºC ... 25 Table 3.6 Solubility parameters of FK-506/CyD complexes in the water at 24 ºC ... 27
10
ABBREVIATIONS
ACN – Acetonitrile
AKC – Atopic keratoconjunctivitis
CyD – Cyclodextrin
FK-506 – Tacrolimus
FKB12 – FK506 binding protein 12
HP-β-CyD – 2-hydroxypropyl-β-cyclodextrin
HPLC – High-Performance Liquid Chromatography
LOD – Limit of detection
LOQ – Limit of quantification
MW – Molecular weight
SBE-β-CyD – Sulfobutylether-β-cyclodextrin SD – Standard deviation
TFA – Trifluoroacetic acid
UHPLC – Ultra-High-Performance Liquid Chromatography
11
1. INTRODUCTION
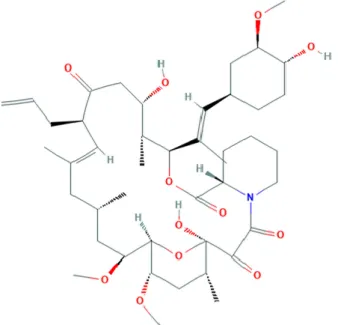
Tacrolimus (Figure 1.1), also known as FK-506, is a potent immunosuppressive drug obtained from Streptomyces tsukubaensis (molecular weight of 804.018 g/mol) who has been widely used in prophylaxis against organ rejection, especially after liver and renal transplantation (1–3). In spite of being structurally unrelated to cyclosporine A, FK506 has similar cellular effects to this drug. Tacrolimus binds to immunophilin FKBP12, forming a complex that inhibits the phosphatase activity of calcineurin. This leads to an inactivation of the interleukin-2 gene transcription, decreasing the proliferation of helper T-cells, which has a vital role in the immune response of allograft rejection (4,5).
However, the clinical use of FK-506 can be difficult since it has a narrow therapeutic index (5 – 15 ng/ml) and a poor oral bioavailability (mean value of 25%) with high intra- and interindividual variability in the pharmacokinetic profile (3). Therefore, excessive doses of this drug may lead to characteristic adverse effects of an immunosuppressive regimen; but, in the case of FK506, nephrotoxicity, neurotoxicity and diabetes mellitus stand out. On the other hand, a sub-therapeutic level may lead to acute allograft rejection (3,4).
Figure 1.1 Molecular structure of FK-506 (1).
FK-506 topical preparations are an alternative to corticosteroid use and avoid the side-effects of systemic therapy (6). Studies have shown that tacrolimus topical formulations are effective in treating atopic dermatitis and severe allergic
12
conjunctival diseases, such as AKC and VKC (7,8). In patients who didn’t respond well to topical cyclosporine therapy, FK-506 inhibition of calcineurin was shown to be 100 times more effective (8). The use of tacrolimus ophthalmic eye drops to treat severe keratoconjunctivitis sicca and to prevent corneal allograft rejection is still being investigated (6,9). One of the biggest challenges in handling FK-506 is its very low water solubility (4-12 μg/ml). In order to overcome this limitation, several delivery systems, such as oily solution, complexation with CyDs, liposomes, nanocapsules, among others, have been studied (3).
Cyclodextrins (CyD) are cyclic oligosaccharides made of (α-1,4)-linked D -glucopyranose units. They are widely used in pharmaceutical, cosmetic and food industries as well as in numerous analytical procedures. Their capacity to form inclusion complexes with lipophilic drugs as guests make them good solubilizing agents since they enhance the water solubility of the drug. Complexation with CyD also increases drug permeation through biological membranes, improving the drug bioavailability (10). The most common natural CyDs are α-CyD, β-CyD and γ-CyD, with 6, 7 and 8 units of glucopyranose, respectively. However, they have low solubility in water which limits their practical use. Therefore, some alternatives such as methylated, hydroxypropylated, and sulfobutyl ether CyD derivatives have been developed in an attempt to solve the problem (11–13).
β-CyD (MW of 1135 g/mol) is the most commonly used (Figure 1.2) to complex medium-sized molecules, as is the case with the majority of drugs (14). Due to its low aqueous solubility, the drug/β-CyD complexes are more likely to precipitate (15). This would cause toxicity in the case of parenteral administration, so β-CyD is only used for oral and topical formulations. Derivates of β-CyD, such as HP-β-CyD (MW of 1400 g/mol) and SBE-β-CyD (MW of 2163 g/mol), were designed to have greater water solubility. They are at least 27 times more water-soluble than the natural CyD, which allows their use in parenteral formulations (12).
Studies have been done regarding β-CyD and its derivates, not only about their capacity to enhance the chemical stability of drugs (14–17) but also concerning the identification and development of analytical techniques (18,19). There are 5 studies who show CyDs improve FK-506 pharmaceutical characteristics such as solubility, stability and bioavailability (2,20–23).
13
Figure 1.2 Molecular structure of β-CyD (24).
High-Performance Liquid Chromatography (HPLC) is one of the most used analytical technique in drug research and development. Compared to traditional HPLC, Ultra-High-Performance Liquid Chromatography (UHPLC) has high pressure and small sized particles (less than 2 µm) in the column. That decreases the length of the column leading to time-saving, reduction in the solvent consumption and associated costs. This improvement in chromatography performance increases the speed, sensitivity and resolution in drug detection, which makes this technology a highly efficient method in analytical chemistry (25).
Thus, the aim of this work was to validate a UHPLC method that could be fast, simple and versatile enough for the detection and quantification of tacrolimus. Then, this analytical technique was used to perform a phase solubility study. The complex formation of FK-506 with β-CyD and some of its derivates (HP-β-CyD and SBE-β-CyD) in aqueous solution and the solubilizing effect of these CyDs on FK-506 dissolution rate were evaluated. Analysing the complexation of CyDs with poorly soluble drugs in water is helpful and convenient because it is possible to understand how CyDs can influence drug solubility. Through the analysis of solubility curves, it is possible to calculate the stability constant of the complexes as well as their complexation efficiency.
14
2. MATERIALS AND METHODS
2.1. Materials
FK-506 and TFA were purchased from Sigma–Aldrich (St. Louis, MO, USA). β-CyD, HP-β-CyD and SBE-β-CyD were provided by Janssen Pharmaceutical (Beerse, Belgium).
ACN and methanol were purchased from Honeywell (Charlotte, North Carolina, US). Milli-Q water from Millipore (Billerica, MA, USA) was used to prepare all solutions and the mobile phase for UHPLC measurements. All other chemicals used in this project were of analytical reagent grade.
2.2. UHPLC method
A reverse-phase, Ultra-High-Performance Liquid Chromatography (UHPLC) Ultimate 3000 series system from Dionex Softron GmbH (Germering, Germany) was used to do a quantitative determination of tacrolimus. This equipment is composed by a LPG-3400SD pump with an integrated vacuum degasser, a WPS-3000 autosampler (Dionex, Germering, Germany), a TCC-3100 column compartment (Dionex, Germering, Germany), and a CoronaR ultra RS detector (Dionex, Germering, Germany). The mobile phase consisted of a mixture of ACN and 0.1% TFA aqueous solution (60:40, v/v) with a flow rate of 0.4 mL/min and a working temperature of 50 ºC. Before being used, all the solutions, including the cleaning one, were placed in a CPX5800H-E ultrasonic bath from Branson Ultrasonic SA (Carouge, Switzerland) at 25 ºC for 90 minutes. The integrated degasser on UHPLC equipment allowed the continuous degassing of the mobile phase (26). For the cleaning step a 10% methanol-water solution (10:90, v/v) was used. A Phenomenex Kinetex C18 150 x 4.60 mm 5 µm column with a corresponding HPLC Security Guard (Phenomenex, Cheshire, UK) were used throughout the stationary phase. The UV detector was regulated for 205 nm, the injection volume was 25 µL and retention time was 3.3 minutes. The software ChromeleonR version 7.2 SR4 (Thermo Scientific, Waltham, MA, USA) was used for the data analysis (19,27).
15
2.3. Working Solutions
2.3.1. Stock standard solution
The stock standard solution (SSS) preparation consisted of dissolving 2.5 mg of tacrolimus in 25 mL of methanol to obtain a known concentration solution of 100 µg/mL. A MS105 analytical balance from Mettler-Toledo (Grenfeisee, Switzerland) was used for FK-506 measurements.
2.3.2. 5% (w/v) HP-β-CyD solution
Considering the water content, 1.314 g of HP-β-CyD powder was measured and added to a 25 mL volumetric flask, in order to get an aqueous solution with a final concentration of 5% (w/v) HP-β-CyD. After a manual shake, the solution was placed in the ultrasonic bath for 30 minutes at 25 ºC to ensure dissolution of all CyD in water and to degas the solution.
2.3.3. CyD solutions for phase solubility studies
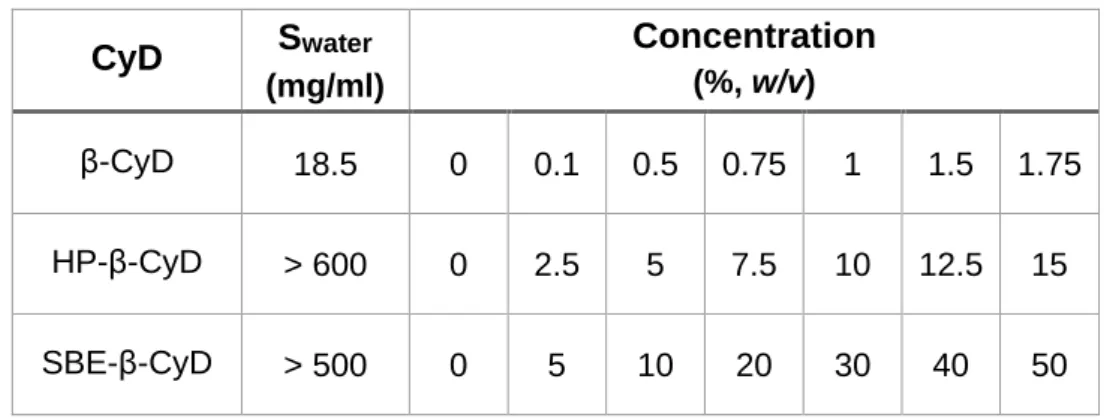
The required amounts of each CyD (β-CyD, HP-β-CyD, SBE-β-CyD) were measured in a PJ360 DeltaRange® laboratory balance from Mettler-Toledo (Grenfeisee, Switzerland) to prepare the various CyD solutions in the water at different concentrations (Table 2.1). The calculations took into account the water content in the CyD powder. The concentration ranges of each CyD were calculated based on each CyD solubility in water at 25 ºC (Swater) (12).
Table 2.1 CyD aqueous solutions concentrations at 25 ºC.
CyD Swater (mg/ml) Concentration (%, w/v) β-CyD 18.5 0 0.1 0.5 0.75 1 1.5 1.75 HP-β-CyD > 600 0 2.5 5 7.5 10 12.5 15 SBE-β-CyD > 500 0 5 10 20 30 40 50
16
The measured powders were placed in 25 mL volumetric flasks and filled with water. The solutions were manually shaken and then placed for 20 - 45 min in the ultrasonic bath at 25 ºC until complete dissolution was achieved. The β-CyD solutions with the concentrations 1.5 and 1.75 % needed to be heated in an Analog Stirrer Hotplate ASHC–301 from A&E Lab (London, United Kingdom) in order to increase its solubility in water (12). After complete dissolution, both solutions went into the ultrasonic bath at 25 ºC for 20 min.
2.4. Determination of water content
The water content of β-CyD, HP-β-CyD and SBE-β-CyD powders was estimated by an A&D MX-50 moisture analyser (A&D Company, Limited, Tokyo, Japan). The samples (approx. 1 g) were carefully and evenly spread over the aluminium pans to avoid its uneven drying. The determination of water content was made in triplicate and presented on average (%) ± standard deviation. The results were 10.39 ± 0.10 %, 5.12 ± 0.07 % and 6.82 ± 0.21 % for β-CyD, HP-β-CyD and SBE-β-CyD, respectively.
2.5. Validation of the UHPLC method
The validation of the UHPLC method for the determination of tacrolimus was performed according to the Q2(R1) guidelines from the International Conference on Harmonization Guidelines. (28) The validated parameters were selectivity, linearity and range, limit of detection (LOD) and limit of quantification (LOQ), accuracy, repeatability and intermediate precision.
a) Selectivity: The chromatographic peaks of mobile phase solutions, solvents, excipients were analysed to guarantee they didn't interfere with the FK-506 peak. The purity of FK-506 peak was also estimated.
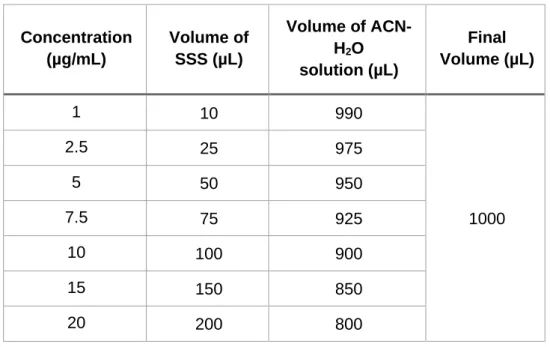
b) Linearity and range: Standard solutions covering the range between 10 – 200% of the nominal standard concentration (10 µg/mL) were used to evaluate the linearity and range. The seven solutions of FK-506 with different
17
concentrations (1, 2.5, 5, 7.5, 10, 15 and 20 µg/mL) were prepared by diluting different volumes of the 100 µg/mL FK-506 stock standard solution using an ACN-H2O solution (1:1, v/v) as the solvent (Table 2). This essay was made in triplicate.
Table 2.2 FK-506 calibration curve in the range 10-200%.
Concentration (µg/mL) Volume of SSS (µL) Volume of ACN-H2O solution (µL) Final Volume (µL) 1 10 990 1000 2.5 25 975 5 50 950 7.5 75 925 10 100 900 15 150 850 20 200 800
c) Limit of Detection (LOD) and Limit of Quantification (LOQ): These parameters were obtained from the linearity test using the equations below.
LOQ =Standard Deviation
Slope ∗ 10 (1)
LOD =Standard Deviation
Slope ∗ 3,3 (2)
The standard deviation of response was calculated by the standard error of y-intercepts of the regression line (n=7) (28).
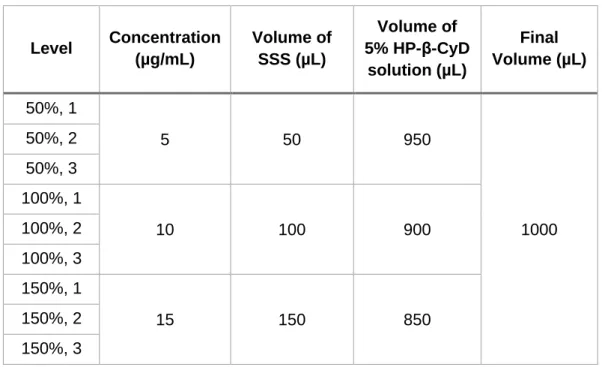
d) Accuracy: The percentage of recovery was performed through samples which were prepared in triplicate at 3 different concentration levels with a specified range (50% to 150%) of FK-506 nominal standard concentration (10 µg/mL). Three vials were filled with 5% HP-β-CyD solution (w/v) and FK-506 stock standard solution (100 µg/mL) to a final volume of 1 mL (Table
18
3). Then, the percentage of recovery (the difference between theoretical and real concentration) was determined. The results at each concentration need to be 100 ± 2% to be accepted (28).
Table 2.3 Accuracy essay groundwork at 3 concentration levels covering the
range of 50% to 150% from FK-506 nominal standard concentration 10 µg/mL. Level Concentration (µg/mL) Volume of SSS(µL) Volume of 5% HP-β-CyD solution (µL) Final Volume (µL) 50%, 1 5 50 950 1000 50%, 2 50%, 3 100%, 1 10 100 900 100%, 2 100%, 3 150%, 1 15 150 850 150%, 2 150%, 3
e) Repeatability: This parameter, known as intra-day assay precision, evaluates the variability of the assay and should be performed using at least six determinations at 100% of the test concentration (28). To determine the repeatability of the method, 8 replicate samples of FK-506 at the same concentration (10 µg/mL) in a solution of ACN-H2O (1:1, v/v) were analysed, during the same day and under the same experimental conditions. The results were expressed in relative standard deviation (%RSD), which has to be RSD ≤ 1% (29).
f) Intermediate Precision: This test was performed by 2 different analysts in different days, expressing the intra-laboratory variation. To determine this parameter, each analyst prepared 8 replicate samples of FK-506 at concentration 10 µg/mL in a solution of ACN-H2O (1:1, v/v) – day 2. The results obtain by analyst 1 in repeatability essay were performed 24h before
19
and used to intermediate precision calculations – day 1. The inter-day assay precision was expressed as %RSD and it needed to be RSD ≤ 2% (29).
2.6. Stability study of FK-506 in aqueous CyD solution
To test the stability of FK-506 in CyD solution during 1 and 7 days, 2 mg of tacrolimus were added in 6 rubber-cap vials containing 5 mL of 5% (w/v) HP-β-CyD solution. The mixtures were placed in the ultrasonic bath at 25 ºC for 90 minutes and, then, the pH was measured in an Orion 3 Star Benchtop pH Meter from Thermo Fisher Scientific (Waltham, MA, USA) and adjusted to 5 ± 0.5. All the samples were left on a KS 15 A Compact Shaker from Edmund Bühler GmbH (Bodelshausen, Germany), at room temperature (about 24 ºC). Three of them were shaken for 24h and the other three for 7 days. After that time, the pH was checked again and readjusted if the change in pH was observed. Each mixture was filtered using a 0.45 µm regenerated cellulose (RC) membrane syringe filter from Phenomenex (Cheshire, UK). Two samples (1 mL) of each collected solution with appropriate dilution were placed in the UHPLC vials and the amount of FK-506 was measured.
2.7. Phase solubility studies
Excess of FK-506 (approx. 2 mg) was added in the rubber-cap vials containing 5 mL of increasing concentrations of CyD (β-CyD, HP-β-CyD, SBE-β-CyD) aqueous solutions (Table 1). After 90 minutes of sonication at 25 ºC, the pH of each mixture was adjusted to 5 ± 0.5 by adding concentrated solutions of 0.1 N HCl and 0.1 N NaOH. The vials were shaken for 24 hours at room temperature until equilibrium was established. The pH was checked again and each mixture was filtered using a 0.45 µm RC membrane filter. The filtrate was collected as a sample solution. The amount of FK-506 in each solution was measured using the tacrolimus UHPLC method, validated above, at 205 nm. This assay was performed in triplicate.
The phase solubility diagrams were designed to indicate the FK-506 apparent water solubility as a function of CyD concentration, according to the method reported by Higuchi and Connors (30). The affinity of FK-506 for different CyDs was compared
20
using the values of the stability constant (K1:1) and the complexation efficiency (CE) (12,13,30).
2.7.1. Theoretical Background
Higuchi and Connors (1965) described A-type phase solubility profiles, which are usually related to water-soluble CyD derivates, and B type phase solubility profiles, associated with less soluble natural CyD. In the first case, the solubility of the drug is better the higher the CyD concentration and there is the formation of water-soluble drug/CyD complexes. On the other hand, in B type phase solubility profiles, the complexes will often have limited solubility in water, showing a plateau where the dissolved drug concentration is maximum, followed by a decrease in the total concentration of the drug (12,30).
The 1:1 D/CyD complex is the most common, where one drug (D) molecule forms a complex with one CyD molecule:
𝐷 + 𝐶𝑦𝐷 𝐾↔ 𝐷/𝐶𝑦𝐷 1:1 (3)
This event is related to an AL type phase solubility diagram. The stability constant of the complex (K1:1) can be calculated with equation 4, where S0 is the apparent intrinsic solubility of the drug when no CyD is present. The value of K1:1 is frequently between 50 – 2000 M-1 with a reported mean value of 490 M-1 for β-CyD (12,31).
𝐾1:1 = 𝑆𝑙𝑜𝑝𝑒
𝑆0 (1 − 𝑆𝑙𝑜𝑝𝑒) (4)
If a drug molecule forms a complex with more than one CyD, a consecutive complexation is assumed, thus stability constants of higher-order complexes (K1:n) should be calculated with a different model (13). The most common stoichiometry is the formation of 1:2 D/CyD complexes, where one drug molecule forms a complex with two CyD:
D/CyD + CyD K↔ D/(CyD)1:2 2 (5)
Under such conditions, an AP type phase solubility diagram will be the most expected. Equation 6, which is based on a quadratic model, allows the estimation of
21
both stability constants (K1:1 and K1:2). The value of K1:2 is often in the range 10 to 500 M-1 or it’s significantly lower than the value of K1:1 (12,13).
[𝑆𝑡] = [𝑆0] + 𝐾1:1 [𝑆0] [CyD] + 𝐾1:1 𝐾1:2 [𝑆0] [CyD]2 (6)
Once the determination of K1:1 value is strongly affected by the accuracy of the intercept, the determination of the complexation efficiency (CE) can be a better alternative to compare the solubilizing effect of CyD. The CE determination (equation 7) has less variation because it can be calculated only with the slope of the phase solubility curve (13,31,32).
𝐶𝐸 = [𝑆0] 𝐾1:1 = [𝐷/𝐶𝑦𝐷]
[𝐶𝑦𝐷] = 𝑆𝑙𝑜𝑝𝑒
1−𝑆𝑙𝑜𝑝𝑒 (7)
3. RESULTS AND DISCUSSION
3.1. Validation of the UHPLC method
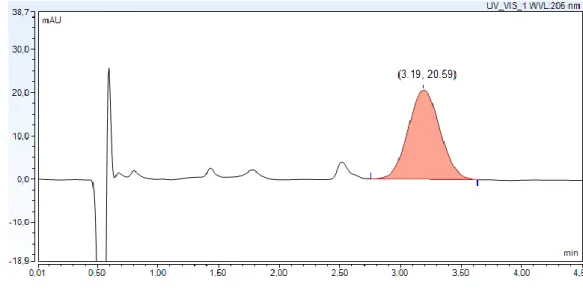
a) Selectivity: The chromatogram (Figure 3.1) showed that there is no interference of solvent, mobile phase and excipients with tacrolimus peak. The purity of FK-506 peak was 97.7%. Thus, this method is selective since it was possible to detect FK-506 without interference from other components.
22
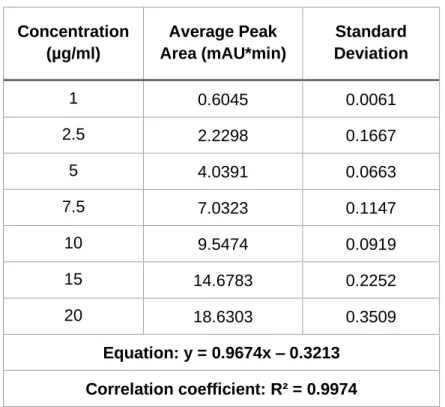
b) Linearity and range: The linearity between peak area and the individual tacrolimus concentrations was analysed (Table 3.1). Results had shown the method is linear for FK-506 over the specified range (10-200%, w/v) with a correlation factor of 0.9974.
Table 3.1 Linearity from standard solutions in the range 10-200% of the
FK-506 nominal standard concentration 10 µg/mL.
Concentration (µg/ml) Average Peak Area (mAU*min) Standard Deviation 1 0.6045 0.0061 2.5 2.2298 0.1667 5 4.0391 0.0663 7.5 7.0323 0.1147 10 9.5474 0.0919 15 14.6783 0.2252 20 18.6303 0.3509 Equation: y = 0.9674x – 0.3213 Correlation coefficient: R² = 0.9974
c) Limit of Detection (LOD) and Limit of Quantification (LOQ): The standard error of y-intercepts of the regression line (0.2385) was used to calculate the standard deviation of response (0.6309). The LOD and LOQ were 2.15 µg/mL and 6.52 µg/mL. The %RSD of the seven solutions of tacrolimus used to validate these values was 2.31%, which is in the acceptable range for this data (RSD < 4.51%).
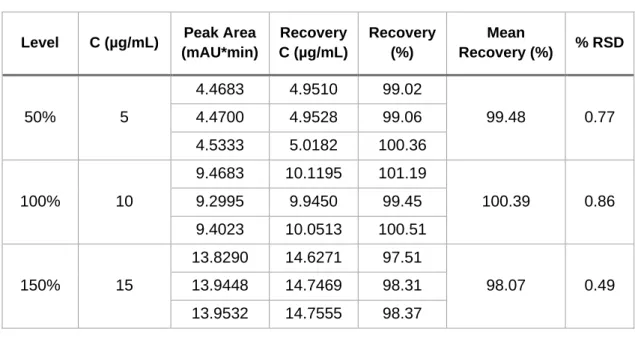
d) Accuracy: The percentage of recovery was calculated and results are presented in Table 3.2. The mean recovery was 99.48% for 5 µg/mL, 100.39% for 10 µg/mL and 98.07% for 15 µg/mL. These values were within the desired recovery range (100 ± 2%) which prove this method is accurate.
23
Table 3.2 Accuracy at three concentration levels (50%, 100%, 150%) from
nominal FK-506 standard concentration 10 µg/mL.
Level C (µg/mL) Peak Area (mAU*min) Recovery C (µg/mL) Recovery (%) Mean Recovery (%) % RSD 50% 5 4.4683 4.9510 99.02 99.48 0.77 4.4700 4.9528 99.06 4.5333 5.0182 100.36 100% 10 9.4683 10.1195 101.19 100.39 0.86 9.2995 9.9450 99.45 9.4023 10.0513 100.51 150% 15 13.8290 14.6271 97.51 98.07 0.49 13.9448 14.7469 98.31 13.9532 14.7555 98.37
e) Repeatability: This test was performed with 8 replicate samples of FK-506 at the same concentration (10 µg/mL) and results are showed in Table 3.3. The RSD value (0.17%) was less than 1%, which showed a good intra-day essay precision.
Table 3.3 Repeatability of tacrolimus UHPLC method by 8 replicate
samples from nominal FK-506 standard concentration 10 µg/mL (Day 1).
Day 1
Sample Peak Area
(mAU*min) Concentration (µg/mL) 1 8.9191 9.5518 2 8.9230 9.5558 3 8.9595 9.5935 4 8.9518 9.5856 5 8.9594 9.5934 6 8.9339 9.5671 7 8.9341 9.5673 8 8.9483 9.5820 Average 9.5746 % RSD 0.17
24
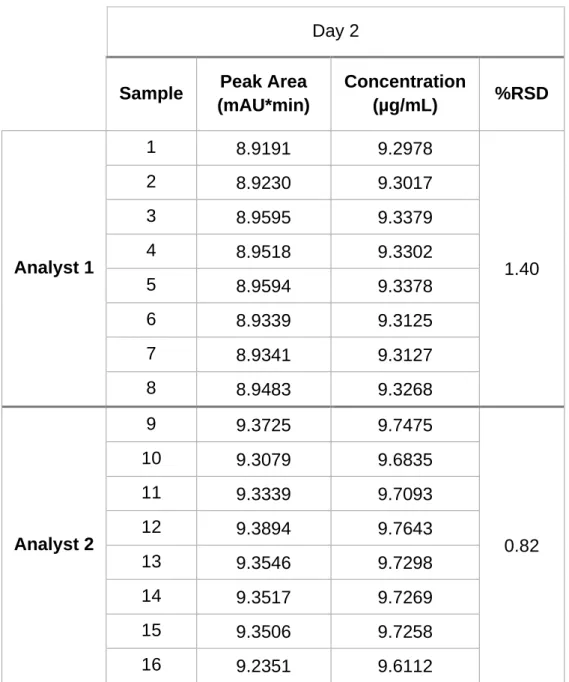
f) Intermediate Precision: The inter-day variation obtained by analyst 1 was 1.40%. The value found in the test performed with analysts 1 and 2 in day 1 and 2, respectively, was 0.83%. These results, presented in Table 3.4, reveal the good intermediate precision of this analytical method.
Table 3.4 Intermediate precision of tacrolimus UHPLC method using 16
samples from nominal FK-506 standard concentration 10 µg/mL.
Day 2
Sample Peak Area
(mAU*min) Concentration (µg/mL) %RSD Analyst 1 1 8.9191 9.2978 1.40 2 8.9230 9.3017 3 8.9595 9.3379 4 8.9518 9.3302 5 8.9594 9.3378 6 8.9339 9.3125 7 8.9341 9.3127 8 8.9483 9.3268 Analyst 2 9 9.3725 9.7475 0.82 10 9.3079 9.6835 11 9.3339 9.7093 12 9.3894 9.7643 13 9.3546 9.7298 14 9.3517 9.7269 15 9.3506 9.7258 16 9.2351 9.6112
25
3.2. Stability study of FK-506 in aqueous CyD solution
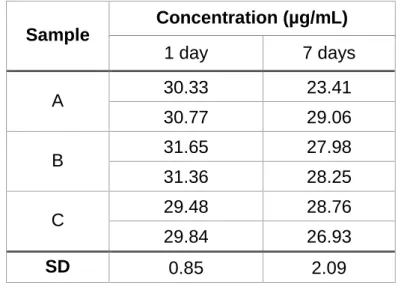
The preliminary stability study showed that FK-506 is chemically stable in aqueous HP-β-CyD solution for at least 24 hours at 24 ºC (Table 3.5). During this period of time, the results were more accurate, showing a smaller standard deviation (0.85), less than 1. In contrast, analysis of the 7-day test results showed an irregularity in the values, with a high standard deviation (2.09) and a decrease in drug concentration, which means there was a bigger degradation of FK-506 in the aqueous HP-β-CyD solution. The study was made with an aqueous HP-β-CyD solution, but an identical behaviour regarding tacrolimus stability is expected to β-CyD and SBE-β-β-CyD. Thus, all the samples were handled within 24 hours.
Table 3.5 Stability study of FK-506 in 5% HP-β-CyD aqueous solution at 24 ºC.
Sample Concentration (µg/mL) 1 day 7 days A 30.33 23.41 30.77 29.06 B 31.65 27.98 31.36 28.25 C 29.48 28.76 29.84 26.93 SD 0.85 2.09
3.3. Phase solubility studies
Regarding the type of solubility curve, the correlation coefficient squared values (r2) of the solubility linear trend lines were used to distinguish between A
L and AP types of solubility profiles. (11) The r2 values > 0.990 indicated a straight line (A
L type), and r2 values < 0.990 regarded a positively deviated curve (A
P type). Two different types of profiles were noted: the β-CyD and HP-β-CyD systems exhibited an AP type phase solubility curve, since r2 values were 0.956 and 0.987, respectively (Figure 3.2 and Figure 3.3); while the SBE-β-CyD system presented a BS type phase solubility curve, since there is a plateau region after the ascending portion, followed by a decrease in the total concentration of tacrolimus (Figure 3.4).
26
Figure 3.2 Phase solubility diagram of FK-506/β-CyD system in water at 24 ºC.
Each point represents the mean of 3 experiments and the respective SD.
Figure 3.3 Phase solubility diagram of FK-506/HP-β-CyD system in water at
24 ºC. Each point represents the mean of 3 experiments and the respective SD.
Figure 3.4 Phase solubility diagram of FK-506/SBE-β-CyD system in water at
24 ºC. Each point represents the mean of the 3 experiments and the respective SD.
0 5 10 15 20 0 0,01 0,02 0,03 0,04 0,05
Total β-CyD concentration (mM)
Ta cro limus s ol ubilit y (m M ) 0 20 40 60 80 100 0,00 0,02 0,04 0,06 0,08 0,10 0,12 0,14
Total HP-β-CyD concentration (mM)
Ta cro limus s ol ubilit y (m M ) 0 50 100 150 200 250 0,00 0,01 0,02 0,03 0,04 0,05 0,06 0,07 0,08 0,09 0,10
Total SBE-β-CD concentration (mM)
Ta cro limus s ol ubilit y (m M ) . . . . . . . . . . . . . . . . . . . . . . . .
27
The results of the apparent intrinsic solubility of FK-506 (S0), the stability constants (K1:1, K1:2) and the complexation efficiency (CE) are shown in Table 3.6. The standard deviation (SD) of K1:1 and K1:2 was significant and is, therefore, shown in the table below. The same didn’t happen for the other parameters that had a standard deviation close to zero.
Table 3.6 Solubility parameters of FK-506/CyD complexes in the water at 24 ºC. CyD S0(mg/mL) K1:1 (M-1) K1:2 (M-1) CE
β-CyD 0.0021 448 ± 137 77 ± 51 0.0009 HP-β-CyD 0.0034 252 ± 58 4 ± 1 0.0008
SBE-β-CyD 0.0047 127 ± 11 - 0.0006
The cavity of natural β-CyD seems to fit better the FK-506 molecule since its stability constant (K1:1) was the biggest. β-CyD derivatives used in this work had lower stability constants, especially SBE-β-CyD with a K1:1 value 3.5 times smaller than β-CyD. Considering its BS type phase solubility profile, in the ascending portion of the curve, complex formation occurs, however at a slower rate compared to other CyDs studied; in plateau region, the dissolved FK-506 concentration is maximum; and regarding the descending portion of the curve, the decrease of FK-506 solubility can be justified due to the contribution of the negative charge of SBE-β-CyD, which increases the degree of substitution and lead to the formation of insoluble complexes with FK-506 (11). HP-β-CyD presented a K1:1 value approximately twice less than β-CyD and its reduced solubilizing capacity is maybe related to the steric hindrance of the substituent groups since FK-506 is a bulky molecule (11).
However, the results of HP-β-CyD are debatable, since the r2 of the solubility curve was very close to 0,990, so its profile could almost be considered AL type. In this case, the K1:1 would be 571 ± 156 M-1 and CE would be 0.0012. Consequently, HP-β-CyD could be considered the CyD with the best solubilizing activity. The AP type phase solubility profile was considered because, in addition to the previously established r2 criterion, the quadratic equation was the best fit in the three experiments performed with this CyD. Also, phase solubility tests were performed with this CyD on 3 different days as it was difficult to reach clear conclusions. In the first two attempts, CyD solutions with a concentration range of 0 to 60 (%, w/v) were
28
used according to its solubility in water (> 600 mg/mL), as was the case with the remaining CyDs under study. But the results obtained were very heterogeneous, with a large oscillation, and therefore a huge standard deviation. The curve obtained was similar to one of AN type. Thus, in the third repetition, a smaller concentration range, between 0 and 15 (%, w/v), was considered. In this case good results were achieved, with a very low SD.
The determination of K1:1 is strongly affected by changes of S0, especially for poorly-soluble drugs, so the use of CE to compare the solubilizing potential of different CyD can be a better approach (13,31,32). In this study, the CE values are close for the three different CyD. The natural β-CyD had the highest CE value and therefore the greatest solubilizing effect, which reinforces the results obtained in the comparison of stability constants discussed above. Regarding β-CyD derivatives, the CE value was higher for HP-β-CyD and lower for SBE-β-CyD.
Thus, these results suggest that β-CyD has the greatest solubilizing ability with a higher formation of 1:1 FK-506/β-CyD stable complexes. The affinity of FK-506 to this natural CyD is the best when compared to HP-β-CyD and SBE-β-CyD. Arima et al. (11) reported identical results to β-CyD and HP-β-CyD stability constants (K1:1, K1:2), also featuring their profiles as AP type. But the results of SBE-β-CyD weren’t so consistent since they demonstrated SBE-β-CyD had a higher K1:1 value than HP-β-CyD, however lower than β-CyD.
Under the experimental conditions of this study, tacrolimus preferentially formed 1:1 FK-506/CyD complexes with both β-CyD and HP-β-CyD, since K1:1 is much bigger than K1:2. There is almost no 1:2 FK-506/HP-β-CyD complexes formation, unlike 1:2 FK-506/β-CyD complexeswhich are more abundant, with a significant K1:2 (between 10 and 500 M-1) (12). This means β-CyD has more tendency to form FK-506/CyD complexes with a higher degree of substitution than HP-β-CyD. These results are supported by the study of Sá Couto et al. (19) which reported the lower propensity for complex formation by HP-β-CyD compared to β-CyD.
29
4. CONCLUSION
In this work, a UHPLC method for the detection and quantification of tacrolimus was validated and used as an analytical technique in the phase solubility study. The complex formation of FK-506 with β-CyD, HP-β-CyD and SBE-β-CyD in aqueous solutions and the solubilizing effect of CyDs on drug dissolution rate were evaluated. The phase solubility diagrams, stability constant (K1:1) and complexation efficiency (CE) values were analysed.
The UHPLC method demonstrated to have a high sensitivity, good selectivity, accuracy and precision. It was possible to detect and quantify FK-506 without interference from other components. Thus, this analytical technique is suitable for quality control analysis of complex pharmaceutical preparations containing FK-506 and its impurities.
Regarding solubility studies, two different types of profiles were noted: the β-CyD and HP-β-CyD systems exhibited an AP type phase solubility curve while the SBE-β-CyD system presented a BS type phase solubility curve.The cavity of natural β-CyD seems to fit better the FK-506 molecule since its K1:1 value was the biggest. β-CyD derivatives had lower stability constants, especially SBE-β-CyD which presented lower results than HP-β-CyD for the K1:1 value.The natural β-CyD had the highest CE value and therefore the greatest solubilizing effect, which reinforces the results obtained in the comparison of stability constants. Concerning β-CyD derivatives, the CE value was higher for HP-β-CyD and lower for SBE-β-CyD. Under
the experimental conditions of this study, FK-506 preferentially formed 1:1 FK-506/CyD complexes with both β-CyD and HP-β-CyD, since K1:1 was much bigger
than K1:2.
Thus, these results suggest that β-CyD has the greatest solubilizing ability with a higher formation of 1:1 FK-506/β-CyD stable complexes. The affinity of FK-506 to this natural CyD is the best when compared to HP-β-CyD and SBE-β-CyD. Although the presented data are mostly in line with other studies performed, further research is needed to better understand how CyDs can enhance FK-506 solubility. Performing permeation studies would be an interesting approach to evaluate how the ability of tacrolimus to pass membranes will be improved with CyD complexation.
30
5. REFERENCES
1. PubChem NCBI. Tacrolimus Coumpond Structure.
[https://pubchem.ncbi.nlm.nih.gov/compound/Tacrolimus#section=2D-Structure]
2. Gao S, Sun J, Fu D, Zhao H, Lan M, Gao F. Preparation, characterization and pharmacokinetic studies of tacrolimus-dimethyl-β-cyclodextrin inclusion complex-loaded albumin nanoparticles. International Journal of Pharmaceutics. 2012;427(2):410–6.
3. Patel P, Patel H, Mehta T, Panchal S. Formulation strategies for drug delivery of tacrolimus: An overview. International Journal of Pharmaceutical Investigation. 2012;2(4):169.
4. Spencer CM, Goa KL, Gillis JC. Tacrolimus. An update of its pharmacology and clinical efficacy in the management of organ transplantation. Drugs. 1997;54(6):925–75.
5. Thomson, AW. Bonham, CA. Zeevi A. Mode of action of tacrolimus (FK506): molecular and cellular mechanisms. Therapeutic Drug Monitoring. 1995;17(6):584–91.
6. Bertelmann E, Pleyer U. Immunomodulatory therapy in ophthalmology - Is there a place for topical application? Ophthalmologica. 2004;218(6):359–67.
7. Yücel OE, Ulus ND. Efficacy and safety of topical cyclosporine 0.05% in vernal keratoconjunctivitis. Singapore Medical Journal. 2016;57(9):507–10.
8. Fukushima A, Ohashi Y, Ebihara N, Uchio E, Okamoto S, Kumagai N, et al. Therapeutic effects of 0.1% tacrolimus eye drops for refractory allergic ocular diseases with a proliferative lesion or corneal involvement. British Journal of Ophthalmology. 2014;98(8):1023–7.
9. Yuan J, Zhai JJ, Chen JQ, Ye CT, Zhou SY. Preparation of 0.05% FK506 suspension eyedrops and its pharmacokinetics after topical ocular administration. Journal of Ocular Pharmacology and Therapeutics. 2009;25(4):345–50.
10. Loftsson T. Drug permeation through biomembranes: Cyclodextrins and the unstirred water layer. Pharmazie. 2012;67(5):363–70.
31
the enhancing effects of cyclodextrins on the solubility and oral bioavailability of tacrolimus in rats. Journal of Pharmaceutical Sciences. 2001;90(6):690–701.
12. Jansook P, Ogawa N, Loftsson T. Cyclodextrins: structure, physicochemical properties and pharmaceutical applications. International Journal of Pharmaceutics. 2018;535(1–2):272–84.
13. Brewster ME, Loftsson T. Cyclodextrins as pharmaceutical solubilizers. Advanced Drug Delivery Reviews. 2007;59(7):645–66.
14. Popielec A, Loftsson T. Effects of cyclodextrins on the chemical stability of drugs. International Journal of Pharmaceutics. 2017;531(2):532–42.
15. Thurein SM, Lertsuphotvanit N, Phaechamud T. Physicochemical properties of β-cyclodextrin solutions and precipitates prepared from injectable vehicles. Asian Journal of Pharmaceutical Sciences. 2018;13(5):438–49.
16. Gao S, Jiang J-Y, Liu Y-Y, Fu Y, Zhao L-X, Li C-Y, et al. Enhanced Solubility, Stability, and Herbicidal Activity of the Herbicide Diuron by Complex Formation with β-Cyclodextrin. Polymers. 2019;11(9):1396.
17. Miyake K, Irie T, Arima H, Hirayama F, et al. Characterization of itraconazole/2-hydroxypropyl-β-cyclodextrin inclusion complex in aqueous propylene glycol solution. International Journal of Pharmaceutics. 1999;179(2):237–45.
18. Sá Couto A, Cardoso D., Cabral-Marques H. Validation of an HPLC Analytical Method for the Quantitative/Qualitative Determination of Fluticasone Propionate in Inhalation Particles on Several Matrices. Scientia Pharmaceutica. 2010;82(4):6–8.
19. Sá Couto AR, Ryzhakov A, Loftsson T. 2-hydroxypropyl-β-cyclodextrin aggregates: Identification and development of analytical techniques. Materials. 2018;11(10).
20. Hajiahmadi F, Derkhshan A, Nikandish M, Malaekeh-nikouei B. Preparation of tacrolimus ophthalmic solution using cyclodextrins. Journal of Birjand University of Medical Sciences. 2017;24(1):19–27.
21. Arima H, Yunomae K, Miyake K, Irie T, Hirayama F, Uekama K. Comparative studies of the enhancing effects of cyclodextrins on the solubility and oral bioavailability of
32
tacrolimus in rats. Journal of Pharmaceutical Sciences. 2001;90(6):690–701.
22. Mills RA, Jones DB, Winkler CR, Wallace GW, Wilhelmus KR. Topical FK-506 prevents experimental corneal allograft rejection. In: Cornea. New York: Raven Press Ltd.; 1995. p. 157–60.
23. Benelli U, Lepri A, Del Tacca M, Nardi M. FK-506 delays corneal graft rejection in a model of corneal xenotransplantation. Journal of Ocular Pharmacology and Therapeutics. 1996;12(4):425–31.
24. PubChem NCBI. β-CyD Compound Structure.
[https://pubchem.ncbi.nlm.nih.gov/compound/beta-CYCLODEXTRIN].
25. Chawla G, Ranjan C. Principle, Instrumentation, and Applications of UPLC: A Novel Technique of Liquid Chromatography. Open Chemistry Journal. 2016;3(1):1–16.
26. Chen Q, Wu X, Gao X, Song H, Zhu X. Development and validation of an ultra-performance liquid chromatography method for the determination of wedelolactone in rat plasma and its application in a pharmacokinetic study. Molecules. 2019;24(4).
27. Thermo Scientific. Thermo Scientific Dionex UltiMate 3000 Series - SD, RS, BM, and BX Pumps - Operating Instructions. Manual. 2013. 260 p.
28. ICH Harmonised Tripartite Guideline. Validation of Analytical Procedures : Text and Methodology, Q2 (R1), Geneva. International Conference on Harmonization. 2005;1994:1–17.
29. Shabir GA. A Practical Approach to Validation of HPLC Methods Under Current Good Manufacturing Practices. Journal of Validation Technology. 2004;10:29–37.
30. Higuchi, T., Connors KA. Phase-solubility techniques. Advances in Analytical Chemistry and Instrumentation. In: C.N.R. Wiley-Interscience, New York; 1965. 117– 212 p.
31. Loftsson T, Hreinsdóttir D, Másson M. Evaluation of cyclodextrin solubilization of drugs. International Journal of Pharmaceutics. 2005;302(1–2):18–28.
32. Loftsson T, Hreinsdóttir D, Másson M. The complexation efficiency. Journal of Inclusion Phenomena and Macrocyclic Chemistry. 2007;57(1–4):545–52.