DEVELOPMENT AND EVALUATION OF A TROPICAL FEED
LIBRARY FOR THE CORNELL NET CARBOHYDRATE
AND PROTEIN SYSTEM MODEL
Luís Orlindo Tedeschi
1,3*; Danny Gene Fox
1; Alice N. Pell
1; Dante Pazzanese Duarte Lanna
2,3;
Celso Boin
31
Dept. of Animal Science, Cornell University, 130 Morrison Hall, Ithaca, NY, 14853. 2
Depto. de Produção Animal - USP/ESALQ, C.P. 9 - CEP: 13418-900 - Piracicaba, SP. 3
CNPq Fellow
*Corresponding author <lot1@cornell.edu>
ABSTRACT: The Cornell Net Carbohydrate and Protein System (CNCPS) model has been increasingly used in tropical regions for dairy and beef production. However, the lack of appropriate characterization of the feeds has restricted its application. The objective of this study was to develop and evaluate a feed library containing feeds commonly used in tropical regions with characteristics needed as inputs for the CNCPS. Feed composition data collected from laboratory databases and from experiments published in scientific journals were used to develop this tropical feed library. The total digestible nutrients (TDN) predicted at 1x intake of maintenance requirement with the CNCPS model agreed with those predicted by the Weiss et al. (1992) equation (r2
of 92.7%, MSE of 13, and bias of 0.8%) over all feeds. However, the regression r2
of the tabular TDN values and the TDN predicted by the CNCPS model or with the Weiss equation were much lower (58.1 and 67.5%, respectively). A thorough comparison between observed and predicted TDN was not possible because of insufficient data to characterize the feeds as required by our models. When we used the mean chemical composition values from the literature data, the TDN predicted by our models did not agree with the measured values. We conclude using the TDN values calculated using the Weiss equation and the CNCPS model that are based on the actual chemical composition of the feeds result in energy values that more accurately represent the feeds being used in specific production situations than do the tabular values. Few papers published in Latin America journals that were used in this study reported information need by models such as the CNCPS.
Key words: CNCPS, evaluation, feed library, tropical feeds
DESENVOLVIMENTO E AVALIAÇÃO DE UMA BIBLIOTECA DE
ALIMENTOS TROPICAIS PARA O MODELO “SISTEMA DE
CARBOIDRATO E PROTEÍNA LÍQUIDOS”
DA UNIVERSIDADE DE CORNELL
RESUMO: O uso do Sistema de Carboidrato e Proteina Líquidos da Universidade de Cornell (CNCPS) tanto para produção de leite como carne tem aumentado durante o últimos anos nas regiões tropicais. Entretanto, a falta de uma caracterização adequada de alimentos tem restringido o seu uso corretamente. Esse trabalho teve como objetivo principal o desenvolvimento e a avaliação de uma tabela de composição de alimentos utilizados nas condições tropicais. Os dados da composição desses alimentos foram baseados nas informações necessárias para o uso do modelo CNCPS desenvolvido pela Universidade de Cornell, USA. A composição desses alimentos foi obtida através de análises realizadas em laboratórios e de experimentos publicados em revistas científicas. Os nutrientes digestíveis totais (NDT) estimados através da composição de carboidratos e proteina dos alimentos pela equação de Weiss et al. (1992) e pelo modelo CNCPS foram comparados com os valores da tabela. O NDT estimado ao nível de mantença (1x) com o modelo CNCPS obteve valores próximos
aos estimados pela equação de Weiss et al. (1992) (r2
= 92.7% e bias = 0.8%). Entretanto, o r2
da regressão entre os valores de NDT da tabela e o estimado pelo CNCPS e por Weiss foram menores (58.1 e 67.5%, respectivamente). Uma comparação completa entre os valores observados e preditos não foi possível devido a falta de caracterização dos alimentos conforme necessário pelos modelos testados. Quando os valores médios de literatura foram utilizados, a correlação entre o NDT estimado e o observado foi muito baixa. Concluímos que os valores de NDT estimados por Weiss e modelo CNCPS fornecem melhores estimativas de NDT do que os valores de tabela. A maioria dos trabalhos publicados que foram avaliados nesse estudo raramente incluíam informações necessárias para modelos como o CNCPS.
INTRODUCTION
The demand for meat and milk will increase 2.9
and 3.2% annually in the developing world between 1993
and 2020 (Bradford, 1999; Delgado et al., 1999).
Improved nutrition is the most important and most feasible
way to increase animal productivity to meet this
anticipated demand. The development of accurate feed
composition information for the tropics that can be used
to develop accurate feeding recommendations is
extremely important for cattle production to develop
feeding systems that optimize use of available forages.
When measured data on the protein and
carbohydrate contents of feeds were used, the predictions
of the performance of growing steers (Tedeschi, 2001,
Chap. 2) and dual-purpose cows (Juarez Lagunes et al.,
1999; Lanna et al., 1996) by the Cornell Net
Carbohydrate and Protein System (CNCPS) were more
accurate than when tabular values were used. The
CNCPS model requires an accurate description of the
carbohydrate and protein fractions and the rates of
digestion of these fractions to obtain the best predictions.
Several feed composition tables have been
developed for tropical regions. An extensive feed table
was published by McDowell et al. (1974) for feeds
commonly used in Latin America. In this publication, only
the Weende system components (dry matter (DM), crude
protein (CP), ether extract (EE), crude fiber (CF), ash
(Ash), and nitrogen-free extract (NFE)) and some
minerals were reported. The total digestible nutrients
(TDN), which was derived either from digestion trials or
from empirical equations published by Harris et al. (1972),
was used to estimate the feed concentration of
metabolizable energy (ME) and net energy (NE).
Several short and locally generated feed tables
from Latin America have also been published, e.g. Brazil
(Quadros et al., 1978; Silva & Silva, 1977), Chile (Hirsch
et al., 1974; Pichard & Innocenti, 1987), Colombia
(Laredo & Peralta, 1988; Laredo & Peralta, 1990), Costa
Rica (Maroto, 1955), and Panama (Rosas et al., 1976).
The Food and Agricultural Organization (FAO)
has published (Göhl, 1975; Göhl, 1981) and currently
maintains an electronic version
1of the composition of
some tropical feeds. In this collection, only the Weende
components, digestibility coefficients, TDN, minerals, and
amino acids for some feeds were reported. Similar to the
FAO publications, Legel (1984) has described a German
tropical feed library, but only proximate analyses
(Weende) were reported.
The International Feedstuffs Institute (IFI) has
compiled a comprehensive publication containing the
composition of feeds from different ecozones
(Fonnesbeck et al., 1984). This publication includes
prediction of energy values and the Weende components,
minerals, vitamins, and amino acids composition of
feedstuffs as well as mineral supplements commonly
used in animal nutrition.
Tropical feed tables published to date do not
contain information on the chemical analyses used to
estimate biological value (absorbed energy and protein
of feeds) using models that predict TDN from simulated
ruminal fermentation based on unique feed
characteristics. These fractions are important to be able
to more accurately describe feed in each unique
production situation.
The objective of this study was to develop a
tropical feed library containing chemical composition
values needed for the CNCPS model (Fox et al., 2000)
to predict feed biological values. A second objective was
to evaluate the consistency of the feed composition in this
library by comparing TDN values predicted by two
different approaches with reported TDN values. The goal
is to provide nutritionists with a feed library that can be
used in the design and development of more efficient
feeding systems in the tropics.
MATERIAL AND METHODS
Organization of the Tropical Feed Library
The data were collected from the following
sources to develop the tropical feed library: (1) the feed
chemical analysis database of the University of São
Paulo Animal Science feed analysis laboratory (Escola
Superior de Agricultura “Luiz de Queiroz” – ESALQ/USP,
Piracicaba, SP, Brazil) containing feeds analyzed from
1995 to 1997; (2) Brazilian research with animal
performance, digestibility trials, feed analysis, and feed
degradation rates published in scientific journals
(Alvarenga, 1993; Andrade & Andrade, 1982; Andrade
et al., 1994; Andrade et al., 1987; Andrade et al., 1990;
Araújo & Languidey, 1982; Barbosa et al., 1985; Becker
et al., 1995; Becker et al., 1962; Boin, 1975; Boin et al.,
1968; Bueno et al., 1995; Caielli et al., 1979; Coutinho
Filho et al., 1995; Ferrari Jr et al., 1987; Ferreira et al.,
1995; Fischer Júnior et al., 1998; Gomes et al., 1994;
Hirsch et al., 1974; Juarez Lagunes, 1998; Laredo &
Peralta, 1988; Laredo & Peralta, 1990; Leme, 1986;
Malafaia et al., 1998a; Marcos et al., 1984; Maroto, 1955;
Melotti, 1969a; Melotti, 1969b; Melotti, 1983a; Melotti,
1983b; Melotti, 1986a; Melotti, 1986b; Melotti & Boin,
1969; Melotti et al., 1969a; Melotti et al., 1969b; Melotti
et al., 1969c; Melotti et al., 1968; Melotti & Caielli, 1981;
Melotti et al., 1970a; Melotti & Lucci, 1969; Melotti &
Pedreira, 1970; Melotti & Velloso, 1970; Melotti & Velloso,
1980; Melotti et al., 1970b; Murrieta, 1978; Pereira et al.,
1997a; Pereira et al., 1997b; Quadros et al., 1978;
Queiroz Filho et al., 1998; Rodrigues & Peixoto, 1993;
Rosas et al., 1976; Russi Júnior et al., 1997; Silva & Silva,
1977; Silveira et al., 1979; Velloso et al., 1978a; Velloso
et al., 1978b; Velloso et al., 1982; Vieira et al., 1980; Vilela
et al., 1990; Zeoula et al., 1995; Zeoula et al., 1985), and
(3) feed analysis and degradation rates data from Mexico,
Honduras, Colombia, and Florida (USA) conducted at
Cornell University (Juarez Lagunes, 1998; Traxler, 1997).
The data survey of Brazilian research included
the following journals: Boletim da Indústria Animal (1960
to 1995), Pesquisa Agropecuária Brasileira (1992 to
1997), Revista Brasileira de Zootecnia (1977 to 1997),
and Zootecnia (1970 to 1995), along with several theses
and dissertations.
The data collection and organization of this
database consisted of three phases: (1) the information
reported for each feed was sorted by common name,
botanical name, variety, preservation method, fertilization,
and region; (2) the coefficient of variation (CV) for each
feed component was computed and samples that inflated
the CV more than 30% were considered to be outliers
and excluded from the database; and (3) feeds lacking
crucial information for the CNCPS model (DM, CP,
Neutral Detergent Fiber (NDF), and Lignin) were
excluded from the database.
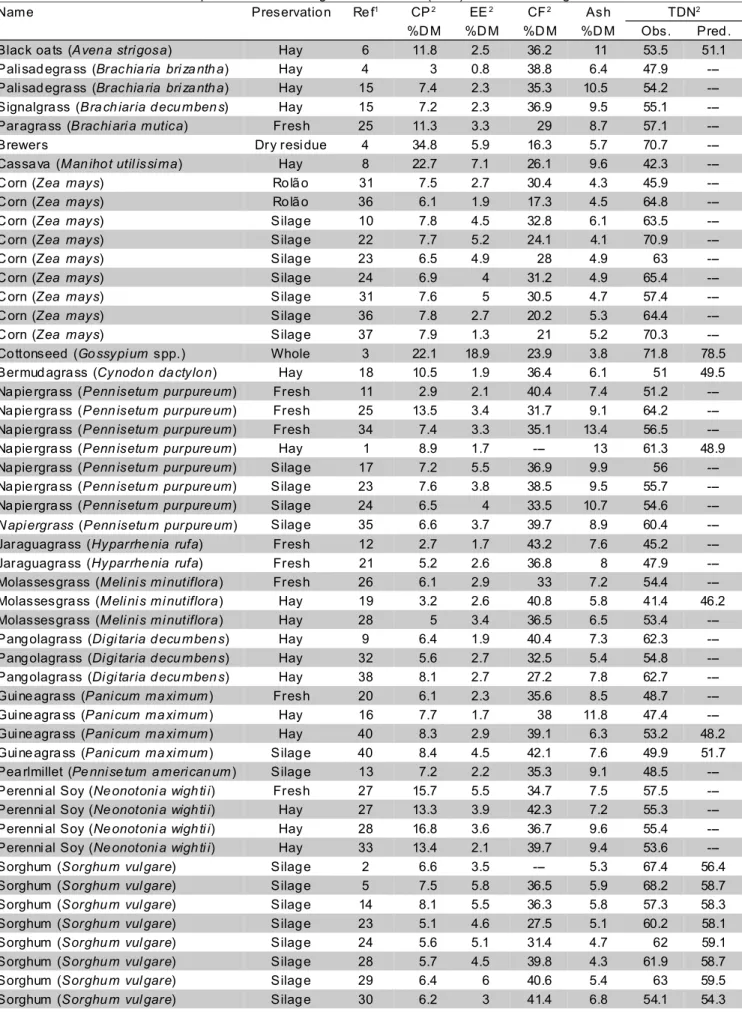
In our analysis, tabular TDN refers to the TDN
values that were reported in published studies using total
collection digestion trials. Studies reporting measured
TDN gathered after 1987 were pooled with TDN values
collected by Roston & Andrade (1992b). The tabular TDN
value for a feed often is not related to the chemical feed
composition because analytical information from several
sources generally is used. Therefore, the TDN value is
the average from several research papers and the feed
chemical analysis values are generally from studies and
databases independent of those reporting TDN values.
Table 1 depicts the feed chemical composition and TDN
values for some literature data.
In order to obtain a more robust and complete
tropical feed library, our database was first compared with
tabular values published for tropical regions (Fonnesbeck
et al., 1984; Göhl, 1975; Göhl, 1981) and the NRC (2000)
feed library.
Some of the information on TDN and amino acid
profiles (%CP) values were obtained from FAO
publications (Göhl, 1975; Göhl, 1981). In these
publications, the TDN value was estimated from digestion
trials with cattle, sheep, or goats. In addition, information
on the amino acid profiles of forages from Tedeschi et
al. (2001) was used. The International Feed Number
(IFN) and some feed composition data were obtained
from Fonnesbeck et al. (1984).
After the initial survey, data were organized into
the tropical feed library, and the missing values for
carbohydrate and protein fractions were obtained from
the NRC (2000) feed library using (1) direct comparison
of the feeds from the NRC (2000) feed library and the
feed with missing values for similar characteristics and
(2) the NRC (2000) feed with the lowest deviation of NDF,
Lignin (Lig), and CP for the feed with missing values, as
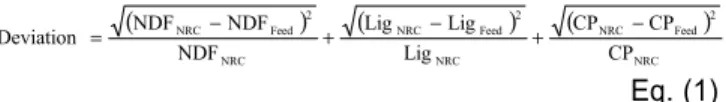
shown by Equation 1:
( ) ( ) ( ) NRC 2 Feed NRC NRC 2 Feed NRC NRC 2 Feed NRC CP CP CP Lig Lig Lig NDF NDF NDF
Deviation = − + − + −
Eq. (1)
These two criteria (direct comparison and Equation
1) ensured that the feed with the most similar fiber and
protein content within a feed category was selected to
provide the missing values. The approach used in
Equation 1 can be extended to other feed composition to
enhance feed characteristics comparisons.
The CNCPS model divides feed carbohydrate and
protein into four and five pools, respectively. Carbohydrate
pools are sugars, organic acids and short oligosaccharides
(A), starch and pectic substances (B1), digestible fiber
(B2), and an indigestible fiber (C). The protein pools
include non-protein nitrogen (A), soluble true protein with
rapid (B1), intermediate (B2), and slow (B3) degradation
rates in the rumen, and bound protein (C) (Sniffen et al.,
1992). For forages listed in this feed library, actual
degradation rates were used when available. When they
were not available, degradation rates were based on the
data of Juarez Lagunes et al. (1999). For determining
degradation rates of forages not in this feed library, a table
with rates classified by NDFIP content was developed from
Juarez Lagunes et al. (1999) dataset.
Calculation of the Total Digestible Nutrients
The tabular TDN value of the tropical feed library
was compared with the predicted TDN value using the
CNCPS version 4.0 model (Fox et al., 2000) level 1 (the
equation developed by Weiss et al. (1992) and Weiss
(1993)) and level 2 (TDN predicted by the CNCPS model
rumen fermentation simulation as described by Russell et
al. (1992) and by NRC (2000)). The Weiss equation
calculates TDN based on available soluble carbohydrates,
proteins, fatty acids, and fiber, and their true digestibility
coefficients, which are assumed to be constant except for
protein, which is adjusted for ADFIP. The Weiss TDN is
then adjusted for endogenous fecal energy.
The Weiss TDN was estimated for animals with
dry matter intake at close to the maintenance requirement
(Equation 2). The TDN value at 3x intake may be
estimated using equations developed by Van Soest & Fox
(1992) or Tedeschi (2001, Chap. 2).
TDN1x = 0.98 x (100 - NDFn - CP - Ash - EE + IADFIP) + dCP x CP + 2.25 x (EE - 1) + + 0.75 x NDFn - Lignin) x [1 - (Lignin/NDFn)2/3
] - 7
Eq. (2)
For forage: Indigestible ADFIP(IADFIP) = 0.7 x ADFIP
For concentrate: Indigestible ADFIP(IADFIP) = 0.4 x ADFIP
Eq. (3)
For forage: Digestibility of CP (dCP) = e(-0.012xADFIP)
For concentrate: Digestibility of CP (dCP) = 1- (0.004xADFIP)
Eq. (4)
NDF adjusted for nitrogen (NDFn) = NDF - NDFIP + IADFIP
Eq. (5)
A simple ration was formulated with the CNCPS
model to predict the TDN at 1x for each feed in the library
using data from a dual-purpose lactating cow producing
8 kg of milk/d, weighing 600 kg, and 150 days in milk.
The standard diet was composed of pangola grass
(
Digitaria decumbens
), corn grain, and 49% CP soybean
meal, and it was formulated to maintain pH, ruminal N
balance and ruminal peptide balance within an ideal
range to avoid adjustments to fiber digestibility and
microbial yield due to inadequate NDF in the diet. Dry
matter intake (DMI) was fixed at 1x using 70% of relative
DMI (RDMI). Then, a small amount (100 g) of each feed
from the dataset was individually included in this standard
diet to obtain predicted TDN and undegraded intake
protein (UIP) values. This substitution process was
repeated for each feed.
Statistical Analysis
All the statistical analysis was performed using
SAS (SAS Institute, 1991). The PROC REG procedure
was used to obtain the parameter estimates of the
regressions. The plot of studentized residue versus
predicted Y-variate and Cook’s D influence statistic
(SAS Institute, 1991) were used to analyze outliers
(Neter et al., 1996), but they are not shown. If the
studentized residue was outside of the range –2.5 to
2.5, then it was considered an outlier and removed from
the analysis.
Bias was calculated as the slope of linear
regression minus one (the regression was forced through
the origin) when the intercept of the linear regression did
not differ from zero (P < 0.05). Otherwise, bias was
calculated by dividing the mean of the Y-variate minus
the mean of the X-variate by the mean of the X-variate.
A positive bias means that the Y-variate has greater
values than the X-variate. The reported r
2and the mean
square error (MSE) were obtained from the linear
regression not forced through the origin.
RESULTS AND DISCUSSION
Only few digestion trials reported the necessary
feed chemical composition values in order to predict TDN
using the Weiss et al. (1992) equations as shown in
Table 1. The comparison of observed and predicted TDN
indicated a mean underprediction of 5.9%. A thorough
comparison between observed and predicted TDN was
not possible because of insufficient data to characterize
the feeds as required by our models.
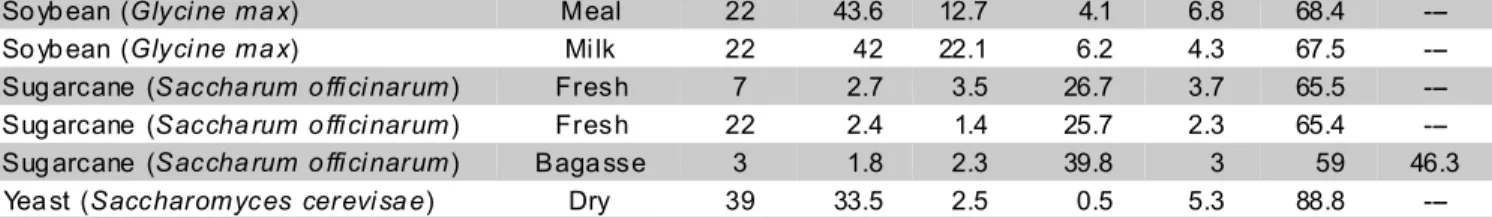
Table 2 shows the chemical composition of feeds
developed for the tropical feed library in the CNCPS
format. Table 3 includes the carbohydrate and protein
degradation rates, tabular TDN, TDN predicted by the
Weiss et al. (1992) equation and by the CNCPS rumen
simulation model at 1x and 2x intake at maintenance
requirement, and UIP at 1x and 2x predicted by the
CNCPS rumen simulation model. Table 4 contains the
amino acid composition.
The default intestinal digestibility coefficients are
100, 75, and 20% for carbohydrate fractions A, B1, and
B2, and 100, 100, and 80% for protein fractions B1, B2,
and B3. Intestinal digestibility of starch (CHO B1)
depends on type of grain, degree of processing, and level
of intake above maintenance (Fox et al., 2000). Values
used in the CNCPS range from 30 to 97% based on
experimentally measured digestibility coefficients
summarized in the literature (Knowlton et al., 1998;
Sniffen et al., 1992).
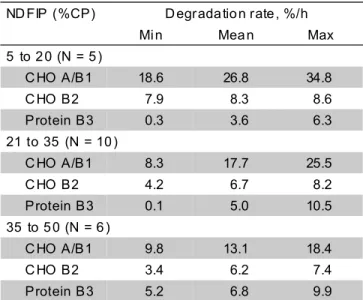
Table 5 shows the degradation rates for
carbohydrate fractions A/B1 and B2, and for protein
fraction B3 categorized by NDFIP content of the forage
grasses analyzed by Juarez Lagunes (1998).
Carbohydrate fraction A/B1 had a better correlation with
NDFIP (-0.74) than with ADFIP (-0.58) whereas fraction
B2 had a similar correlation between NDFIP (-0.61) and
ADFIP (-0.62). These correlations suggest the bound
protein in the fiber affects degradation rate in a nonlinear
fashion (Van Soest et al., 2000) likely because of limited
availability of this protein for fiber digesting bacteria. The
degradation rate of the protein fraction B3 had the lowest
correlation either with NDFIP (0.54) or with lignin (-0.59).
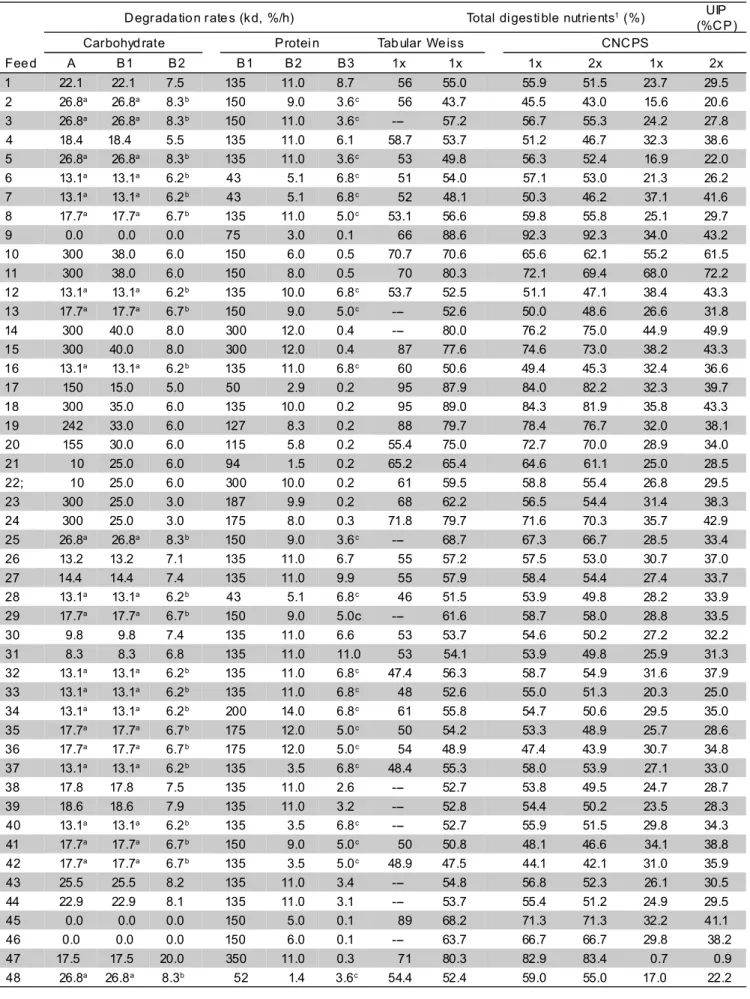
When we used the mean chemical composition
values from the literature data, the TDN predicted by our
models did not agree with the measured values. Across
all feeds in the library, the regression analysis of tabular
TDN values with either the TDN predicted by the CNCPS
rumen simulation model (Figure 1A) or that predicted by
the Weiss et al. (1992) equations (Figure 1B) had a low
r
2(58.1% and 67.5%, respectively) and high MSE values
(67 and 52, respectively), suggesting that the tabular TDN
values are not well related to the TDN predicted either
by CNCPS rumen simulation or Weiss et al. (1992)
equations. This high variation, as discussed by Tedeschi
(2001, Chap. 2), may be because (1) feeds used in the
digestion trials represented by the TDN values were
different than those represented by the chemical
composition values of the tropical feed library and (2)
errors in the difference method used to predict tabular
TDN values. Furthermore, with many of the digestion
trials, the TDN value may be confounded with dietary
ingredients other than the feed evaluated.
Figure 1C shows the regression between TDN
predicted at 1x DMI at maintenance requirement by the
CNCPS rumen simulation model and by the Weiss et al.
(1992) equations. In contrast to the regressions with
tabular TDN, the CNCPS rumen simulation vs Weiss
regression had a higher r
2(92.7%) and lower MSE (13).
On average, the Weiss TDN prediction was 0.8 units
greater than the CNCPS rumen simulation prediction
(60.9% vs 60.1%, respectively), which resulted in a
greater prediction of 1.3% of TDN by the Weiss
equations. In the evaluation of the NRC (2000) feed
library (temperate feeds), Weiss equations were only 1.3
units lower and the r
2Juarez Lagunes et al. (1999) suggested that the
rates currently in the CNCPS (Fox et al., 2000) and NRC
(2000) feed libraries for carbohydrate A are too high, and
further work is needed to determine more accurate values
for other feeds for this fraction. The degradation rates of
protein fractions still need to be further evaluated.
As DMI increases, forage digestibility decreases
due to increased loss from the rumen of potentially
digestible NDF. This fraction is the slowest to degrade
and therefore is the most likely to escape from rumen
degradation (Van Soest, 1994, p. 414). The CNCPS
model calculates the passage rate based on body
weight, dietary concentration of forage and effective
NDF, and DMI (Fox et al., 2000). Tedeschi (2001, Chap.
2) derived equations to discount TDN values for
growing/finishing steers and lactating cows based on
weight, feed composition, and intake above
maintenance requirement. Even though there is a
discount in TDN value due to passage rate, it is likely
that the efficiency of DE to ME also changes because
less methane is produced and the volatile fatty acids
(VFA) profile changes. Additionally, a discount for
protein is necessary as demonstrated by Van Soest
(1994, p. 417). However, despite differences in feed
composition between tropical and temperate feeds,
which are primarily evident in the fiber fraction (Van
Soest, 1994), the digestible energy (DE) of tropical and
temperate forages is similar. Roston & Andrade (1992a)
found that the energy of TDN of tropical feeds was very
similar to that found by Swift (1957) (4.422 and 4.409
Mcal DE/kg TDN, respectively). The NRC (2000) uses
4.409 Mcal/kg to convert DE to TDN. Roston & Andrade
(1992a) also reported values of 4.633 for roughages, 4.4
for silages, and 4.014 Mcal/kg for mixed diets.
Comparing the growth of seventeen varieties of
alfalfa (
M. sativa
L.) during summer and winter in a humid
subtropical climate, Monteiro et al. (1998) found that, on
average, CP concentration was lower (19.4 vs 21.5%
DM) and that NDF and ADF were greater (48.3 vs 40.8
and 35.2 vs 29.6% DM, respectively) during the summer
than in the winter growth period. The authors also
observed an interaction of NDF and ADF between
varieties and seasons (summer and winter). This
information suggests that the classification of tropical
forages by age or by season of growth (spring vs
summer, rainy vs dry season) is important to ensure
adequate forage characterization and the standardization
of feed identification.
Several tropical feeds have been evaluated for
chemical composition and ruminal degradation by Malafaia
et al. (1998b). However the use of different curves to
estimate the degradation rate of NDF is not recommended
because they result in different estimates of digestion rate.
The degradation rates (b) have been estimated in the
CNCPS feed library using the exponential equation with
lag (c) (Eq. 6) as discussed by Schofield & Pell (1995a;
1995b) and Schofield et al. (1994).
Figure 1 - Evaluation of tabular TDN and TDN predicted at 1x maintenance requirement. Symbols are grass forages (◊), legume forages (o), grain-type forages (+), energy concentrates(◊), protein concentrates (∆), and by– product feeds (*). A positive bias means that Y values are greater than X values. (A) Relationship between tabular TDN and TDN predicted by the CNCPS 4.0 rumen fermentation simulation model. The equation is Y = 16.3 + 0.74X with an r2 of 58.1%, mean standard error (MSE)
of 66.9, and bias of 0.5% (P > 0.05). Slope was different from one (P < 0.05). (B) Relationship between tabular TDN and TDN predicted by the Weiss et al. (1992) equations. The equation is Y = 15.7 + 0.74X with an r2 of
67.5%, MSE of 52, and bias of –0.43% (P > 0.05). Slope was different from one (P < 0.05). (C) Relationship between predicted TDN by Weiss et al. (1992) equations and by the CNCPS 4.0 rumen fermentation simulation model. The equation is Y = -1.57 + 1.04X with an r2 of
92.7%, MSE of 13, and bias of 0.8% (P > 0.05). The slope was not different from one (P > 0.05).
35
45
55
65
75
85
95
35
55
75
95
CNCPS Rumen Simulation TDN, %
Tabular TDN, %
Y=X
A
35
45
55
65
75
85
95
35
55
75
95
Weiss TDN, %
Tabular TDN, %
Y=X
B
35
45
55
65
75
85
95
35
55
75
95
CNCPS Rumen Simulation TDN, %
Weiss TDN, %
Table 1 - Measured chemical composition and total digestible nutrients (TDN) of feeds from digestiorials.
Name Preservatio n Re f1 CP2 EE2 CF2 Ash TDN2
%D M %D M %D M %D M Obs. Pred .
Black oa ts (Aven a stri gosa) Hay 6 11.8 2.5 36.2 11 53.5 51.1
Pali sad egra ss (Brachia ria bri za nth a) Hay 4 3 0.8 38.8 6.4 47.9
---Pali sad egra ss (Brachia ria bri za nth a) Hay 15 7.4 2.3 35.3 10.5 54.2
---Signalgra ss (Bra ch iaria d ecu mben s) Hay 15 7.2 2.3 36.9 9.5 55.1
---Paragra ss (Brachi ari a mutica) Fresh 25 11.3 3.3 29 8.7 57.1
---Brewers Dry resi due 4 34.8 5.9 16.3 5.7 70.7
---Cassa va (Man iho t util issi ma) Hay 8 22.7 7.1 26.1 9.6 42.3
---C orn (Zea mays) Ro lã o 31 7.5 2.7 30.4 4.3 45.9
---C orn (Zea mays) Ro lã o 36 6.1 1.9 17.3 4.5 64.8
---C orn (Zea mays) Silag e 10 7.8 4.5 32.8 6.1 63.5
---C orn (Zea mays) Silag e 22 7.7 5.2 24.1 4.1 70.9
---C orn (Zea mays) Silag e 23 6.5 4.9 28 4.9 63
---C orn (Zea mays) Silag e 24 6.9 4 31.2 4.9 65.4
---C orn (Zea mays) Silag e 31 7.6 5 30.5 4.7 57.4
---C orn (Zea mays) Silag e 36 7.8 2.7 20.2 5.3 64.4
---C orn (Zea mays) Silag e 37 7.9 1.3 21 5.2 70.3
---Co ttonseed (Go ssypi um spp.) Whole 3 22.1 18.9 23.9 3.8 71.8 78.5
Bermud agra ss (Cynodo n da ctylo n) Hay 18 10.5 1.9 36.4 6.1 51 49.5
Na pie rgra ss (Penn isetu m purpure um) Fresh 11 2.9 2.1 40.4 7.4 51.2
---Na pie rgra ss (Penn isetu m purpure um) Fresh 25 13.5 3.4 31.7 9.1 64.2
---Na pie rgra ss (Penn isetu m purpure um) Fresh 34 7.4 3.3 35.1 13.4 56.5
---Na pie rgra ss (Penn isetu m purpure um) Hay 1 8.9 1.7 --- 13 61.3 48.9
Na pie rgra ss (Penn isetu m purpure um) Silag e 17 7.2 5.5 36.9 9.9 56
---Na pie rgra ss (Penn isetu m purpure um) Silag e 23 7.6 3.8 38.5 9.5 55.7
---Na pie rgra ss (Penn isetu m purpure um) Silag e 24 6.5 4 33.5 10.7 54.6
---N api ergrass (Penn isetu m purpure um) Silag e 35 6.6 3.7 39.7 8.9 60.4
---Jaraguagra ss (Hyparrhe nia rufa) Fresh 12 2.7 1.7 43.2 7.6 45.2
---Jaraguagra ss (Hyparrhe nia rufa) Fresh 21 5.2 2.6 36.8 8 47.9
---Molassesgra ss (Meli ni s mi nutiflora) Fresh 26 6.1 2.9 33 7.2 54.4
---Molassesgra ss (Meli ni s mi nutiflora) Hay 19 3.2 2.6 40.8 5.8 41.4 46.2
Molassesgra ss (Meli ni s mi nutiflora) Hay 28 5 3.4 36.5 6.5 53.4
---Pang olagra ss (Di gi taria d ecu mben s) Hay 9 6.4 1.9 40.4 7.3 62.3
---Pang olagra ss (Di gi taria d ecu mben s) Hay 32 5.6 2.7 32.5 5.4 54.8
---Pang olagra ss (Di gi taria d ecu mben s) Hay 38 8.1 2.7 27.2 7.8 62.7
---Guine agra ss (Pani cum ma xi mum) Fresh 20 6.1 2.3 35.6 8.5 48.7
---Guine agra ss (Pani cum ma xi mum) Hay 16 7.7 1.7 38 11.8 47.4
---Guine agra ss (Pani cum ma xi mum) Hay 40 8.3 2.9 39.1 6.3 53.2 48.2
Guine agra ss (Pani cum ma xi mum) Silag e 40 8.4 4.5 42.1 7.6 49.9 51.7
Pea rlmillet (Pe nni se tum a meri can um) Silag e 13 7.2 2.2 35.3 9.1 48.5
---Perenni al Soy (Ne onotoni a wigh ti i) Fresh 27 15.7 5.5 34.7 7.5 57.5
---Perenni al Soy (Ne onotoni a wigh ti i) Hay 27 13.3 3.9 42.3 7.2 55.3
---Perenni al Soy (Ne onotoni a wigh ti i) Hay 28 16.8 3.6 36.7 9.6 55.4
---Perenni al Soy (Ne onotoni a wigh ti i) Hay 33 13.4 2.1 39.7 9.4 53.6
---Sorghum (Sorghu m vul gare) Silag e 2 6.6 3.5 --- 5.3 67.4 56.4
Sorghum (Sorghu m vul gare) Silag e 5 7.5 5.8 36.5 5.9 68.2 58.7
Sorghum (Sorghu m vul gare) Silag e 14 8.1 5.5 36.3 5.8 57.3 58.3
Sorghum (Sorghu m vul gare) Silag e 23 5.1 4.6 27.5 5.1 60.2 58.1
Sorghum (Sorghu m vul gare) Silag e 24 5.6 5.1 31.4 4.7 62 59.1
Sorghum (Sorghu m vul gare) Silag e 28 5.7 4.5 39.8 4.3 61.9 58.7
Sorghum (Sorghu m vul gare) Silag e 29 6.4 6 40.6 5.4 63 59.5
So yb ean (Glyci ne ma x) Meal 22 43.6 12.7 4.1 6.8 68.4
---So yb ean (Glyci ne ma x) Mi lk 22 42 22.1 6.2 4.3 67.5
---Sug arcane (Saccha rum o ffi ci narum) Fresh 7 2.7 3.5 26.7 3.7 65.5
---Sug arcane (Saccha rum o ffi ci narum) Fresh 22 2.4 1.4 25.7 2.3 65.4
---Sug arcane (Saccha rum o ffi ci narum) Baga sse 3 1.8 2.3 39.8 3 59 46.3
Yea st (Saccharomyces cerevi sa e) Dry 39 33.5 2.5 0.5 5.3 88.8
---1 References: (1) Gomes et al., 1994; (2) Alvarenga, 1993; (3) Zeoula et al., 1995; (4) Zeoula et al., 1985; (5) Melotti, 1986a; (6)
-Andrade et al., 1987; (7) - Melotti, 1986b; (8) - Araújo & Languidey, 1982; (9) - Ferrari Jr et al., 1987; (10) - Melotti, 1983a; (11) - Melotti, 1983b; (12) - Velloso et al., 1982; (13) - Andrade & Andrade, 1982; (14) - Melotti & Caielli, 1981; (15) - Andrade et al., 1994; (16) - Barbosa et al., 1985; (17) - Melotti & Velloso, 1980; (18) - Bueno et al., 1995; (19) - Caielli et al., 1979; (20) - Velloso et al., 1978a; (21) - Velloso et al., 1978b; (22) - Andrade et al., 1990; (23) - Boin et al., 1968; (24) - Melotti et al., 1968; (25) - Melotti & Lucci, 1969; (26) - Melotti, 1969b; (27) - Melotti et al., 1969b; (28) - Melotti et al., 1969c; (29) - Melotti & Boin, 1969; (30) - Melotti et al., 1969a; (31) - Melotti, 1969a; (32) - Melotti et al., 1970b; (33) - Melotti & Velloso, 1970; (34) - Melotti & Pedreira, 1970; (35) - Melotti et al., 1970a; (36) - Silveira et al., 1979; (37) - Vieira et al., 1980; (38) - Becker et al., 1962; (39) - Leme, 1986; and (40) - Murrieta, 1978.
2 CP =Crude protein, EE = Ether extract, CF = Crude fiber, TDN = Total digestible nutrients, Obs. = TDN observed from digestion trials, and
Pred. = TDN predicted by Weiss et al. (1992) equation.
Table 2 - Chemical composition of typical tropical feeds1.
Fee d Name Fert2 Ori gin IFN2 C onc2 Forag e D M ND F Lig nin CP SolCP NPN NDF IP ADF IP CHO:B1 EE As h e ND F %D M %D M %AF %D M %ND F %D M %CP %SolCP %CP %CP %NSC %D M %D M %ND F Alemangra ss (Echin och loa pol istac hya)
1 Fresh (2 ) Y Mexico 0 100 15.2 68.3 4.7 9.3 29.6 74.8 25.6 4.8 38.5 1.8 12.3 41 6.4 0.6 1.4 1.2 12.7 1 2.1 5.4 0.5 1 Alfalfa (Med icago sativa)
2 Hay (7 ) Brazil 1-00-078 0 100 89.5 66.9 18.1 19 30 93 1 0.5 10 1.9 10.4 92
2 7.3 0.2 3.4
3 Si la ge (1 ) Brazil 3-00-212 0 100 49.7 43.5 18.3 18.6 45 100 19.8 10.4 10 1.7 9.6 81 Ba hi agra ss (Pasp al um notatum)
4 Fresh (2 ) Y Mexico 2-00-464 0 100 19.1 71 6 10.5 19.7 58.4 43.2 8.3 46.4 1.4 10.7 41 0.5 0.6 0.1 6.5 26.4 4.1 0.4 0.2 0.7 Bermud agra ss (Cyn odo n da ctylo n)
5 Fresh (7 ) Brazil 2-00-712 0 100 24.7 79.8 8.4 9.4 25.9 25.4 4.5 1.7 6 1.4 7.2 98
5.5 3.7 0.4 1.3
6 Hay Brazil 1-00-703 0 100 88.2 75.5 7.5 10.6 28.9 96 35.9 5.4 6 1.5 6.8 98 3 5.8 1 3.7 6.5 18.4 3.2 0.6 2.2
55 13 9 55 3 5 6 50 55
7 Hay (7 ) Flo rid a 1-00-703 0 100 89.4 81 9.6 9.8 15.6 96 47.3 23.1 6 1.5 7 98 0.2 5.7 1.3 2.9 5.7 20.5 6.5 3.1 Black oa ts (Aven a stri gosa)
8 Hay Brazil 1-03-280 0 100 88.6 75.8 7.5 13.7 30 93 30 10 90 3.6 6.4 98
3.1 7.3 4.5 1.4 2.7
8 2 1 8 7 8
Bloo d
9 Meal (1 ) Brazil 5-00-380 100 0 84.1 0 0 89.8 5 0 1 1 0 0.4 4 0
Brewers
10 Dry residue (5 ) Brazil 5-02-141 100 0 90.2 52.3 5.2 17.6 4 75 40 3.5 100 3.3 5.4 18
1 9.7 2.3 1
11 Wet resi due Brazil 5-02-142 100 0 15.2 58 6.8 30.1 8 50 62.8 11.7 100 10.1 3.9 18
3.5 13.3 4.3 2.8 1.4 0.7
35 2 2 35 1 1 35 35
Buffelgra ss (Cen chrus ci liari s)
12 Hay Brazil 0 100 92 75.7 11.2 3.7 24.3 5 40.5 21.6 0 3 4.7 41
C alopo (C alopogo niu m mucunoi de s)
13 Hay (2 ) Brazil 0 100 91.6 52.5 23 13 29.3 28 26 8.7 10 1.2 6 92
1.4 2.9 1.3
Cassa va (Man iho t util issi ma)
14 Residue (3 ) Brazil 100 0 18.8 20.2 12 2.2 25 45 30 5 13.6 0.2 1.4 0
3 3.4 1.8 0.5 0.3
C itrus
15 Pulp Brazil 4-01-235 100 0 86.9 18.2 10 7.1 27 96 21.1 16.34 90 2 6.1 33
5.9 4.7 3.8 0.6 0.7 1.5
8 4 3 8 1 1 8 8
Gamb agra ss (And ropo gon gayanu s)
26 Fresh (3 ) N Mexico 2-00-825 0 100 27.8 71.9 5.6 6.2 21.9 80 49.9 7.1 35.6 1.6 7.4 41 0.2 0.6 0.4 7 21.8 6.4 1.4 2.6 0.2 0.5 27 Fresh (2 ) Y Mexico 2-00-825 0 100 20.8 67.7 6.7 12.1 18.2 85.9 46.7 6.1 42.6 2.6 8.9 41
0.2 0.1 0.8 6 19.9 9.6 0.8 3.6 0.5 1 28 Hay (3 ) Ho ndura s 0 100 89 72.1 6.4 11.4 18.5 80 54.2 9.4 35.6 1.7 12.8 98
0.2 1.8 0.7 2.8 7 3.8 1.3
Gliricidia (Gliricidia sepium)
29 Hay Ho ndura s 0 100 88.5 37.3 24.4 24.4 31.6 96 25.4 11.9 10 3.2 8.6 92 Gui ne agra ss (Pani cum ma xi m um)
30 Fr esh (12 ) N Mexico 2-09-409 0 100 26.1 72.6 6.4 6.1 33.2 83.7 35.3 8.6 31.3 2 9.8 41 1.7 2.1 1.1 1.4 5.1 9.2 2.1 2.2 10 0.2 0.8 31 Fresh (2 ) Y Mexico 2-09-409 0 100 18.4 66.9 6.8 9.6 28.7 39.2 34.5 8.1 38.1 3 12.7 41
0.6 1.1 1.3 2.3 3.8 1.2 10.7 0.1 0.2 32 Hay (24 ) Br azil 0 100 89.5 75.7 8.6 8.4 29.1 96 37 9.9 6 1.7 7.7 98
1.6 5.4 1.2 2.8 1.1 0.6 2.0
33 Hay (2 ) Ho ndura s 0 100 88.8 66.6 6.8 14.9 35.5 96 39.7 4.4 6 1.5 13.4 98 0.8 2.5 0.5 1.3 2.7 1.5 0.1 0.7 34 Pasture (2 ) Honduras 0 100 91.3 66.7 6.1 10.3 32.4 3.41 43.7 9.2 8 3.2 12.4 41
2.1 2.5 0.7 0.9 4.3 4.4 1.2 0.5 35 Si la ge (4 ) Br azil 0 100 24.7 73.7 8.3 8.0 54.7 25.0 33.3 13.7 100 4.0 8.9 41
1.4 1.6 0.3 0.8 0.6 2.6 0.5 1.1 2.6 36 Silag e Ho ndura s 0 100 87.5 60.7 9.6 10.5 39 90 33.3 14.3 100 2.8 17.1 41
Ja raguagrass (Hyparrhe nia rufa)
37 Hay (4 ) Br azil 0 100 91 72.8 6.6 7.8 18.6 5 51.9 7.9 0 3 9.7 98
0.6 4.6 1.6 4 2.9 11 2.7 2.4
Koro ni vi agrass, C re epi ng sig nalgrass (Brachi ari a hu m idi co la )
38 Fresh (3 ) N Mexico 0 100 22.9 75.7 8.1 6 47 50.5 21.2 7.3 21.2 1.6 6.6 41 2.1 1.4 1 1.3 2.2 4 2.9 1.9 6.7 0.3 0.6 39 Fresh (2 ) Y Mexico 0 100 14 70.3 7.2 9.8 39.9 53.6 17.1 4.3 35.1 2 10.6 41
1.2 0.7 1 4.2 0.8 0.3 0.6 0.1 0.7
40 Hay Br azil 0 100 93.6 79 7.5 4.4 25 5 36.2 16 0 0.9 5.3 98
2.9 1.4 0.2 1.1
3 1 1 3 1 1 2 3
Kudzu, Puero (Puera ria pha seo loi de s)
41 Hay Br azil 0 100 92.4 53.9 21.5 14 26 5 32.9 18 0 1.6 8 92
Le ucaena, L ead tre e, Ka o ha ole (Le uca ena leu coceph ala )
42 Hay Br azil 1-02-492 0 100 94.7 64.3 21.4 11.7 25 5 33.9 14.5 38 0.7 4.8 98 L la nerogra ss (Bra chi ari a di ctyo neur a)
Fee d Name Fert2 Ori gin IFN2 C onc2 Forag e D M ND F Lig nin CP SolCP NPN NDF IP ADF IP CHO:B1 EE As h e ND F %D M %D M %AF %D M %ND F %D M %CP %SolCP %CP %CP %NSC %D M %D M %ND F 16 Hay Brazil 0 100 91.2 75.5 10.6 3.4 38.2 2.4 38.2 17.6 6 2.1 6.3 41
C orn (Zea mays)
17 Cracked (9 ) Brazil 4-02-698 100 0 87.9 10.9 7.3 9.2 17.8 30 6.8 2.3 90 4 1.9 60
1.1 7.3 1.2 8.5 3.1 1.3 1.4
18* Grai n Brazil 4-02-935 100 0 88 13.4 2.8 9.5 11 73 10.7 4 90 4.4 1.5 88
1 3.3 1.2 1.3 0.3
17 3 1 16 1 1 15 17
19# Rolão MPS (1 ) Brazil 80 20 87.5 21.36 3.86 30.4 17.08 78.06 11.48 5.36 92 2 4.8 86.6 20 Rolão To tal (2 ) Brazil 70 30 89.4 33.3 5.45 6.8 26.2 85.65 12.65 7.4 95 2.3 4.4 84.5
1.1 1 0.6 0.2
21 Silag e Brazil 3-02-912 20 80 31.4 53.2 8.1 7.1 41.4 98.3 14.6 10.8 100 2.5 4.2 81 7 7.2 3.9 1.3 0.7 8.1 4.6 0.7 1.2
165 28 8 165 2 2 5 24 155 162
22 Si la ge (2 ) Ho ndura s 3-02-912 20 80 87.2 56.3 10.3 8.3 47 100 19.3 9.6 100 2.1 6.5 81
Co ttonseed (Gossypi um spp.)
23 Meal Brazil 5-17-728 100 0 90.1 46.9 15.1 37.9 20 40 9.3 1.5 90 1.5 5.8 36
1.3 12 6.6 0.7 0.8
19 3 1 19 1 1 17 18
24 Whole Brazil 5-01-614 100 0 89.5 44.1 23 22.6 12.3 57.7 12 7.5 6 16.6 4.1 36
2.3 10.1 7.1 7.6 4.4 6.8 2 4.8 0.8
15 5 4 15 2 1 3 5 15 15
Ente rolobi um (Ente rol obi um cyclocarp um)
Fee d Nam e Fer t2 Ori gi n IFN2 C onc2 Forag e D M ND F Lig ni n CP SolCP NPN NDF IP ADF IP CHO:B1 EE Ash e ND F %D M %D M %AF %D M %ND F %D M %CP %S olCP %CP %CP %NSC %D M %D M %ND F 4 3 Fresh (3 ) N Mexico 0 10 0 22.4 7 4 5.4 5.4 4 1 59.9 22.7 8.2 2 6 1.3 8.4 4 1
3.5 3.1 0.8 2.4 2.8 8 4.1 4.6 2.2 0.3 0.9 44 Fresh (2 ) Y M exico 0 100 18.4 69.9 6.1 7.7 41.5 56.1 20.8 5.8 32.1 1.8 10.9 41
2 0.1 1.3 3.2 1.7 3 0.8 11.7 0.2 0.3 Mea t
45 Meal (6 ) Brazil 5-07-314 100 0 94.7 0 0 46.9 8.6 26.5 0 0 0 12 37.5 0
1.7 4.8 2.4 5.5
Mea t and Bone
46 M eal Brazil 5-00-388 100 0 95.1 0 0 46.1 16.09 21.4 0 0 0 11 40.8 0
Molasse s
47 Sugarcane Mexico 100 0 85.8 0 0 4.2 98 100 0 0 0 2.2 11.6 0
Molassesgra ss (M eli ni s m i nutiflor a)
48 Fresh (2 ) Brazil 0 100 30.1 78.3 6.8 7.1 25 5 3.4 1.7 0 2.2 8.3 98
3.4 1.5 1 1.5
49 Fresh (2 ) Y M exico 0 100 17.6 70.2 4.7 8.6 27.9 50.1 33 4.9 0 2.5 12.8 41 0.2 0.2 0.3 4.6 3.5 0.2 0.2 0.3
50 Hay (5 ) Brazil 0 100 90.8 81.5 10.3 3.9 25 5 2 1 0 2.9 6.1 98
0.7 0.9 3.1 1.2 0.5 0.5
Na pie rgra ss (Penn isetu m pur pure um)
51 Fresh (10 ) Brazil 2-03-162 0 100 23.7 74 9.6 6.6 46 2.2 2.2 0.9 8 2.3 9.4 41
6.9 3.1 1.5 2.9 1 2.5
52 Hay Brazil 1-08-462 0 100 91.3 65.8 7.3 10.4 32.4 95 39.7 10 10 1.7 11.8 98
1.8 10.5 2.6 3.4 14.7 6.5 6 3.1
6 6 5 7 5 5 6 1 7
53 Silag e Brazil 0 100 23.8 78.4 12.2 5.4 50 90 52.6 26.1 100 2.3 7.7 41
8.2 2.4 3.1 1.6 9.2 1.2 2.1
18 3 2 18 1 2 17 18
Pali sad egra ss (Brach iaria bri za nth a)
54 Fresh Brazil 0 100 25.1 76.4 8.3 7.1 41 2.4 4.6 2.1 5 1.6 7.6 41
4.6 5.7 2.6 0.6 1.6
11 2 1 11 1 1 11 11
55 Fresh (3 ) N M exico 0 100 25.1 67.8 5.3 7.1 45.9 70.7 15.9 3.8 32.7 2 8 41 2.3 0.4 1.6 2 6.3 1.3 0.5 2.1 0.2 0.3 56 Fresh (2 ) Y M exico 0 100 19.8 63.7 5.9 11.7 37.5 68.3 10.1 2.9 26.5 2.8 11.1 41
3.1 0.1 0.7 1 5.2 3.5 0.5 10.7 0.4 0.3 57 Hay (19 ) Brazil 0 100 88.8 75.2 5.9 5.9 38.2 5 33.7 10.5 0 1.4 7.2 98
4.3 1.2 1.7 3.1 10.5 2.2 0.6 2.1
Pa ng olagra ss (Di gitari a d ecu m ben s)
58 Fresh M exico 2-01-668 0 100 26.8 69.5 7.5 8.9 41.9 36.3 32.5 5.4 28.2 2.4 8.6 41 59 Fresh (3 ) N M exico 2-01-668 0 100 26.8 70 7.3 7 36.7 38.3 31.3 6.1 31.5 1.8 8 41
0.7 0.3 2.3 4.6 2 1.9 0.7 3.1 0.6 0.7 60 Hay (5 ) Brazil 1-01-667 0 100 88.9 72.3 9.6 7.3 30.9 96 38.2 16.4 6 2.3 6.9 98 61 Hay (2 ) Ho ndura s 1-01-667 0 100 89.9 63.9 7.2 14.2 29.6 96 42.9 8.1 6 1.6 13.8 98
3.3 0.9 0.3 4.7 3.9 9.6 4.2 0.8 62 Hay (13 ) Flo rid a 1-01-667 0 100 89.7 76.8 9 8.7 14.1 96 66.8 22.9 6 1.6 7.5 98
0.5 4.9 1.3 3.3 4 4.4 6.8 2
63 Pasture (3 ) Ho ndura s 0 100 90.2 65.5 5.5 11.1 42.2 5 34.5 10.8 0 3 10 41
2.9 3.7 0.5 5.9 7.5 4 2.6 1.3
Paspalum (Pa spa lum fasci cul atum)
64 Fresh (2 ) Y Mexico 0 100 18.5 63.5 5.7 11.9 15.1 87.1 41.9 6.5 55.8 1.2 14.2 41 0.8 0.2 0.2 0.5 6.1 2.5 0.5 11.4 0.1 1.3 65 Hay (8 ) Flo rid a 1-00-462 0 100 89.4 80.8 7.3 9.9 12.7 25.4 75 29.7 6 1.6 5.5 98
0.2 2.4 0.9 3.1 3.1 4.2 18.1 0.4
Pea rlmillet (Pe nni setum a meri can um)
66 Grai n (2 ) Brazil 4-03-118 100 0 88 27.3 7.1 15.1 53 19 32.8 18.9 90 3.8 2 34
0.4 0.1 0.8 0.1
Perennial s oy (N eonoto nia wig htii )
67 Fresh (2 ) Brazil 0 100 33.2 57.2 19.9 15.8 28 96 4.6 4.3 10 3.4 8 92
8 0.1 3.1 0.8
68 Hay (5 ) Brazil 0 100 90.1 51.6 22.9 15.4 33.7 96 24.8 9.9 10 3.2 8 92
1.9 3.4 1.1 1.9 6.2 0.6 1.9 1 1.5
1Values are mean, standard deviation, and sample size, respectively. Number in parenthesis after the feed name is the sample size if it was
the same across all fractions of the feed.
2 Fert = Fertilization (Yes/No), IFN = International Feed Number, and Conc = Concentrate. Symbols for all tables are (*) composition was
estimated at 80% of feed 18 (corn grain) and 20% of feed 21 (corn silage) and (#) composition was estimated at 50% of feed 18 (corn grain) and 50% of feed 21 (corn silage).
Fee d Nam e Fer t2 Ori gi n IFN2 C onc2 Forag e D M ND F Lig ni n CP SolCP NPN NDF IP ADF IP CHO:B1 EE Ash e ND F %D M %D M %AF %D M %ND F %D M %CP %S olCP %CP %CP %NSC %D M %D M %ND F 6 9 Bedd ing (47 ) Brazil 5-05-587 6 5 3 5 8 2 39.1 9.4 20.4 4 6 2.1 7 1 2 9.2 8 1.3 18.5 4 1
5.1 4.3 2.7 0.6 7.9
70 Manur e Brazil 5-14-015 65 35 84 16 2.3 15.8 53 19 7 4 90 0.5 49.8 34 Se tar ia, Go ld en Ti mothy, Ka za ngula(Se taria spha cel ata)
71 Hay (3 ) Brazil 0 100 92.2 66.9 3.8 12.1 18.4 5 45.9 5.1 0 3 8.2 98
0.4 8.1 0.4 4.8 2 10 0.1 1.7
Sig nalgrass(Bra chi ari a d ecu m ben s)
72 Fresh Brazil 0 100 28.9 75.8 7.5 7.2 42 4.8 2.1 0.8 5 1.2 8.2 41 73 Fresh (3 ) N M exico 0 100 23.2 71.3 6.3 7.1 46.6 68.6 15.8 4.3 24.8 1.8 7.9 41
3.6 4.8 0.7 2.8 2.9 5.6 0.8 1.8 3.7 0.3 0.5 74 Fresh (2 ) Y Mexico 0 100 20.1 67.1 6.5 8.9 40.4 64.7 10.6 4.5 21.2 2 10.3 41
3.3 1 1.8 1.9 13.9 0.7 0.5 2 2
75 Hay (8 ) Brazil 0 100 88.8 84.2 10 5.5 38.5 5 13.3 6.1 0 2.3 7 98
3.3 13.1 0.6 2.1 16.5 7.7 1.9 2.7 Sir atro(Macroptil iu m atr opu pure um)
76 Hay Brazil 0 100 92 47.5 22.7 18.8 28.7 96 16 8 10 3 8.2 92
Sorghum (Sorg hum vulg are , Sorg hum b icolo r)
77 Grai n cracke d Brazil 4-04-383 100 0 87.2 24.2 9.2 9.9 12 33 1.9 0.1 100 8.7 0.9 34 78 Gra in whole (3 ) Brazil 4-04-383 100 0 88.2 11.2 2.22 8.9 13 41.9 15 5 90 5.1 2 60
0.8 1.2 2.7 1
79 Gr ai n M exico 4-04-383 100 0 87.4 10.3 12.8 10.4 14.9 33 33.9 5 90 3.6 3 34 80 Residue (3 ) Ho ndura s 0 100 88.2 66.2 10 8.8 51.3 96 20.9 12.8 6 2.3 11.1 98
0.6 10.7 2.1 4.6 15.6 2.9 1.5 4.4
81 Silag e Brazil 3-04-323 20 80 28.8 61.6 9.4 6.2 45 100 19.6 16.8 100 3.5 5.3 81
5.2 11.5 0.1 1.6 1.5 1.3
31 6 2 31 1 1 29 29
82 Silag e Ho ndura s 3-04-323 20 80 89.4 69.6 10.2 3.2 34.4 100 34.4 18.8 100 2.64 10.6 81 So yb ean (Glyci ne m a x)
83 Grai n (3 ) Brazil 5-04-610 100 0 91.6 19.1 1.54 40.5 44 22.7 4 3 90 23.1 4.9 100
0.8 1.2 3.4 0.3
84 Hulls Brazil 100 0 89.8 62.7 3.2 13.4 18 72 21.1 5.8 90 2 5.5 2
0.9 4.2 1.1 2.8 0.1 1 0.5
5 4 3 5 1 3 5 5
85 M eal Brazil 5-04-600 100 0 88.7 14.1 19 47 35.9 11.1 2.8 1.6 90 5.5 6.2 23
1.4 1.7 12.8 4.5 1.5 0.9 7.1 1.1
19 4 3 19 1 1 3 3 16 18
86 M eal M exico 5-04-600 100 0 89 11.4 0.9 52.6 16 55 5.5 2 90 2 7 23 87 Resi due Brazil 100 0 89.4 28.5 9.1 23.4 12.7 2.17 15.1 6.4 8 8.7 8.2 41
1.8 11.5 3.1 8.6 6.9 13 2.6 4.2 3.1
22 3 2 22 2 2 2 22 22
88 Straw (3 ) Brazil 1-04-567 0 100 87.4 56.8 1.9 11.9 70 100 33.3 27 100 2.8 10.5 65
4.4 1.1 0.7 6.1
Sta rgra ss (Cyno don p le cto stach yu s)
89 Fresh (3 ) N M exico 0 100 30.2 76.8 7.6 6.7 35.6 31.4 42.7 10.8 28 1.1 7.7 41 3.8 2.7 0.2 12.5 11.1 1.1 4 2 0.1 0.3 90 Fresh (2 ) Y M exico 0 100 21.5 71.6 7.3 10 35.7 40.1 34 8 22.6 1.6 11 41
2.5 0.2 1.3 2.5 7 3.6 1.6 4.6 0.2 Sug arcane (Saccha rum offi ci narum)
91 Baga sse Brazil 1-04-686 0 100 15.6 75.6 11.3 2.6 20 95 75 65 100 1.8 1.9 100 92 Fresh (10 ) Brazil 2-04-689 0 100 29.7 57.1 11 2.5 55 100 16 9 0 1.4 2.9 81
3.5 0.5 1.2 1
93 Bag asse,hi droli ze d Brazil 0 100 46.9 61.4 15.8 1.8 42 5 45.8 50.4 0 1.4 4.6 41
3.4 3.2 2.2 1.3 20.6 2 2.5
20 3 2 12 1 3 10 21
Wheat (Triticum spp.)
94 Hay (2 ) Brazil 1-05-172 0 100 89 55 3.5 4.1 20 95 75 65 100 0.9 6.1 98
0.3 3.8 0.2 4.3
95 Mid dling Brazil 100 0 88.3 43 11.2 17.6 53 19 3 0.5 90 5.3 5.6 34 Yea st (Sa ccharom yces cerevi sa e)
96 Dry (9 ) Brazil 7-05-533 100 0 91.7 11 0 31.9 44 22.7 22.3 3.2 90 0.4 6.7 10
Table 3 - Carbohydrate and protein degradation rates (%/h), total digestible nutrients (%DM), and undegraded intake protein (%CP) of typical tropical feeds.
D egrada tio n rate s (kd, %/h) Total di gesti ble nutrie nts1 (%) UIP
(%C P)
Carbohyd rate Protei n Tab ular We iss CNC PS
Fee d A B1 B2 B1 B2 B3 1x 1x 1x 2x 1x 2x
1 22.1 22.1 7.5 135 11.0 8.7 56 55.0 55.9 51.5 23.7 29.5
2 26.8a 26.8a 8.3b 150 9.0 3.6c 56 43.7 45.5 43.0 15.6 20.6
3 26.8a 26.8a 8.3b 150 11.0 3.6c --- 57.2 56.7 55.3 24.2 27.8
4 18.4 18.4 5.5 135 11.0 6.1 58.7 53.7 51.2 46.7 32.3 38.6
5 26.8a 26.8a 8.3b 135 11.0 3.6c 53 49.8 56.3 52.4 16.9 22.0
6 13.1a 13.1a 6.2b 43 5.1 6.8c 51 54.0 57.1 53.0 21.3 26.2
7 13.1a 13.1a 6.2b 43 5.1 6.8c 52 48.1 50.3 46.2 37.1 41.6
8 17.7a 17.7a 6.7b 135 11.0 5.0c 53.1 56.6 59.8 55.8 25.1 29.7
9 0.0 0.0 0.0 75 3.0 0.1 66 88.6 92.3 92.3 34.0 43.2
10 300 38.0 6.0 150 6.0 0.5 70.7 70.6 65.6 62.1 55.2 61.5
11 300 38.0 6.0 150 8.0 0.5 70 80.3 72.1 69.4 68.0 72.2
12 13.1a 13.1a 6.2b 135 10.0 6.8c 53.7 52.5 51.1 47.1 38.4 43.3
13 17.7a 17.7a 6.7b 150 9.0 5.0c --- 52.6 50.0 48.6 26.6 31.8
14 300 40.0 8.0 300 12.0 0.4 --- 80.0 76.2 75.0 44.9 49.9
15 300 40.0 8.0 300 12.0 0.4 87 77.6 74.6 73.0 38.2 43.3
16 13.1a 13.1a 6.2b 135 11.0 6.8c 60 50.6 49.4 45.3 32.4 36.6
17 150 15.0 5.0 50 2.9 0.2 95 87.9 84.0 82.2 32.3 39.7
18 300 35.0 6.0 135 10.0 0.2 95 89.0 84.3 81.9 35.8 43.3
19 242 33.0 6.0 127 8.3 0.2 88 79.7 78.4 76.7 32.0 38.1
20 155 30.0 6.0 115 5.8 0.2 55.4 75.0 72.7 70.0 28.9 34.0
21 10 25.0 6.0 94 1.5 0.2 65.2 65.4 64.6 61.1 25.0 28.5
22; 10 25.0 6.0 300 10.0 0.2 61 59.5 58.8 55.4 26.8 29.5
23 300 25.0 3.0 187 9.9 0.2 68 62.2 56.5 54.4 31.4 38.3
24 300 25.0 3.0 175 8.0 0.3 71.8 79.7 71.6 70.3 35.7 42.9 25 26.8a 26.8a 8.3b 150 9.0 3.6c --- 68.7 67.3 66.7 28.5 33.4
26 13.2 13.2 7.1 135 11.0 6.7 55 57.2 57.5 53.0 30.7 37.0
27 14.4 14.4 7.4 135 11.0 9.9 55 57.9 58.4 54.4 27.4 33.7
28 13.1a 13.1a 6.2b 43 5.1 6.8c 46 51.5 53.9 49.8 28.2 33.9
29 17.7a 17.7a 6.7b 150 9.0 5.0c --- 61.6 58.7 58.0 28.8 33.5
30 9.8 9.8 7.4 135 11.0 6.6 53 53.7 54.6 50.2 27.2 32.2 31 8.3 8.3 6.8 135 11.0 11.0 53 54.1 53.9 49.8 25.9 31.3 32 13.1a 13.1a 6.2b 135 11.0 6.8c 47.4 56.3 58.7 54.9 31.6 37.9
33 13.1a 13.1a 6.2b 135 11.0 6.8c 48 52.6 55.0 51.3 20.3 25.0
34 13.1a 13.1a 6.2b 200 14.0 6.8c 61 55.8 54.7 50.6 29.5 35.0
35 17.7a 17.7a 6.7b 175 12.0 5.0c 50 54.2 53.3 48.9 25.7 28.6
36 17.7a 17.7a 6.7b 175 12.0 5.0c 54 48.9 47.4 43.9 30.7 34.8
37 13.1a 13.1a 6.2b 135 3.5 6.8c 48.4 55.3 58.0 53.9 27.1 33.0
38 17.8 17.8 7.5 135 11.0 2.6 --- 52.7 53.8 49.5 24.7 28.7
39 18.6 18.6 7.9 135 11.0 3.2 --- 52.8 54.4 50.2 23.5 28.3
40 13.1a 13.1a 6.2b 135 3.5 6.8c --- 52.7 55.9 51.5 29.8 34.3
41 17.7a 17.7a 6.7b 150 9.0 5.0c 50 50.8 48.1 46.6 34.1 38.8
42 17.7a 17.7a 6.7b 135 3.5 5.0c 48.9 47.5 44.1 42.1 31.0 35.9
43 25.5 25.5 8.2 135 11.0 3.4 --- 54.8 56.8 52.3 26.1 30.5
44 22.9 22.9 8.1 135 11.0 3.1 --- 53.7 55.4 51.2 24.9 29.5 45 0.0 0.0 0.0 150 5.0 0.1 89 68.2 71.3 71.3 32.2 41.1
46 0.0 0.0 0.0 150 6.0 0.1 --- 63.7 66.7 66.7 29.8 38.2
1Tabular TDN are observed values from the literature review. Weiss TDN at 1x is predicted by Weiss et al. (1992) equation. Intestinal
digestibilities for carbohydrate (A, B1, and B2) and protein (B1, B2, and B3) fractions are 100, 75, 20, 100, 100, and 80% respectively.
a, b, c Recommended ranges of degradation rates for carbohydrate A/B1, B2, and protein B3, respectively, are listed in Table 5.
D egradatio n rate s (kd, %/h) Total di gesti ble nutrie nts1 (%) UIP
(%C P)
Carbohyd rate Protei n Tab ular We iss CNCPS
Fee d A B1 B2 B1 B2 B3 1x 1x 1x 2x 1x 2x
49 10.6 10.6 8.0 135 11.0 7.3 56 54.9 56.7 52.4 25.7 31.6
50 26.8a 26.8a 8.3b 135 3.5 3.6c 46.2 49.4 55.3 51.5 16.0 21.2
51 26.8a 26.8a 8.3b 70 1.7 3.6c 55.9 49.7 51.8 47.8 16.6 21.4
52 13.1a 13.1a 6.2b 135 11.0 6.8c 61.3 53.3 55.4 51.8 24.9 29.4
53 10.0 20.0 5.0 175 12.0 1.5 56.7 46.4 41.7 37.5 44.7 46.4
54 34.8 34.8 8.6 132 11.0 0.3c 50 51.1 53.9 49.7 19.8 24.7
55 34.8 34.8 8.6 135 11.0 6.3 50 58.6 60.8 56.6 19.2 23.6
56 20.0 20.0 8.2 135 11.0 4.9 50 57.5 59.3 55.4 20.8 25.9
57 17.7a 17.7a 6.7b 135 3.5 5.0c 52.7 55.1 59.0 54.7 25.1 29.4
58 19.7 19.7 5.3 135 11.0 5.3 54 55.6 52.9 48.6 24.7 29.7
59 22.4 22.4 5.2 135 11.0 3.9 54 55.2 52.2 47.9 28.1 33.3
60 13.1a 13.1a 6.2b 135 11.0 6.8c 59.9 53.0 55.1 51.4 29.1 33.1
61 13.1a 13.1a 6.2b 135 11.0 6.8c 51 52.7 54.6 51.1 24.6 29.6
62 13.1a 13.1a 6.2b 135 11.0 6.8c -- 50.8 52.7 48.9 39.3 44.2
63 17.7a 17.7a 6.7b 135 12.0 5.0c 61 58.8 58.3 54.3 29.0 33.6
64 9.8 9.8 6.3 135 11.0 6.4 -- 53.5 52.3 48.3 32.2 39.0
65 13.1a 13.1a 6.2b 135 11.0 6.8c -- 53.3 55.3 51.1 45.0 49.6
66 17.7a 17.7a 6.7b 300 12.0 5.0c 71 82.0 74.2 71.0 32.4 35.9
67 26.8a 26.8a 8.3b 65 11.0 3.6c 57.5 51.9 52.0 50.0 19.8 24.8
68 17.7a 17.7a 6.7b 150 9.0 5.0c 54.8 53.7 51.0 49.6 25.7 30.2
69 350 45.0 10.0 200 18.0 2.0 --- 54.9 56.1 54.1 25.0 29.4
70 300 40.0 8.0 300 12.0 0.4 --- 37.0 36.2 34.9 21.3 25.6
71 13.1a 13.1a 6.2b 135 8.0 6.8c 61 63.1 65.4 61.4 25.2 31.4
72 250 30.0 3.0 78 1.2 0.9 60 51.3 41.8 37.2 17.7 22.7
73 26.8a 26.8a 8.3b 135 11.0 3.6 60 55.8 57.9 53.7 20.8 25.1
74 25.6 25.6 8.1 135 11.0 3.1 60 55.1 56.8 52.7 21.6 26.3
75 26.8a 26.8a 8.3b 96 1.9 3.6c 55.1 47.0 53.2 49.3 19.0 23.2
76 26.8a 26.8a 8.3b 150 9.0 3.6c 52.5 55.7 54.0 52.7 25.3 30.2
77 250 20.0 8.0 35 13.0 0.1 81 88.6 83.4 80.1 30.5 38.9
78 150 15.0 5.0 150 5.0 0.1 81 90.3 81.0 77.5 39.1 46.1
79 14.3 14.3 6.0 135 6.0 0.1 81 86.6 77.1 74.0 51.2 56.5
80 250 30.0 3.0 135 11.0 0.1 --- 51.0 45.6 41.8 26.6 28.6
81 10.0 20.0 5.0 300 8.0 0.2 61.2 60.7 58.4 54.5 27.6 30.3
82 10.0 20.0 5.0 300 8.0 0.2 62 50.2 48.5 44.4 40.4 42.9
83 300 30.0 5.0 200 10.0 0.2 89 108.9 106.4 104.8 21.1 26.5
84 350 40.0 8.0 150 12.0 0.2 68 66.3 62.5 57.8 42.0 48.1
85 300 45.0 6.0 238 8.4 0.4 68.4 82.9 82.8 82.1 24.9 31.4
86 7.9 7.9 5.7 230 11.0 0.2 87 83.0 82.2 80.9 32.6 40.3
87 350 45.0 10.0 200 20.0 2.0 58.4 80.6 79.7 78.2 36.4 44.0
88 300 50.0 10.0 300 10.0 0.5 53.6 64.7 66.1 62.6 31.7 31.7
89 13.1 13.1 3.4 135 11.0 5.2 56 51.5 43.5 38.9 30.9 35.9
90 13.2 13.2 4.2 135 11.0 5.3 56 51.5 46.4 42.0 27.9 33.0
91 250 30.0 3.0 135 11.0 0.1 45 53.7 47.1 42.8 75.7 76.1
92 275 25.0 4.0 300 10.0 0.2 65.5 61.1 57.2 54.0 22.5 24.8
93 250 30.0 10.0 135 10.0 0.2 59 53.2 52.9 50.3 53.7 54.8
94 250 50.0 8.0 135 11.0 0.1 --- 65.8 65.9 62.5 75.9 76.3
95 300 35.0 5.0 113 4.0 0.8 75 70.3 66.6 63.8 18.1 23.0
Table 4 - Amino acid composition of typical tropical feeds (%CP).
Fee d MET LYS ARG THR LEU ILE VAL HIS PHE TRP
1 0.67 2.83 2.83 2.83 5.49 2.83 3.83 1.00 3.50 4.50
2 0.83 6.13 4.92 3.81 6.85 5.30 4.03 1.71 4.36 1.05
3 1.22 3.21 2.44 3.30 6.40 3.13 Ñ- 0.63 4.18 1.84
4 0.67 2.83 2.83 2.83 5.49 2.83 3.83 1.00 3.50 4.50
5 0.67 2.83 2.83 2.83 5.49 2.83 3.83 1.00 3.50 4.50
6 0.67 2.83 2.83 2.83 5.49 2.83 3.83 1.00 3.50 4.50
7 0.67 2.83 2.83 2.83 5.49 2.83 3.83 1.00 3.50 4.50
8 0.67 2.83 2.83 2.83 5.49 2.83 3.83 1.00 3.50 4.50
9 1.28 8.23 4.28 4.70 12.75 1.35 8.40 5.16 7.02 4.70
10 1.78 3.36 4.76 3.53 9.62 5.94 6.05 2.06 5.52 1.40
11 1.30 7.00 --- 4.70 7.00 6.10 5.80 2.00 3.80 1.40
12 0.67 2.83 2.83 2.83 5.49 2.83 3.83 1.00 3.50 4.50
13 0.67 2.83 2.83 2.83 5.49 2.83 3.83 1.00 3.50 4.50
14 1.33 3.33 4.67 2.67 4.67 3.00 3.67 3.00 1.00 0.67
15 1.50 3.67 5.17 3.17 4.61 2.69 4.50 1.87 2.80 1.10
16 0.67 2.83 2.83 2.83 5.49 2.83 3.83 1.00 3.50 4.50
17 1.12 1.65 1.82 2.80 10.73 2.69 3.75 2.06 3.65 0.37
18 1.92 3.27 4.71 3.94 12.98 3.85 5.19 2.98 1.92 3.37
19 0.68 3.47 3.54 3.26 6.24 3.47 4.49 1.32 4.06 3.97
20 1.38 3.84 7.93 3.08 5.32 3.21 4.23 3.11 2.73 0.98
21 5.30 5.18 11.69 4.34 11.20 3.01 5.42 2.53 4.34 3.61
22 5.30 5.18 11.69 4.34 11.20 3.01 5.42 2.53 4.34 3.61
23 1.43 4.34 11.19 3.49 5.97 3.42 4.79 3.22 4.45 1.30
24 0.63 3.85 10.40 3.45 6.33 3.77 5.27 3.14 5.85 1.74
25 0.73 6.02 6.39 5.00 9.26 6.01 7.14 2.62 6.32 1.84
26 0.67 2.83 2.83 2.83 5.49 2.83 3.83 1.00 3.50 4.50
27 0.67 2.83 2.83 2.83 5.49 2.83 3.83 1.00 3.50 4.50
28 0.67 2.83 2.83 2.83 5.49 2.83 3.83 1.00 3.50 4.50
30 2.05 5.56 4.85 4.72 8.41 4.25 6.59 1.8 5.34 2.2
31 2.05 5.56 4.85 4.72 8.41 4.25 6.59 1.8 5.34 2.2
32 2.05 5.56 4.85 4.72 8.41 4.25 6.59 1.8 5.34 2.2
33 2.05 5.56 4.85 4.72 8.41 4.25 6.59 1.8 5.34 2.2
34 2.05 5.56 4.85 4.72 8.41 4.25 6.59 1.8 5.34 2.2
35 2.05 5.56 4.85 4.72 8.41 4.25 6.59 1.8 5.34 2.2
36 2.05 5.56 4.85 4.72 8.41 4.25 6.59 1.8 5.34 2.2
37 2.45 7.1 5.89 5.94 10.76 5.11 7.54 2.28 6.44 2.96
38 0.67 2.83 2.83 2.83 5.49 2.83 3.83 1.00 3.50 4.50
39 0.67 2.83 2.83 2.83 5.49 2.83 3.83 1.00 3.50 4.50
40 0.67 2.83 2.83 2.83 5.49 2.83 3.83 1.00 3.50 4.50
41 1.80 4.40 4.00 4.20 6.70 3.90 4.50 2.70 4.20 2.40
42 1.40 6.70 6.40 4.60 9.00 5.00 5.80 2.70 5.40 4.50
43 0.67 2.83 2.83 2.83 5.49 2.83 3.83 1.00 3.50 4.50
44 0.67 2.83 2.83 2.83 5.49 2.83 3.83 1.00 3.50 4.50
45 0.84 5.60 8.28 2.52 5.46 2.43 3.67 1.44 3.03 0.00
47 0.84 5.60 8.28 2.52 5.46 2.43 3.67 1.44 3.03 0.52
Fee d MET LYS ARG THR LEU ILE VAL HIS PHE TRP
49 0.67 2.83 2.83 2.83 5.49 2.83 3.83 1.00 3.50 4.50
50 0.67 2.83 2.83 2.83 5.49 2.83 3.83 1.00 3.50 4.50
51 1.40 3.10 2.10 3.80 6.20 4.70 5.90 1.90 7.30 0.60
52 0.67 2.83 2.83 2.83 5.49 2.83 3.83 1.00 3.50 4.50
53 0.67 2.83 2.83 2.83 5.49 2.83 3.83 1.00 3.50 4.50
54 2.25 6.02 5.04 4.94 8.66 4.55 6.8 2.01 5.58 2.1
55 2.25 6.02 5.04 4.94 8.66 4.55 6.8 2.01 5.58 2.1
56 2.25 6.02 5.04 4.94 8.66 4.55 6.8 2.01 5.58 2.1
57 2.25 6.02 5.04 4.94 8.66 4.55 6.8 2.01 5.58 2.1
58 1.33 3.43 3.12 3.27 5.11 2.8 4.43 1.23 3.18 1.38
59 1.33 3.43 3.12 3.27 5.11 2.8 4.43 1.23 3.18 1.38
60 1.33 3.43 3.12 3.27 5.11 2.8 4.43 1.23 3.18 1.38
61 1.33 3.43 3.12 3.27 5.11 2.8 4.43 1.23 3.18 1.38
62 1.33 3.43 3.12 3.27 5.11 2.8 4.43 1.23 3.18 1.38
63 1.33 3.43 3.12 3.27 5.11 2.8 4.43 1.23 3.18 1.38
64 0.67 2.83 2.83 2.83 5.49 2.83 3.83 1.00 3.50 4.50
65 0.67 2.83 2.83 2.83 5.49 2.83 3.83 1.00 3.50 4.50
66 1.87 2.95 4.68 3.67 9.64 3.60 4.39 2.16 4.60 0.86
67 1.45 4.86 4.16 3.43 6.41 3.45 4.29 1.64 4.05 1.3
68 1.45 4.86 4.16 3.43 6.41 3.45 4.29 1.64 4.05 1.3
69 0.48 1.73 1.60 1.80 3.06 1.94 2.48 0.78 1.70 2.04
70 0.57 1.80 1.84 1.87 2.97 1.80 2.51 0.85 1.70 2.01
71 0.67 2.83 2.83 2.83 5.49 2.83 3.83 1.00 3.50 4.50
72 0.67 2.83 2.83 2.83 5.49 2.83 3.83 1.00 3.50 4.50
73 0.67 2.83 2.83 2.83 5.49 2.83 3.83 1.00 3.50 4.50
74 0.67 2.83 2.83 2.83 5.49 2.83 3.83 1.00 3.50 4.50
75 0.67 2.83 2.83 2.83 5.49 2.83 3.83 1.00 3.50 4.50
76 0.73 6.02 6.39 5.00 9.26 6.01 7.14 2.62 6.32 1.84
77 1.26 2.44 3.87 3.28 13.36 3.87 4.71 2.27 5.13 0.84
78 1.26 2.44 3.87 3.28 13.36 3.87 4.71 2.27 5.13 0.84
79 1.26 2.44 3.87 3.28 13.36 3.87 4.71 2.27 5.13 0.84
80 0.67 2.83 2.83 2.83 5.49 2.83 3.83 1.00 3.50 4.50
81 0.75 3.61 7.07 2.26 4.29 3.01 2.78 1.35 2.78 0.75
82 0.75 3.61 7.07 2.26 4.29 3.01 2.78 1.35 2.78 0.75
83 1.24 6.73 7.23 4.35 7.57 4.78 5.04 2.85 5.28 1.21
84 0.47 4.54 4.72 2.74 4.86 2.46 3.30 1.84 2.99 0.67
85 1.42 6.17 6.79 3.79 7.11 5.33 4.89 2.42 4.71 1.40
86 1.42 6.17 6.79 3.79 7.11 5.33 4.89 2.42 4.71 1.40
87 0.73 6.02 6.39 5.00 9.26 6.01 7.14 2.62 6.32 1.84
88 1.73 3.65 1.73 3.94 6.35 3.65 5.48 1.83 3.94 1.35
89 1.77 4.59 4.21 4.03 6.78 3.47 5.24 1.46 3.96 1.63
90 1.77 4.59 4.21 4.03 6.78 3.47 5.24 1.46 3.96 1.63
91 0.67 2.83 2.83 2.83 5.49 2.83 3.83 1.00 3.50 4.50
92 0.80 2.13 1.87 2.13 6.40 2.40 3.20 1.07 2.94 0.11
93 0.67 2.83 2.83 2.83 5.49 2.83 3.83 1.00 3.50 4.50
94 0.67 2.83 2.83 2.83 5.49 2.83 3.83 1.00 3.50 4.50
95 2.12 2.02 4.38 2.16 7.70 3.84 0.00 1.80 5.86 1.28