Printed in Brazil - ©2007 Sociedade Brasileira de Química 0103 - 5053 $6.00+0.00
ArticleArticleArticleArticleArticle
*e-mail: [email protected]
Manganese Determination by GFAAS in Feces and Fish Feed Slurries
Vanessa Rosa Loureiro,aMayra A. D. Saleh,a Paula M. Moraes,a Renato C. F. Neves,b Fabio A. Silva,b Cilene C. F. Padilhacand Pedro M. Padilha*,a
a
Instituto de Biociências, Departamento de Química e Bioquímica, Universidade Estadual Paulista, CP 510 18618-000 Botucatu-SP, Brazil
b
Faculdade de Medicina Veterinária e Zootecnia, Departamento de Melhoramento e Nutrição Animal, Universidade Estadual Paulista, CP 560 18618-000 Botucatu-SP, Brazil
c
Instituto de Biociências, Departamento de Física e Biofísica, Universidade Estadual Paulista, CP 510 18618-000 Botucatu-SP, Brazil
Neste trabalho, um método simples, rápido e sensível, é proposto para determinação de manganês em amostras de fezes e rações de peixes por espectrometria de absorção atômica em forno de grafite (GFAAS) utilizando-se a introdução direta de suspensões das amostras no tubo de grafite. Os limites de detecção (LOD) e de quantificação (LOQ) calculados em relação a 20 leituras do branco das suspensões (0,50 % m/v de fezes ou ração isentas de manganês) foram de 28 e 92 µg kg–1 para as suspensões padrão de fezes e de 34 e 110 µg
kg–1 para as suspensões padrão de ração. O método proposto foi aplicado em estudos de
biodisponibilidade de manganês em diferentes amostras de rações de peixes e os resultados mostraram-se de acordo com os resultados obtidos utilizando-se amostras previamente mineralizadas por digestões ácidas em forno de microondas.
This paper presents a simple, fast and sensitive method to determine manganese in samples of feces and fish feed by graphite furnace atomic absorption spectrometry (GFAAS) by the direct introduction of slurries into the graphite tube. The limits of detection (LOD) and quantification (LOQ) calculated for 20 readings of the blank of the standard slurries (0.50 % m/v of feces or feed devoid of manganese) were 28 and 92 µg kg-1 for the standard
feces slurries and 34 and 110 µg kg-1 for the standard feed slurries. The proposed method
was applied in bioavailability studies of manganese in different fish feeds and their results proved compatible with those obtained for samples mineralized by acid digestion using microwave oven.
Keywords: slurries samples, GFAAS, chemical modifier, manganese determination
Introduction
Manganese is important for fish and is widely distributed in fish and animal tissue. The mitochondria have a greater concentration of manganese than cytoplasm or other cell organelles. Manganese is necessary for the normal functioning of brain and for proper lipid and carbohydrate metabolism. Manganese activates specific enzymes such as glycosyltransferase and non-specific enzymes such as kinases, transferases, hydrolases and decarboxylases. The activation of leucine aminopeptidase by manganese has been demonstrated in sole. An inadequate supply of
manganese usually results in retardation of growth.The
importance of manganese has been recognized in broodstock nutrition. The manganese content of the diet influences its level and that of other trace elements in
gonads.1-5 The absence of manganese in a fish meal diet
significantly influenced the mineral composition of common carp gonads. The eggs produced by broodstock of brook trout and rainbow trout fed fish meal diets lacking manganese contained only low levels of this trace metal
and subsequently hatchability was poor.6-9
determination of metallic analytes in slurries by graphite furnace atomic absorption spectrometry shows that it is a robust technique. It provides several advantages, such as, high sensitivity, detection limits extremely low, the use of small sample volumes, determination of a wide variety of trace elements, etc. Considering also that the atomizer can act as a chemical reactor, the possibility of making solid sampling presents some advantages over the conventional digestion procedures. Besides eliminating the stage of total previous decomposition of sample, it diminishes the sample preparation time, decreases the analyte losses for excessive manipulation or retention on insoluble products, reduces the possibility of sample contamination, and mainly minimizes
the action of dangerous acids on the analyst. 10-14
Taking into account theses acpects, this work describes the development of a method to determine manganese in slurries of fish feed and feces samples by GFAAS that eliminates the sample’s mineralization step and allows for an estimate of its bioavailability.
Experimental
Reagents, standard solutions and samples
High purity deionized water (18.2 MΩ cm-1) obtained
with an Elga Ionic system (PURELAB Option, USA), pure nitric acid (Merck P.A.), hydrogen peroxide (Merck) and Triton X-100 (Merck) were used throughout this work. The solution containing tungsten, which was employed to coat the inside of the graphite tube and used as a permanent modifier, was prepared by diluting a stock
solution containing 1000 mg L-1 of sodium tungstate
(Merck) with ultrapure water. The Pd(II) solution, also employed as a chemical modifier, was made in the same way, utilizing palladium nitrate (Merck) instead.
Stock solutions of the analytes were prepared from reagents of spectroscopic purity (Johnson & Matthey, Royston, Hertfordshire, UK). The remaining solutions utilized, including the concentrated acid solutions used for mineralizing the samples, were analytical grade. All bottles for storing samples and standard solutions, glassware and containers of the atomic absorption spectrometer’s autosampler were immersed in 10% v/v nitric acid for 24 h, rinsed with ultrapure water and dried before being used.
The fish feces and feed samples were dried at 50 °C in an oven with forced air circulation for 48 h and then cryogenically ground. A mass of approximately 1.0 g of the sample, together with a magnetic bar, were put into a polycarbonate flask, which was then closed and immersed in liquid nitrogen. The impact between the sample and
the magnetic bar, subjected to an oscillating magnetic field
(20 impacts s-1), pulverized the sample. The sample
grinding program consisted of an initial stage of 2 min of prefreezing, 1 min of pulverization, and again 1 min of freezing, followed by a second stage comprising two cycles of two pulverization and freezing stages, making a total of 8 min. This procedure yielded particles with a
granulometry of less than 60 µm.15,16
A portion of the samples was also mineralized in a microwave oven, as follows. Portions of 50 mg of cryogenically ground samples were transferred directly to the Teflon flasks of the microwave oven, and 2.5 mL of
pure nitric acid 14 mol L-1 plus 0.50 mL of hydrogen
peroxide 30% m/m were added. Thereafter, the following power/timer program was run: step 1, 300W/3 min; step 2, 0 W/2 min; step 3, 450 W/5 min, step 4, 550 W/5 min;
step 5, 650 W/5 min; step 6 (ventilation), 0 W/5 min.16
After cooling, the resulting acid digestates were diluted to 50 mL with ultrapure water.
Biological material for preparing the standard slurries
A feed devoid of some metal nutrients was prepared (in the case, devoid of calcium, iron, cobalt, copper, manganese, selenium and zinc). This feed was formulated with dehydrated starch, albumin and premix potassium and magnesium oxides. A lot of Nile Tilapia, Oreochromis niloticus juveniles, was fed with this feed in separate aquarium. The collected excrements were similar to the diets and contained all the metal nutrients. After the collection, the feces were treated as described in the previous item, however, the cryogenic milling was performed after washing exhaustingly with pure
nitric acid 0.10 mol L-1, ultrapure water and drying was
applied as already mentioned.
Slurry sample preparation
After cryogenic grinding, 5 mg of the biological material samples (fish feed or feces) were transferred directly to the containers of the spectrometer autosampler,
to which 5 µL of pure nitric acid 14 mol L-1, 50 µL of
Triton X-100 at 1 % v/v, 100 µL of 1000 mg L-1 of Pd(II)
solutionand 845 µL of ultrapure water were added. The
biological material slurry samples were then sonicated for 40 s directly in the autosampler containers.
Apparatus
For the manganese determinations, a Shimadzu model AA-6800 atomic absorption spectrometer was used, equipped with a background absorption corrector by self-reversal method (SR) system, and a pyrolytic graphite tube with integrated platform and automatic ASC-6100 sampler. A Shimadzu hollow cathode manganese lamp operated with a 10 mA current was also used. The wavelength applied was 279.5 nm and the spectral resolution was 0.5 nm. Argon was used as inert gas at a
constant flow of 1 L min-1 throughout the heating program,
except during the atomization step, when the gas flow was interrupted. The absorbance signals were measured in peak area.
The samples were cryogenically ground in a Spex -Freezer model Mill 6750 cryogenic mill. The slurries of fish feces and feeds were sonicated in a Unique ultrasonic cell disruptor.
Preparation of the graphite tube coated internally with tungsten
The inner walls of the pyrolytic graphite tubes with integrated platform used for determining manganese were coated with tungsten. This was made by injecting aliquots
of 25 µL of a solution containing 1000 mg L-1 of the
sodium tungstate modifier into the atomizer, which was then submitted to the stages of the heating program described in Table 1. This procedure was repeated twenty times. After applying to the heating program described in Table 1, the W(VI) deposited on the graphite tube inner wall, forming a layer of tungsten carbide, acted as a
chemical modifier.17 In this case, the mass of tungsten
deposited was 500 µg. Using this treatment it was possible
to use a graphite tube for up to 572 firings.
Standard slurries preparation
Analytical curves were prepared using fish feed and
feces slurries containing 1, 2, 4, 5 and 10 µg L-1 of
manganese with the absorbance readings performed by
GFAAS. These standard slurries were prepared under the same conditions as those used for preparing the slurries of feed and feces samples, using however, 5 mg of standard samples of biological material devoid of manganese. Thus, to prepare the analytical curves, volumes of 4, 8, 16, 20
and 40 µL of standard solutions containing 250 µg L-1 of
manganese were transferred to the spectrometer autosampler containers before the final volume adjustment
to 1000 µL with ultrapure water, so that the manganese
concentrations in the standard slurries were within the
range of 1 to 10 µg L-1. The standard solutions containing
1 to 10 µg L-1 of manganese in 0.5% v/v pure HNO
3, were
also used for preparing analytical solutions used for manganese determinations in samples of feces and feeds mineralized by microwave-assisted acid digestion.
Analytical procedure
After the sonication step of the sample in slurries and/ or standard slurries directly in the autosampler containers,
a volume of 10 µL of standard or sample was introduced
into the graphite tube (coated internally with tungsten carbide), using the autosampler micropipette. Each measurement was repeated five times. Table 2 describes the heating program of the graphite tube, which was optimized to determine manganese.
Results and Discussion
Optimization of the instrumental conditions
The accuracy and precision of the analytical results in the determination of metals by GFAAS using slurries depends on the optimization of the temperatures of pyrolysis and atomization of the analyte. Therefore, pyrolysis and atomization curves were drawn to determine these parameters for the manganese in
standard slurries of fish feed and feces containing 10 µg
L-1 of Mn, 10 mg L-1 of Pd(II), using the graphite tube
coated internally with tungsten carbide and using the
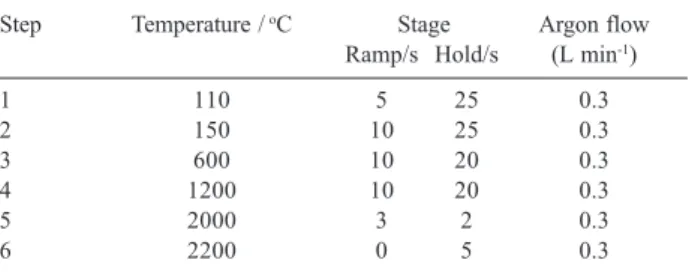
Table 1. Heating program used for coating the inner wall of the graphite tube with tungsten carbide
Step Temperature / oC Stage Argon flow
Ramp/s Hold/s (L min-1)
1 110 5 25 0.3
2 150 10 25 0.3
3 600 10 20 0.3
4 1200 10 20 0.3
5 2000 3 2 0.3
6 2200 0 5 0.3
Initial temperature of furnace, 95 oC
Table 2. Graphite tube heating program optimized for the determination of manganesein slurries of fish feces and feed samples
Step Temperature / oC Stage Argon flow
Ramp/s Hold/s (L min-1)
Drying 150 10 0 1
Drying 250 10 5 1
Pyrolysis 1600 10 5 1
Pyrolysis 1600 5 20 1
Atomization 2400 1 3 0
Cleanup 2800 5 0 1
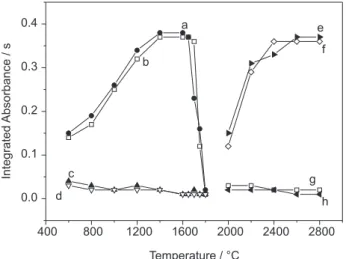
samples preparation conditions previously described. The Figure 1 (curves a, b, e and f) illustrate the influence of the pyrolysis and atomization temperatures on the absorbance signals for manganese in the standard slurries of biological materials. The pyrolysis temperature of 1600 °C was selected because, as Figure 1 (curves a and b) indicates, the absorbance signals obtained for the manganese remained constant in the range 1400-1600 °C, declining rapidly after reaching 1400-1600 °C. As for the atomization temperature (Figure 1, curves e and f), the absorbance signals obtained for the manganese were constant from 2400 °C up for both standard slurries, so the atomization temperature of 2400 °C was selected for all the remaining experiments. Figure 2 (graphics a and b) depicts the analyte absorbance (AA) and background absorbance (BG) signals for the standard slurries of the biological materials. Both Figures show a relatively low background absorbance, indicating the efficiency of Pd and tungsten carbide modifiers in the stage of pyrolysis. The biological materials studied here contained around 0.12 % of magnesium and this element in the matrix may help in the thermal stabilization of manganese, according to the literature. It was already shown for chromium and manganese that the presence of magnesium in the matrix favored the thermal
stabi-lization of this elements.16,18,19
Determination of the optimal sonication time of the slurry samples
Ultrasonic shaking to analyze slurries of solid materials ensures good homogenization of the sample,
allowing for better reproducibility between measurements. Thus, the sample ultrasonication time was evaluated in the interval of 10 to 60 s of agitation. Figure 3 depicts the influence of the sonication time of samples on the absorbance signals obtained for Mn and also the relative deviation standard regarding (RSD) to each ultrasonication time. An analysis of this figure indicates that the absorbance signals remain constant starting from 20 s of sonication. The sonication time of 40 s was considered optimal considering the good absorbance signal obtained but also the RSD among
the measurements was relatively low (1.8%).15,16
Analytical calibration curves
Based on the parameters of pyrolysis and atomization temperatures and the profile of the optimized atomic absorption signal and matrix-matched standards analytical curves were plotted using standard slurries of fish feces and feed containing Mn in the
Figure 1. Pyrolysis and atomization temperature curves for standard samples containing 10 µg L-1 of Mn. Pyrolysis curves (Atomization
tem-perature, 2400 oC): a-Standard slurry feces; b-Standard slurry feed;
c-Stan-dard slurry feces (BG); d-Stanc-Stan-dard slurry feed (BG); Atomization Curves (Pyrolysis temperature, 1600 oC): e-Standard slurry feces; f-Standard slurry
feed; g-Standard slurry feces (BG); h-Standard slurry feed (BG).
400 800 1200 1600 2000 2400 2800
0.0 0.1 0.2 0.3 0.4
h g
f e
d c
b a
Temperature / °C
Integrated
Absorbance
/
s
Figure 2. Transient atomic absorption (AA) and background (BG) sig-nals in the atomization of manganese in standard slurries samples con-taining 10 µg L-1 of Mn. Graphic a) Standard slurry feces; b) Standard
slurry feed.
0 1 2 3 4 5
0.0 0.1 0.2 0.3 0.4 0.5
a
AA
BG
time / s
0 1 2 3 4 5
0.0 0.1 0.2 0.3 0.4 0.5
b
AA
BG
time / s
Integrated
Absorbance
/
s
Integrated
Absorbance
/
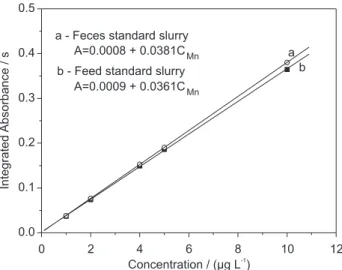
concentration range from 1 to 10 µg L-1 (as described before in Standard slurries preparation). Figure 4 depicts the analytical curves obtained and their respective straight-line equations. A comparison of the analytical curve prepared with fish feces and the one prepared with fish feed indicates that their slopes do not show significant differences (k = 0.0381 for feces, curve a and k = 0.0361 for feed, curve b). Both analytical curves show absorbance values appro-ximately 5-10% lower than the values of the analytical curve obtained from the standard solutions prepared in
the range of 1 to 10 µg L-1 of Mn in 10% v/v pure
HNO3 (straight line equation: A = 0.0031 + 0.0191CMn).
However, the slopes of these straight lines obtained for the standard slurries were about 2-fold greater, attesting to the efficiency of the pyrolysis and atomization steps. An accumulation of carbonaceous residues inside the
graphite tube, causing partial obstruction of the radiation from the hollow cathode lamp, can impair
absorbance measurements.18 Nevertheless, the low
background (BG) signals obtained in the manganese optimization stage of the proposed procedure indicate that the carbon residue left behind by the pyrolysis state did not impair the absorbance measurements. The characteristic masses calculated were 23.15, 24.12 and 20.92 pg for the standard slurry feces, standard slurry
feed and Mn standard solution, respectively.20,21 The
detection limit (LOD) and the quantification limit (LOQ) were calculated based on the standard deviation of 20 readings obtained for the blanks of the standard slurries and the slopes of the analytical curves (LOD =
3σ/slope and LOQ = 10σ/slope). Their values were 28
and 92 µg kg-1 of Mn for the standard slurry feces and
34 and 110 µg kg-1 ofMn for the standard slurry feeds,
respectively.20,21 These results demonstrate that the
proposed method offers an acceptable level of precision. The lifetime of the graphite tube was equivalent to 572 firings. Experiments made using only Pd as modifier led to a graphite tube lifetime of 180 firings. Then, with tungsten carbide deposited on the graphite tube inner wall and introducing Pd together with the sample, it was possible to run a pyrolysis temperature of 1600 °C and the graphite tube lifetime was improved. Considering the complexity of the biological matrices, the tube lifetime with the proposed method is acceptable when compared to other methods described
in the literature.16,18,19 After optimization, the accuracy
of proposed method for the determination of manganese were investigated in slurries of four feed samples enriched with this micronutrient used in the fish diet (Table 3). The accuracy of the results obtained were checked adopting a mineralization of the samples in a microwave oven and they were not statistically different at a 95% confidence level (paired t-test).
Application of the proposed method
After the optimization, the applicability of the newly developed method was tested in the determination of Mn
Figure 3. Influence of ultrasonication time on the manganese absorbance signal and on relative standard deviation (RSD) in the standard slurries on fish feces and feed containing 10 µg L-1 of Mn. Curves a,b –
Ultrasonification time (s) versus Integrated absorbance (s); Curves c,d – Ultrasonification time (s) versus RSD (%).
10 20 30 40 50 60
0.00 0.05 0.10 0.15 0.20 0.25 0.30
Ultrasonication time / s
Integrated
Absorbance
/
s
R
S
D/%
1.7 1.8 1.9 2.0 2.1 2.2 2.3 2.4 2.5 2.6
b,d - Feed standard slurry a,c - Feces standard slurry
d c
a
b
Figure 4. Analytical curve obtained from standard slurry of fish feces and feed contained 1, 2, 4, 5 and 10 µg L-1 of Mn.
0 2 4 6 8 10 12
0.0 0.1 0.2 0.3 0.4 0.5
A=0.0009 + 0.0361CMn b - Feed standard slurry
A=0.0008 + 0.0381CMn a - Feces standard slurry
b a
Concentration / (µg L )-1
Integrated
Absorbance
/
s
Table 3. Mean contents and standard derivations (n=5) obtained for man-ganese in enriched feed samples using the developed procedure with slurry sampling and microwave-assisted acid digestion procedure
Samples feed Slurry sampling Microwave-assisted (mg kg–1) acid digestion (mg kg–1)
in four samples of feed containing different manganese supplements used in the diet of Nile tilapia juveniles and in samples of feces from these fish. Then, based on the
values of the percentage of Cr2O3 and of manganese
determinations on the feeds, a calculation was made to estimate the coefficient of bioavailability of this
micronutrient, using equation 1 .22-24
⎥ ⎦ ⎤ ⎢
⎣ ⎡
⎟⎟ ⎠ ⎞ ⎜⎜ ⎝ ⎛ × ⎟⎟ ⎠ ⎞ ⎜⎜
⎝ ⎛ − =
r %Mn
f %Mn
f O %Cr
r O %Cr 100 100 Da
3 2
3 2
(1)
where:
Da = Apparent digestibility
% Cr2O3 r = Percentage of chromic oxide in the feed
% Cr2O3 f = Percentage of chromic oxide in the feces
% Mnr = Percentage of manganese in the feed
% Mn f = Percentage of manganese in the feces
Table 4 lists the values of the coefficients of bioavailability calculated based on the manganese determinations by the proposed method and by GFAAS after mineralization of the feed samples in a microwave oven. A comparison of the values of the coefficient of bioavailability of manganese present in the four types of feed used in the diet of Nile tilapia juveniles (Table 4) reveals that the values found based on the determinations using the proposed method are congruent with those obtained by the GFAAS method after mineralization of the feed and feces samples in a microwave oven. The GFAAS method is normally used in fish nutrition mineral
bioavailability studies;22-26 hence, our results attest to the
applicability of the proposed method in such studies.
Conclusions
The proposed method for quantifying of manganese using samples of fish feed and feces in the slurry form to estimate the apparent bioavailability of this micronutrient in feeds used in fish nutrition yielded results equivalent to those obtained with the GFAAS quantification method, whose initial step involves the mineralization of samples in a microwave oven. The main advantage of the proposed
method is that it does not generate toxic residues, which can be harmful to the analyst’s health and contaminate the environment. Moreover, since this new method does not require mineralizing the samples, it considerably reduces the time spent on analytical determinations in fish nutrition analyses. In addition it offers limits of detection (LOD) and of quantification (LOQ) in the order
of 28 and 92 µg kg-1,respectively, using only 10 µL of
slurry samples for each analytical determination. The comparison of values of the detection limits calculated by the proposed method with that obtained by the GFAAS
(0.12 µg L-1) using aqueous standard solutions, shows
acceptable sensitivity to the proposed method.
Acknowledgments
The authors gratefully acknowledge the financial support of FAPESP (Brazil) (Processes 03/13362-6, 06/ 51362-6, 06/51556-5 and 06/57149-2) and CAPES for fellowships granted to Fabio Arlindo Silva.
References
1. Clark, J.; Macdonald, N. L.; Stark, J. R.; Aquaculture 1987,
61, 231.
2. Ogino, C.; Yang, G. Y.; Nippon Suisan Gakkaishi 1980, 46, 455. 3. Ishac, M. M.; Dollar, A. M.; Hydrobiology 1968, 31, 572. 4. Satoh, S.; Yamamoto, H.; Takeuchi, T.; Watanabe, T.;
Hydrobiology1983, 49, 425.
5. Knox, D.; Cowey, C. B.; Adron, J. W.; J. Nut. 1981, 46, 495. 6. Watanabe, T.; Satoh, S.; Takeuchi, T.; Aquaculture 1997, 151, 185. 7. Gatlin, I. D. M.; Wilson, R. P.; Aquaculture 1984, 41, 85. 8. Satoh, S.; Takeuchi, T.; Watanabe, T.; Nippon Suisan Gakkaishi
1987, 53, 825.
9. Takeuchi, T.; Watanabe, T.; Ogino, C.; Saito, M.; Nishimura, K.; Nose, T.; Nippon Suisan Gakkaishi 1981, 47, 645. 10. Volynsky, A.; Spectrochim. Acta, Part B 1998, 53, 139. 11. Tsalev, D. L.; Slaveykova, V. I.; Lampugnani, L.; D’ulivo, A.;
Georgieva, R.; Spectrochim. Acta, Part B 2000, 55, 473. 12. Shiue, M. Y.; Mierzwa, J.; Yang, M. H. J.; J. Anal. At. Spectrom.
2001, 16, 1172.
13. Bendicho C.; Loos-Vollebregt, M. T. C.; J. Anal. At. Spectrom.
1991, 6, 353.
Table 4. Coefficient of bioavailability of manganese of Nile tilapia juveniles fed with different food supplements
Feed samples
Yeast Corn Soybean bran Rice bran
Coefficient of bioavailability (%) 75 ± 2* 73± 2# 69 ± 1* 67 ± 1# 73 ± 1* 71± 1# 67 ± 1* 65 ± 1#
14. Liang, Y. Z.; Li, M.; Rao, Z.; Anal. Sci. 1996, 12, 633. 15. Millerihli, N. I.; Fresenius J. Anal. Chem. 1993, 345, 489. 16. Rosa, C. R.; Moraes, M.; Gomes Neto, J. A.; Nóbrega, J. A.;
Nogueira, A. R. A.; Food Chem. 2002, 79, 523.
17. Lima, E. C.; Krug, F. J.; Jackson, K. W.; Spectrochim. Acta, Part B 1998, 53, 1791.
18. Aleixo, P. C.; Nóbrega, J. A.; Santos, D. J.; Muller, R. C. S.;
Quim. Nova 2000, 23, 310.
19. Minami, H.; Yada, M.; Yoshida, T.; Zhang, T. Q.; Inoue, S.; Atsuya, I.; Anal. Sci. 2004, 20, 455.
20. Beaty, R. B.; Kerber, J. D. Concepts, instrumentation and
techniques in atomic absorption spectrometry. Norwalk: The
Perkin Elmer Corporation, 1993.
21. Currie, L. A.; Anal. Chim. Acta 1999, 391, 105.
22. Sa, M. V. D. E.; Pezzato, L. E.; Barros, M. M.; Padilha, P. M.;
Aquaculture 2004, 238, 385.
23. Sa, M. V. D. E.; Pezzato, L. E.; Barros, M. M.; Padilha, P. M.;
Aquaculture Nutrition 2005, 11, 273.
24. Sa, M. V. D. E.; Pezzato, L. E.; Barros, M. M.; Padilha, P. M.;
J. World Aquacult. Soc. 2005, 36, 380.
25. Furuya, W. M.; Pezzato, L. E.; Pezzato, C. A.; Barros, M. M.; Miranda, E. C.; Rev. Bras. Zootec. 2001, 30, 1143.
26. Pezzato, L. E.; Barros, M. M.; Miranda, E. C.; Pinto, L. G. Q.; Furuya, W. M.; Pezzato, A. C.; Rev. Bras. Zootec. 2002, 31, 1595.
Received: November 23, 2006 Web Release Date: October 2, 2007