FT3/FT4 ratio predicts non-alcoholic fatty liver disease
independent of metabolic parameters in patients with
euthyroidism and hypothyroidism
Fatma Yahyaog˘lu Go¨kmen, Su¨leyman Ahbab,*Hayriye Esra Ataog˘lu, Betu¨l C¸avus¸og˘lu Tu¨rker, Faik C¸etin,
Fatih Tu¨rker, Rabia Yahyaog˘lu Mamac¸, Mustafa Yenigu¨n
Haseki Training and Research Hospital, Internal Medicine Clinic, Istanbul, Turkey
OBJECTIVE:This study was performed to evaluate the effects of metabolic parameters and thyroid dysfunction on the development of non-alcoholic fatty liver disease (NAFLD).
METHODS:The current study evaluated a total of 115 patients, 75 female and 40 male. Physical examination and anthropometric measurements were applied to all participants. Hypothyroidism was considered at a thyroid stimulating hormone levelX4.1 mIU/L. Patients with euthyroidism and patients with hypothyroidism were compared. Abdominal ultrasonography was used to diagnose non-alcoholic fatty liver disease. The participants were further compared with regard to the presence of non-alcoholic fatty liver disease. Logistic regression modeling was performed to identify the relationship between non-alcoholic fatty liver disease and independent variables, such as metabolic parameters and insulin resistance.
RESULTS:Non-alcoholic fatty liver disease was identified in 69 patients. The mean waist circumference, body mass index, fasting plasma insulin, HOMA-IR (po0.001) and FT3/FT4 ratio (p=0.01) values were significantly
higher in the patients with NAFLD compared to those without it. Multivariate regression analysis revealed that FT3/FT4ratio, waist circumference and insulin resistance were independent risk factors for non-alcoholic fatty liver disease.
CONCLUSION:Insulin resistance, enlarged waist circumference, elevated body mass index, higher FT3/FT4ratio and hypertriglyceridemia are independent risk factors for NADLF, whereas hypothyroidism is not directly related to the condition.
KEYWORDS: FT3/FT4ratio; Insulin resistance; Non-alcoholic fatty liver disease; Hypothyroidism; Euthyroidism.
Go¨kmen FY, Ahbab S, Ataog˘lu HE, Tu¨rker BC¸, C¸etin F, Tu¨rker F, et al. FT3/FT4 ratio predicts non-alcoholic fatty liver disease independent of metabolic parameters in patients with euthyroidism and hypothyroidism. Clinics. 2016;71(4):221-225
Received for publication onNovember 12, 2015;First review completed onDecember 18, 2015;Accepted for publication onFebruary 2, 2016 *Corresponding author. E-mail: [email protected]
’ INTRODUCTION
Non-alcoholic fatty liver disease (NAFLD), a pathological spectrum of chronic liver diseases ranging from simple steatosis to non-alcoholic steatohepatitis (NASH) with inflammation, has a high risk for progression to cirrhosis (1-3). NAFLD is a growing diagnosis and the most commonly encountered liver pathology in clinical practice (4,5). NAFLD is commonly asymptomatic and discovered incidentally. The diagnosis of NAFLD is based on exclusion criteria, such as alcohol consumption (more than 20 g/day), autoimmune liver disease, viral hepatitis infection, hemochromatosis, Wilson’s disease, and drug consumption. All of these must be excluded before
considering NAFLD (6). The prevalence of NAFLD is associated with abdominal obesity, diabetes mellitus and other metabolic risk factors (7, 8). NAFLD is a strong determinant for the development of metabolic syndrome, which has potentially relevant clinical implications with regard to diagnosis, preven-tion and treatment (9,10). Moreover, metabolic syndrome, insulin resistance, diabetes, obesity and mixed hyperlipidemia are major metabolic risk factors for NAFLD (11). Because of the hyperinsulinism, pro-thrombotic potential, and subclinical inflammation associated with NAFLD, patients with this condition are at increased risk for cardiovascular mortality (12). In addition, the correction of insulin resistance may not be sufficient to successfully treat NASH in the majority of patients, conflicting with previous studies on NAFLD pathogenesis (13). The thyroid gland is significantly involved in lipid and carbohydrate metabolism, regulation of body weight and adipogenesis (14). Recent studies have suggested that thyroid dysfunction may play a role in NAFLD. Subclinical hypothyroidism is associated with metabolic syndrome, cardi-ovascular mortality, and disturbance of lipid metabolism DOI:10.6061/clinics/2016(04)08
Copyright&2016CLINICS–This is an Open Access article distributed under the terms of the Creative Commons License (http://creativecommons.org/licenses/by/ 4.0/) which permits unrestricted use, distribution, and reproduction in any medium or format, provided the original work is properly cited.
(15, 16). Thyroid dysfunctions in the form of overt or subclinical hypothyroidism are prevalent among patients with NAFLD/ NASH (17).
NAFLD is a risk factor for the development of type 2 diabetes, which is, in turn, a major contributor to progressive liver disease (18). In contrast, chronic infections, such as that caused by hepatitis C virus, have an association with the development of NAFLD, insulin resistance and metabolic parameters (19). The identification of risk factors is essential for preventing NAFLD. Therefore, in the current study, we evaluated the effects of metabolic parameters and thyroid dysfunction on the development of NAFLD.
’ METHODS
Participants
The current study evaluated 115 individuals, 75 female and 40 male, who were admitted to the Haseki Training and Research Hospital’s outpatient clinic for routine care from July 2014 through January 2015. Anthropometric measure-ments were taken, and thyroid function tests were performed. Hypothyroidism was described according to Clinical Practice Guidelines for Hypothyroidism in Adults: Cosponsored by the American Association of Clinical Endocrinologists and the American Thyroid Association (20). Euthyroidism (ET) was described as a thyroid stimulating hormone (TSH) level of 0.5—4 mIU/L and no history of chronic disease. Hypothyroid-ism (HT) was described as a TSH level of X 4.1 mIU/L. Patients meeting the following criteria were excluded: chronic liver and kidney disease, viral hepatitis, diabetes mellitus, undergoing corticosteroid treatment, malignancy, alcohol consumption greater than 20 g/d, and pregnancy. Informed consent was obtained from all participants. The study protocol was approved by the local ethics committee of Istanbul Haseki Training and Research Hospital.
Measurements
All patients underwent physical examination. Blood pressure was measured using a mercury sphygmomanometer. Height (m), weight (kg), and waist circumference (WC) were also measured. WC was measured between the lowest rib and the crista iliaca superior. Body mass index (BMI) was calculated as weight (kg)/height (m)2. Plasma TSH, free T3 (FT3), free T4 (FT4), alanine aminotransferase (ALT), aspartate alanine aminotransferase (AST), gamma glutamyl transferase (GGT), alkaline phosphatase (ALP), glucose, insulin, total cholesterol, triglycerides, HDL and LDL cholesterol, uric acid and creatinine were measured after an 8-hour fast using an Abbot Architect Analyzer System (IL, USA). The home-ostasis model assessment for insulin resistance (HOMA-IR) was calculated using the following formula: fasting blood glucose (mmol/l) [insulin (mU/l)/22.5].
Abdominal Ultrasonography
The presence of qualitative steatosis was determined using a standard 2D abdominal ultrasonography (USG). All partici-pants underwent abdominal USG (Philips Active Array, 2D-Clearvue 550 device). NAFLD was characterized by the presence of hepatic brightness, hepatorenal echo contrast, deep attenuation and vascular blurring on USG (21).
Statistical Analysis
Numeric values were expressed as the mean± standard
deviation. Statistical analysis was performed using SPSS 16.0
for Windows. The Kolmogorov-Smirnov Z test was used to determine the distributions of variables. Regular variances were assessed using a t test, and irregular variables were assessed using the Mann-Whitney U test. Logistic regression modeling was performed to assess independent risk factors of NAFLD. A p value o0.05 was considered statistically
significant.
’ RESULTS
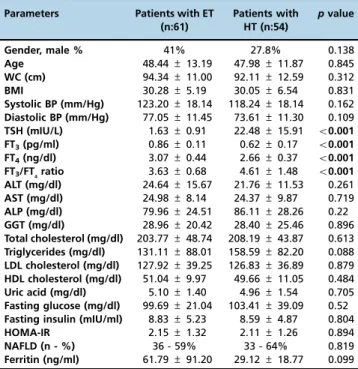
In total, 115 participants were enrolled in this study: 54 presented with HT (F/M, 39/15) and 61 presented with ET (F/M, 36/25). The anthropometric and metabolic para-meters of the patients with ET and HT were compared and are presented in Table 1. No significant differences were found in gender, age, mean BMI, systolic BP, diastolic BP, ALT, AST, ALP, GGT, total cholesterol, triglycerides, LDL cholesterol, HDL cholesterol, uric acid, fasting glucose, fasting insulin, HOMA-IR, NAFLD or ferritin in the subjects with ET (30.28±
5.19) versus those with HT. The mean FT3/FT4 ratio of the patients with HT was higher than that of the subjects with ET, at 4.61 ± 1.38 versus 3.63 ± 0.68, respectively
(po0.001). There was no difference in NAFLD status
between the patients with ET and those with HT. NAFLD was identified in 69 of total 115 subjects: 33 patients with ET and 36 patients with HT.
The participants were compared according to the presence of NAFLD, and the parameters of the comparison are presented in Table 2. The mean WC, BMI, systolic and diastolic blood pressure values were statistically higher in the patients with NAFLD than those without the condition (po0.001, o0.001, 0.049 and 0.003, respectively).
Addition-ally, the patients with NAFLD had significantly higher triglyceride levels (164.96±77.27 mg/dl) than those without
NAFLD (112.61±89.80 mg/dl) (p=0.001). The patients with
NAFLD also had significantly higher uric acid, fasting insulin, HOMA-IR and FT3/FT4ratios.
The subjects with ET or HT in this study were also compared according to the presence or absence of NAFLD, as shown in Table 3. The patients with ET and NAFLD had higher WC (p=0.001), total cholesterol (p=0.042), triglycerides (po0.001), fasting insulin (po0.001) and HOMA-IR (p=0.001)
levels compared to the subjects with ET without NAFLD. While the FT4levels in the patients with ET and NAFLD were lower than those in the patients with ET without NAFLD, the patients with ET and NAFLD had increased FT3/FT4ratios, as well as uric acid, fasting insulin and HOMA-IR levels, compared to the patients with ET without NAFLD (p=0.01).
The patients with HT and NAFLD had lower FT4 levels compared to the patients with HT without NAFLD (Table 3). Additionally, the patients with HT and NAFLD had higher WC, total cholesterol, triglycerides, fasting insulin and HOMA-IR levels than the patients with HT without NAFLD.
(OR: 8.042,p=0.02) and FT3/FT4ratio (OR: 3.540,p=0.01) were independent risk factors for NAFLD in patients with HT.
’ DISCUSSION
NAFLD is a burgeoning health problem and is currently recognized as the most common metabolic liver disease. Insulin resistance and obesity contribute to the development of NAFLD, which has become the most prevalent liver disease worldwide, affecting one-third of the global adult population (22,23). NAFLD can lead to NASH and/or hepatocellular cancer (24).
It has been suggested that a relationship exists between NAFLD and thyroid dysfunction (25). Despite the precise physiological mechanism underlying the development of NAFLD, the relationship between NAFLD, hypothyroidism and metabolic syndrome remains unclear. Because of the importance of thyroid hormones in lipid metabolism (26), HT may result in hyperlipidemia, thereby initiating the devel-opment of NAFLD. Several studies have indicated that hypothyroidism is a risk factor for NAFLD and can result in metabolic syndrome (16,27,28). FT3/FT4 ratio can be con-sidered an indicator of peripheral deiodinase activity. Bilgin and Pirgon (29) suggested that augmented conversion from FT4 to FT3 due to increased deiodinase activity is a compensatory mechanism for fat accumulation to improve energy expenditure. FT3/FT4ratio positively correlates with HOMA-IR in patients with NAFLD (18). Moreover, positive associations have been reported between FT3/FT4 ratio and both waist circumference and BMI in patients with obesity (30). Ittermann and Haring (31) reported that low FT4levels,
but not low TSH and FT3levels, are associated with hepatic steatosis. In the present study, the mean BMI values in patients with ET and patients with HT were similar; however, the patients with HT had significantly higher FT3/FT4ratios (po0.001). The patients with NAFLD had significantly
elevated BMI, WC, HOMA-IR values and FT3/FT4 ratios; their FT4 levels were low, leading to increased FT3/FT4 ratios, but their TSH levels were unaffected. The results of this study suggest that elevated FT3/FT4 ratio is an independent risk factor for NAFLD.
Patients with HT have elevated triglyceride and LDL cholesterol levels due to decreased plasma lipoprotein lipase activity. Hyperlipidemia associated with fatty accumulation in the liver and cellular oxidative stress is one potential mechan-ism underlying the development of NAFLD (32,33). The results of the present study support this relationship, as TC (p=0.002), LDL cholesterol (p=0.001), triglyceride (p=0.008), and uric acid (p=0.006) levels were significantly higher and HDL cholesterol levels lower (p=0.022) in the patients with NAFLD.
The prevalence of NAFLD did not significantly differ between the ET (n:36, 59%) and HT (n:33, 64%) groups. Mazo and Lima (34) previously reported that no association exists between HT, hepatosteatosis and NASH. In addition, Eshraghian and Dabbaghmanesh (35) reported that no association exists between autoimmune thyroid disorder and elevated anti-thyroid perox-idase levels, anti-tiroglobulin levels and NAFLD. Furthermore, NAFLD was not correlated with thyroid dysfunction in the current study, as the included patients with ET and HT did not show significant differences in NAFLD prevalence, insulin resistance, abdominal obesity or BMI. The mean BMI of the patients with ET and HT was above 30, and abdominal obesity was considered to be more important to the development of NAFLD than HT. WC, FT3/FT4ratio, triglyceride level and serum uric acid level were independent risk factors for Table 1-Parameters compared between patients with euthyroidism
and those with hypothyroidism.
Parameters Patients with ET (n:61)
Patients with HT (n:54)
pvalue
Gender, male % 41% 27.8% 0.138
Age 48.44±13.19 47.98±11.87 0.845
WC (cm) 94.34±11.00 92.11±12.59 0.312
BMI 30.28±5.19 30.05±6.54 0.831
Systolic BP (mm/Hg) 123.20±18.14 118.24±18.14 0.162
Diastolic BP (mm/Hg) 77.05±11.45 73.61±11.30 0.109
TSH (mIU/L) 1.63±0.91 22.48±15.91 o0.001
FT3(pg/ml) 0.86±0.11 0.62±0.17 o0.001
FT4(ng/dl) 3.07±0.44 2.66±0.37 o0.001
FT3/FT4ratio 3.63±0.68 4.61±1.48 o0.001
ALT (mg/dl) 24.64±15.67 21.76±11.53 0.261
AST (mg/dl) 24.98±8.14 24.37±9.87 0.719
ALP (mg/dl) 79.96±24.51 86.11±28.26 0.22
GGT (mg/dl) 28.96±20.42 28.40±25.46 0.896
Total cholesterol (mg/dl) 203.77±48.74 208.19±43.87 0.613
Triglycerides (mg/dl) 131.11±88.01 158.59±82.20 0.088
LDL cholesterol (mg/dl) 127.92±39.25 126.83±36.89 0.879
HDL cholesterol (mg/dl) 51.04±9.97 49.66±11.05 0.484
Uric acid (mg/dl) 5.10±1.40 4.96±1.54 0.705
Fasting glucose (mg/dl) 99.69±21.04 103.41±39.09 0.52
Fasting insulin (mIU/ml) 8.83±5.23 8.59±4.87 0.804
HOMA-IR 2.15±1.32 2.11±1.26 0.894
NAFLD (n - %) 36 - 59% 33 - 64% 0.819
Ferritin (ng/ml) 61.79±91.20 29.12±18.77 0.099
Euthyroidism, hypothyroidism n: number of patients. WC: waist circum-ference. BMI: body mass index. BP: blood pressure. ALT: alanine aminotrans-ferase. AST: aspartate aminotransaminotrans-ferase. ALP: alkaline phosphatase. GGT: gamma glutamyl transferase. HOMA-IR: homeostasis model assessment for insulin resistance. NAFLD: non-alcoholic fatty liver disease.
Table 2-Comparison of study parameters between patients with and without non-alcoholic fatty liver disease.
Parameters Without NAFLD (n:46)
With NAFLD (n:69)
pvalue
Gender, male % 28.3% 39.1% 0.231
Age 45.76±12.30 49.87±12.51 0.085
WC (cm) 86.20±12.73 98.03±8.27 o0.001
BMI 27.11±5.29 32.21±5.30 o0.001
Systolic BP (mm/Hg) 116.63±17.80 123.70±19.24 0.049 Diastolic BP (mm/Hg) 71.63±9.95 77.97±11.77 0.003 TSH (mIU/L) 9.51±10.33 13.81±20.30 0.138
FT3(pg/ml) 2.91±0.34 2.85±0.52 0.479
FT4(ng/dl) 0.80±0.16 0.72±0.20 0.025
FT3/FT4ratio 3.78±0.82 4.32±1.42 0.015
ALT (mg/dl) 18.02±9.34 26.80±15.32 o0.001
AST (mg/dl) 21.62±5.87 26.74±10.05 0.001 ALP (mg/dl) 79.46±24.38 84.98±27.54 0.28
GGT (mg/dl) 21.97±18.29 33.15±24.43 0.01 Total cholesterol (mg/dl) 189.89±42.22 216.48±46.23 0.002 Triglycerides (mg/dl) 112.61±89.80 164.96±77.27 0.001 LDL cholesterol (mg/dl) 115.93±33.98 135.06±38.83 0.008 HDL cholesterol (mg/dl) 53.22±11.41 48.50±9.41 0.022
Uric acid (mg/dl) 4.58±1.46 5.36±1.40 0.006 Fasting glucose (mg/dl) 102.17±46.61 100.94±12.20 0.862
Fasting insulin (mIU/ml) 5.72±2.30 10.58±5.38 o0.001
HOMA-IR 1.37±0.60 2.62±1.36 o0.001
NAFLD in the patients with HT in our study. Abdominal obesity is a substantial component of metabolic syndrome and increases the risk for cardiovascular events. Visceral fat can be considered an important predictive factor for NAFLD (36).
The mean WC (po0.001), BMI (po0.001), systolic and
diastolic blood pressure (p=0.049 andp=0.003) values were higher in the patients with NAFLD in the present study. Fatty liver disease has been associated with anthropometric findings. Moreover, abdominal obesity and increased WC have been associated with NAFLD (37). Huang and Beilin (38) demonstrated that systolic and diastolic blood pres-sure are elevated in patients with NAFLD compared to controls. Concordant with the referenced results, in the current study, AST, ALT and GGT were increased in patients with NAFLD. Chung and Kim (25) reported that
both the prevalence of NAFLD and ALT levels were higher in patients with HT. Serum ALT level is a surrogate marker for NAFLD in the absence of other causes of liver disease (17). In the current study, fasting insulin and HOMA-IR values were elevated in patients with NAFLD. Further-more, insulin resistance and fasting insulin level formed a strong relationship with NAFLD, independent of HT. Additionally, it has been reported that hyperinsuline-mia and HT can separately result in the development of NAFLD (39,40).
In the current study, abdominal USG was applied to diagnose NAFLD via the qualitative detection of steatosis. Abdominal USG detects changes in fatty accumulation in the liver of as low asX20% and closely mirrors coronary and carotid atherosclerosis burden. In contrast, semi-quantitative USG indices (to exclude NASH) and sonoelastography (to Table 3-Comparison of parameters between patients with ET or HT according to presence or absence of non-alcoholic fatty liver disease.
Parameters with NAFLD without NAFLD pvalue
N 36 25
-Age 49.78±12.77 46.52±13.80 0.347
Patients FT3(pg/ml) 3.09±0.52 3.04±0.29 0.645
with FT4(ng/dl) 0.84±0.11 0.90±0.10 0.046
euthyroidism FT3/FT4ratio 3.78±0.78 3.42±0.47 0.01
TSH (mIU/L) 1.71±0.96 1.50±0.83 0.381
WC (cm) 98.86±7.69 87.84±11.90 o0.001
Total cholesterol (mg/dl) 215.25±51.83 187.24±39.20 0.026 LDL cholesterol (mg/dl) 137.56±41.72 114.04±31.18 0.02 HDL cholesterol (mg/dl) 49.06±8.21 53.88±11.65 0.082
Triglycerides (mg/dl) 143.72±66.64 112.96±110.93 0.18
Glucose (mg/dl) 101.97±11.69 96.40±29.79 0.313
Uric acid (mg/dl) 5.50±1.42 4.48±1.15 0.006 Fasting insulin (mIU/ml) 10.53±5.82 6.05±2.14 o0.001
HOMA-IR 2.62±1.43 1.39±0.53 o0.001
N 33 21
-Age 49.97±12.42 44.86±10.48 0.124
Patients FT3(pg/ml) 27.01±23.02 19.04±79 0.075
with FT4(ng/dl) 2.59±0.37 2.76±0.35 0.103
hypothyroidism FT3/FT4ratio 0.59±0.19 0.68±0.13 0.036
TSH (mIU/L) 4.89±1.72 4.20±0.94 0.27
WC (cm) 97.12±8.89 84.24±13.67 0.001 Total cholesterol (mg/dl) 217.82±40.00 193.05±46.34 0.042 LDL cholesterol (mg/dl) 132.33±35.85 118.19±37.69 0.172
HDL cholesterol (mg/dl) 47.89±10.64 52.43±11.34 0.14
Triglycerides (mg/dl) 188.12±82.28 112.19±58.08 o0.001
Glucose (mg/dl) 109.05±61.09 99.82±12.81 0.502
Uric acid (mg/dl) 5.19±1.38 4.70±1.76 0.259
Fasting insulin (mIU/ml) 10.64±4.94 5.38±2.44 o0.001
HOMA-IR 2.61±1.30 1.34±0.67 o0.001 NAFLD: non-alcoholic fatty liver disease. FT3: free T3.FT4: free T4. TSH: thyroid stimulating hormone. WC: waist circumference. HOMA-IR: homeostasis
model assessment for insulin resistance.
Table 4-Logistic regression analysis of the association between non-alcoholic fatty liver disease and metabolic variables in all participants.
Variables pvalue OR 95% CI
WC 0.01 1.087 1.018 - 1.061
Triglycerides 0.12 1.010 0.997 - 1.031
Total cholesterol 0.21 1.009 0.995 - 0.921
Uric acid 0.79 1.056 0.706 - 51.283
HOMA-IR 0.005 2.978 1.397 - 9.575
FT3/FT4ratio 0.02 1.834 1.089 - 3.569
WC: waist circumference. HOMA-IR: homeostasis model assessment for insulin resistance. OR: odds ratio. CI: confidence interval.
Table 5-Logistic regression analysis of the association between non-alcoholic fatty liver disease and metabolic variables in patients with HT.
Variables pvalue OR 95% CI
WC 0.02 1.189 1.024 - 1.381
Triglycerides 0.04 1.031 1.001 - 1.061
Total cholesterol 0.78 1.004 0.977 - 1.031
Uric acid 0.03 0.318 0.11 - 0.921
HOMA-IR 0.02 8.042 1.261 - 51.283
FT3/FT4ratio 0.01 3.540 1.309 - 9.575
quantify fibrosis) help predict liver histology and can be used to help select patients to submit to liver biopsy (41). According to the above, semi-quantitative steatosis indices must be further investigated.
In conclusion, FT3/FT4ratio, HOMA-IR and WC are risk factors for the development of NAFLD. FT3/FT4 ratio is a predictor of NAFLD independent of insulin resistance both in patients with ET and in patients with HT. Elevated serum triglyceride and uric acid levels are independent risk factors for NAFLD in patients with HT.
’ AUTHOR CONTRIBUTIONS
Gökmen FY and Ahbab S participated in the study design, study coordination and drafting of the manuscript. Ataog˘lu HE participated in statistic analysis and helped in drafting the manuscript. Türker BÇ, Çetin F, Türker F and Mamac¸ RY participated in data collection. Yenigün M participated in study design and coordination.
’ REFERENCES
1. Pagadala MR, Zein CO, Dasarathy S, Yerian LM, Lopez R, McCullough AJ. Prevalence of hypothyroidism in nonalcoholic fatty liver disease. Dig Dis Sci. 2012;57(2):528-34, http://dx.doi.org/10.1007/s10620-011-2006-2. 2. Contos MJ, Choudhury J, Mills AS, Sanyal AJ. The histologic spectrum of
nonalcoholic fatty liver disease. Clin Liver Dis. 2004;8(3):481-500, vii. http://dx.doi.org/10.1016/j.cld.2004.04.013.
3. Tarantino G, Finelli C, Colao A, Capone D, Tarantino M, Grimaldi E, et al. Are hepatic steatosis and carotid intima media thickness associated in obese patients with normal or slightly elevated gamma-glutamyl-transferase? J Transl Med. 2012;10:50, http://dx.doi.org/10.1186/1479-5876-10-50. 4. Angulo P. GI epidemiology: nonalcoholic fatty liver disease. Aliment
Pharmacol Ther. 2007;25(8):883-9, http://dx.doi.org/10.1111/j.1365-2036. 2007.03246.x.
5. Postic C, Girard J. The role of the lipogenic pathway in the development of hepatic steatosis. Diabetes & Metabolism. 2008;34(6, Part 2):643-8, http://dx.doi.org/10.1016/S1262-3636(08)74599-3.
6. Asrih M, Jornayvaz FR. Metabolic syndrome and nonalcoholic fatty liver disease: Is insulin resistance the link? Mol Cell Endocrinol. 2015. 7. Day CP. Non-alcoholic fatty liver disease: a massive problem. Clin Med.
2011;11(2):176-8, http://dx.doi.org/10.7861/clinmedicine.11-2-176. 8. Capeau J. Insulin resistance and steatosis in humans. Diabetes &
Meta-bolism. 2008;34(6, Part 2):649-57, http://dx.doi.org/10.1016/S1262-3636 (08)74600-7.
9. Lonardo A, Ballestri S, Marchesini G, Angulo P, Loria P. Nonalcoholic fatty liver disease: a precursor of the metabolic syndrome. Dig Liver Dis. 2015;47(3):181-90, http://dx.doi.org/10.1016/j.dld.2014.09.020. 10. Nascimbeni F, Pais R, Bellentani S, Day CP, Ratziu V, Loria P, et al. From
NAFLD in clinical practice to answers from guidelines. J Hepatol. 2013; 59(4):859-71, http://dx.doi.org/10.1016/j.jhep.2013.05.044.
11. Lonardo A, Bellentani S, Argo CK, Ballestri S, Byrne CD, Caldwell SH, et al. Epidemiological modifiers of non-alcoholic fatty liver disease: Focus on high-risk groups. Dig Liver Dis. 2015;47(12):997-1006, http://dx.doi. org/10.1016/j.dld.2015.08.004.
12. Maurantonio M, Ballestri S, Odoardi MR, Lonardo A, Loria P. Treatment of atherogenic liver based on the pathogenesis of nonalcoholic fatty liver disease: a novel approach to reduce cardiovascular risk? Arch Med Res. 2011;42(5):337-53, http://dx.doi.org/10.1016/j.arcmed.2011.08.004. 13. Lonardo A, Bellentani S, Ratziu V, Loria P. Insulin resistance in
nonalco-holic steatohepatitis: necessary but not sufficient - death of a dogma from analysis of therapeutic studies? Expert Rev Gastroenterol Hepatol. 2011; 5(2):279-89, http://dx.doi.org/10.1586/egh.11.19.
14. Michalaki MA, Vagenakis AG, Leonardou AS, Argentou MN, Habeos IG, Makri MG, et al. Thyroid function in humans with morbid obesity. Thyroid. 2006;16(1):73-8, http://dx.doi.org/10.1089/thy.2006.16.73. 15. Rodondi N, den Elzen WP, Bauer DC, Cappola AR, Razvi S, Walsh JP,
et al. Subclinical hypothyroidism and the risk of coronary heart disease and mortality. JAMA. 2010;304(12):1365-74, http://dx.doi.org/10.1001/ jama.2010.1361.
16. Amarapurkar D, Kamani P, Patel N, Gupte P, Kumar P, Agal S, et al. Prevalence of non-alcoholic fatty liver disease: population based study. Ann Hepatol. 2007;6(3):161-3.
17. Eshraghian A, Hamidian Jahromi A. Non-alcoholic fatty liver disease and thyroid dysfunction: a systematic review. World J Gastroenterol. 2014; 20(25):8102-9, http://dx.doi.org/10.3748/wjg.v20.i25.8102.
18. Loria P, Lonardo A, Anania F. Liver and diabetes. A vicious circle. Hepa-tology research : the official journal of the Japan Society of HepaHepa-tology. 2013;43(1):51-64, http://dx.doi.org/10.1111/j.1872-034X.2012.01031.x.
19. Lonardo A, Ballestri S, Adinolfi LE, Violi E, Carulli L, Lombardini S, et al. Hepatitis C virus-infected patients are‘spared’from the metabolic syn-drome but not from insulin resistance. A comparative study of nonalco-holic fatty liver disease and hepatitis C virus-related steatosis. Can J Gastroenterol. 2009;23(4):273-8.
20. Garber JR, Cobin RH, Gharib H, Hennessey JV, Klein I, Mechanick JI, et al. Clinical practice guidelines for hypothyroidism in adults: cosponsored by the American Association of Clinical Endocrinologists and the American Thyroid Association. Thyroid. 2012;22(12):1200-35, http://dx.doi.org/ 10.1089/thy.2012.0205.
21. Mishra P, Younossi ZM. Abdominal ultrasound for diagnosis of non-alcoholic fatty liver disease (NAFLD). Am J Gastroenterol. 2007;102(12): 2716-7, http://dx.doi.org/10.1111/j.1572-0241.2007.01520.x.
22. White DL, Kanwal F, El-Serag HB. Association between nonalcoholic fatty liver disease and risk for hepatocellular cancer, based on systematic review. Clin Gastroenterol Hepatol. 2012;10(12):1342-59 e2. http://dx.doi. org/10.1016/j.cgh.2012.10.001.
23. Fabbrini E, Sullivan S, Klein S. Obesity and nonalcoholic fatty liver dis-ease: biochemical, metabolic, and clinical implications. Hepatology. 2010; 51(2):679-89, http://dx.doi.org/10.1002/hep.23280.
24. Baffy G, Brunt EM, Caldwell SH. Hepatocellular carcinoma in non-alcoholic fatty liver disease: an emerging menace. J Hepatol. 2012;56(6):1384-91, http://dx.doi.org/10.1016/j.jhep.2011.10.027.
25. Chung GE, Kim D, Kim W, Yim JY, Park MJ, Kim YJ, et al. Non-alcoholic fatty liver disease across the spectrum of hypothyroidism. J Hepatol. 2012;57(1):150-6, http://dx.doi.org/10.1016/j.jhep.2012.02.027. 26. Duntas LH, Brenta G. The effect of thyroid disorders on lipid levels and
metabolism. Med Clin North Am. 2012;96(2):269-81, http://dx.doi.org/ 10.1016/j.mcna.2012.01.012.
27. Law K, Brunt EM. Nonalcoholic fatty liver disease. Clin Liver Dis. 2010; 14(4):591-604, http://dx.doi.org/10.1016/j.cld.2010.07.006.
28. Ortiz-Lopez C, Lomonaco R, Orsak B, Finch J, Chang Z, Kochunov VG, et al. Prevalence of prediabetes and diabetes and metabolic profile of patients with nonalcoholic fatty liver disease (NAFLD). Diabetes Care. 2012;35(4):873-8, http://dx.doi.org/10.2337/dc11-1849.
29. Bilgin H, Pirgon O. Thyroid function in obese children with non-alcoholic Fatty liver disease. J Clin Res Pediatr Endocrinol. 2014;6(3):152-7, http:// dx.doi.org/10.4274/jcrpe.1488.
30. De Pergola G, Ciampolillo A, Paolotti S, Trerotoli P, Giorgino R. Free triiodothyronine and thyroid stimulating hormone are directly associated with waist circumference, independently of insulin resistance, metabolic parameters and blood pressure in overweight and obese women. Clin Endocrinol (Oxf). 2007;67(2):265-9.
31. Ittermann T, Haring R, Wallaschofski H, Baumeister SE, Nauck M, Dorr M, et al. Inverse association between serum free thyroxine levels and hepatic steatosis: results from the Study of Health in Pomerania. Thyroid. 2012;22(6):568-74, http://dx.doi.org/10.1089/thy.2011.0279.
32. Musso G, Gambino R, Cassader M. Recent insights into hepatic lipid metabolism in non-alcoholic fatty liver disease (NAFLD). Prog Lipid Res. 2009;48(1):1-26, http://dx.doi.org/10.1016/j.plipres.2008.08.001. 33. Rolo AP, Teodoro JS, Palmeira CM. Role of oxidative stress in the
pathogenesis of nonalcoholic steatohepatitis. Free Radic Biol Med. 2012; 52(1):59-69, http://dx.doi.org/10.1016/j.freeradbiomed.2011.10.003. 34. Mazo DF, Lima VM, Stefano JT, Rabelo F, Faintuch J, Oliveira CP.
Gluco-lipidic indices in treated hypothyroidism associated with nonalcoholic fatty liver disease. Arq Gastroenterol. 2011;48(3):186-9, http://dx.doi.org/ 10.1590/S0004-28032011000300006.
35. Eshraghian A, Dabbaghmanesh MH, Eshraghian H, Fattahi MR, Omrani GR. Nonalcoholic fatty liver disease in a cluster of Iranian popula-tion: thyroid status and metabolic risk factors. Arch Iran Med. 2013; 16(10):584-9.
36. Eguchi Y, Eguchi T, Mizuta T, Ide Y, Yasutake T, Iwakiri R, et al. Visceral fat accumulation and insulin resistance are important factors in non-alcoholic fatty liver disease. J Gastroenterol. 2006;41(5):462-9, http://dx. doi.org/10.1007/s00535-006-1790-5.
37. Bellentani S, Saccoccio G, Masutti F, Croce LS, Brandi G, Sasso F, et al. Prevalence of and risk factors for hepatic steatosis in Northern Italy. Ann Intern Med. 2000;132(2):112-7, http://dx.doi.org/10.7326/0003-4819-132-2-200001180-00004.
38. Huang RC, Beilin LJ, Ayonrinde O, Mori TA, Olynyk JK, Burrows S, et al. Importance of cardiometabolic risk factors in the association between nonalcoholic fatty liver disease and arterial stiffness in adolescents. Hepatology. 2013;58(4):1306-14, http://dx.doi.org/10.1002/hep.26495. 39. Yilmaz Y. NAFLD in the absence of metabolic syndrome: different
epidemiology, pathogenetic mechanisms, risk factors for disease pro-gression? Semin Liver Dis. 2012;32(1):14-21, http://dx.doi.org/10.1055/s-0032-1306422.
40. Collantes RS, Ong JP, Younossi ZM. The metabolic syndrome and non-alcoholic fatty liver disease. Panminerva Med. 2006;48(1):41-8. 41. Ballestri S, Romagnoli D, Nascimbeni F, Francica G, Lonardo A. Role of