1 A Work Project, presented as part of the requirements for the Award of a Master Degree in
Management from the NOVA – School of Business and Economics.
ROMANTIC RELATIONSHIPS AND CONSUMER BEHAVIOUR: HOW
PARTNERS INFLUENCE EACH OTHER IN THEIR ATTITUDES AND
PURCHASE INTENTIONS
-
APPENDIX -
MIRJAM SUSANNE MERTEL – 25071
A Project carried out on the Master in Management Program, under the
supervision of:
Luis F. Martinez (Nova SBE) and Aristides I. Ferreira (ISCTE-IUL)
2
List of Appendices
1. Survey... 4
1.1Questions ... 4
1.2 Composition of Questionnaires ... 14
2. Descriptive Statistics ... 16
2.1 Demographics ... 16
2.2 Frequency Tables Variables ... 18
3. Multivariate Analysis ... 50
3.1 Factor Analysis Group 1: Male Experiment Group Day 1 ... 50
3.2 Factor Analysis Group 1: Male Experiment Group Day 2 ... 58
3.3 Factor Analysis Group 1: Female Control Group Day 1 ... 63
3.4 Factor Analysis Group 1: Female Control Group Day 2 ... 70
3.5 Factor Analysis Group 2: Female Experiment Group Day 1 ... 79
3.6 Factor Analysis Group 2: Female Experiment Group Day 2 ... 87
3.7 Factor Analysis Group 2: Male Control Group Day 1 ... 92
3.8 Factor Analysis Group 2: Male Control Group Day 2 ... 99
4. Item Statistics ... 108
4.1 Ethical Minded Consumer Behaviour ... 108
4.2 Green Product Identification Ability ... 108
4.3 Health Consciousness ... 109
4.4 Health Risk Assessment ... 109
4.5 Attitude towards consuming a Food ... 109
4.6 Edibility of a product ... 110
4.7 Health Benefits of the Product ... 111
4.8Willingness to pay a Price Premium ... 112
5. Correations ... 114
5.1 Correlations Matrix Group 1 ... 114
5.2 Correlations Matrix Group 2 ... 121
6. Hypotheses Testing ... 127
6.1Hypothesis 1 ... 127
6.2 Hypothesis 2: ... 128
6.3 Hypothesis 3 ... 129
3
Tables Index
Table 1 – Validity and Reliability Group 1 78
Table 2 – Validity and Reliability Group 2 107
4
1.
Survey
1.1 Questions
Introduction
Dear participant,
First, I would like to thank you for your participation in this Consumer Behaviour Study as part of my master thesis at the Nova School of Business andEconomics in Lisbon.
The study aims at measuring the interdependence of partners in a relationship concerning their consumer behaviour.
In order to track the couples’ influence on each other accordingly, please do not forget to indicate the three-digit couple code that has been sent to you via email in the corresponding field.
The questionnaire will be completely anonymous and the data will only be used for the purpose of this study.
5
Part 1
Ethical Minded Consumer Behaviour Adapted from Sudbury-Riley & Cohabiter, 2016
Please indicate to which extend you agree with the statements below.
Strongly Agree Neither agree Somewhat Strongly Agree nor disagree disagree disagree
1 2 3 4 5
1. When there is a choice, I always choose the product that contributes to the least amount of environmental damage.
1 2 3 4 5 2. I have switched products for environmental reasons. 1 2 3 4 5 3. If I understand the potential damage to the environment that
some products can cause, I do not purchase those products.
1 2 3 4 5 4. I do not buy household products that harm the environment. 1 2 3 4 5 5. Whenever possible, I buy products packaged in reusable or
recyclable containers.
1 2 3 4 5 6. I make every effort to buy paper products (toilet paper,
tissues, etc.) made from recycled paper.
1 2 3 4 5 7. I will not buy a product if I know that the company that sells
it is socially irresponsible.
1 2 3 4 5 8. I do not buy products from companies that I know use
sweatshop labor, child labor, or other poor working conditions.
1 2 3 4 5
9. I have paid more for environmentally friendly products when there is a cheaper alternative.
1 2 3 4 5 10.I have paid more for socially responsible products when
there is a cheaper alternative.
6
Part 2
Green Products Identification Ability Adapted from Gleam et al, 2013
Please indicate to which extend you agree with the statements below.
Strongly Agree Neither agree Somewhat Strongly Agree nor disagree disagree disagree
1 2 3 4 5
1. I can recognize green products among other products. 1 2 3 4 5
2. I am aware of green products. 1 2 3 4 5
3. I can identify green products. 1 2 3 4 5
4. I do know the difference between green products and standard products.
7
Part 3
Health Consciousness
Adapted from Haws and Winterich 2013
Please indicate to which extend you agree with the statements below.
Strongly Agree Neither agree Somewhat Strongly
Agree nor disagree disagree disagree
1 2 3 4 5
1. I reflect about my health a lot. 1 2 3 4 5
2. I'm very self-conscious about my health. 1 2 3 4 5 3. I'm generally attentive to my inner feelings about my health. 1 2 3 4 5
4. I'm constantly examining my health. 1 2 3 4 5
5. I'm alert to changes in my health. 1 2 3 4 5
6. I'm usually aware of my health. 1 2 3 4 5
8
Part 4
Health Risk Assessment
Adapted from Samper & Schwartz, 2013
How likely are you to have serious health problems in your lifetime?
Extremely Somewhat Neither likely Somewhat Extremely Likely Likely nor unlikely unlikely unlikely
1 2 3 4 5
How applicable is this issue to you?
Extremely Very Moderately Slightly Not at all Applicable applicable applicable applicable applicable 1 2 3 4 5
How serious a threat are serious health problems to you?
Extremely Serious Neither serious Not Definitely Serious nor unserious Serious not serious
9
Part 5
Attitude towards Consuming the Food – Salmon Adapted from Haws & Winterich, 2013
Please indicate to which extend you agree with the statements below.
Strongly Agree Neither agree Somewhat Strongly Agree nor disagree disagree disagree
2 2 3 4 5
1. Eating salmon would be pleasurable. 1 2 3 4 5
2. I would enjoy eating salmon. 1 2 3 4 5
3. Salmon would be satisfying. 1 2 3 4 5
10
Part 6
Health Benefits of the Product – Long Term Adapted from Passover & Lee, 2013
While you were viewing the picture of salmon, please describe . . .
A great A lot A moderate A little None at all
deal amount
1 2 3 4 5
1. To what extent were your thoughts about the long-term benefits of consuming salmon?
1 2 3 4 5
2. To what extent were your thoughts about staying healthy in the long run?
1 2 3 4 5
3. To what extent were your thoughts about the long-reaching consequences of your diet?
11
Part 7
Edibility of the Product
Adapted from Castro, Morales, & Knowles, 2013
How likely are you to ingest this product?
Extremely Somewhat Neither likely Somewhat Extremely Likely Likely nor unlikely unlikely unlikely
1 2 3 4 5
How likely are you to eat this product?
Extremely Somewhat Neither likely Somewhat Extremely Likely Likely nor unlikely unlikely unlikely
1 2 3 4 5
How edible is this product?
A great A lot A moderate A little Not at all
deal amount
12
Part 8
Willingness to pay a Price Premium Adapted from False, Niemeyer, and Burton, 2012
The price of farmed salmon would have to go up quite a lot before I would
switch to wild salmon.
Strongly Agree Neither agree Somewhat Strongly Agree nor disagree disagree disagree
1 2 3 4 5
I am willing to pay ___% more for wild salmon over farmed salmon.
How much would be available to pay for each product in
€
/kg?
Farmed Salmon
13
Part 9
Stimulus
Director: Nicolas Daniel, Original length: 54 min, cut by Mirjam Mertel to 9 mins
14
Part 10
Demographics
Your couple Code
Sex
Male Female
Age
18-24 25-34 35-44 45-54 55-64 65 – 74 74 and older
Employment
Employed full time
Employed part time
Unemployed looking for work Unemployed not looking for work Retired
Student Disabled
15 1.2 Composition of Questionnaires
Scale Experiment Group Day I
Experiment Group Day II
Control Group Day 1 Control Group Day II Ethical Minded Consumer Behaviour
X X
Green Products Identification
Ability
X X X X
Health Consciousness
X X
Health Risk Assessment
X X X X
Attitude towards Consuming the
Food
X X X X
Health Benefits of the Product –
Long Term
X X X X
Edibility of the Product
X X X X
Willingness to pay a Price
Premium
X X X X
Stimulus X X
Health Benefits of the Product – Long Term II
X X
Health Risk Assessment II
X
Edibility of the Product II
16 Willingness to
pay a Price Premium
X
Nr. Items 40 20 37 33
2.
Descriptive Statistics
2.1 Demographics
Gender
Frequency Percent Cumulative Percent
Male 66 50 50
Female 66 50 100
Total 132 100 100
Distribution Groups
Number Couples
Group 1 (Male Experiment Group) 32
Group 2 (Female Experiment Group) 34
Age
Frequency Percent Cumulative Percent
18-24 58 43.9 43.9
25-34 41 31.1 75
35-44 14 10.6 85.6
45-54 5 3.8 89.4
55-64 7 5.3 94.7
17 Employment
Frequency Percent Cumulative Percent
Employed full time 56 42.4 42.4
Employed part time 8 6.1 48.5
Unemployed looking for work
4 3 51.5
Unemployed not looking for work
0 0 51.5
Retired 5 3.8 55.3
Student
58 44 99.3
Disabled 1 0.7 100
18
2.2 Frequency Tables Variables
Ethical Minded Consumer Behaviour - Male
1. 2. 3. 4. 5. 6. 7. 8. 9. 10.
Percent Percent Percent Percent Percent Percent Percent Percent Percent Percent
1 16.67 15.15 19.71 12.12 12.12 10.61 22.73 21.21 12.12 10.06 2 30.3 25.76 48.50 19.71 28.81 19.71 28.81 28.81 36.36 34.85 3 37.88 18.18 18.18 36.36 36.36 33.33 25.76 28.81 27.27 28.81 4 12.12 22.73 10.61 21.21 16.67 24.24 15.15 18.18 15.15 16.67 5 3.03 18.18 3.03 10.61 6.10 12.12 7.61 3.03 9.09 9.09 Total 100.00 100.00 100.00 100.00 100.00 100.00 100.00 100.00 100.00 100.00 N=66
1= strongly agree – 5= strongly disagree
1. When there is a choice, I always choose the product that contributes to the least amount of environmental damage. 2. I have switched products for environmental reasons.
3. If I understand the potential damage to the environment that some products can cause, I do not purchase those products. 4. I do not buy household products that harm the environment.
5. Whenever possible, I buy products packaged in reusable or recyclable containers.
6. I make every effort to buy paper products (toilet paper, tissues, etc.) made from recycled paper. 7. I will not buy a product if I know that the company that sells it is socially irresponsible.
8. I do not buy products from companies that I know use sweatshop labour, child labour, or other poor working conditions. 9. I have paid more for environmentally friendly products when there is a cheaper alternative.
10. I have paid more for socially responsible products when there is a cheaper alternative.
Ethical Minded Consumer Behaviour - Female
1. 2. 3. 4. 5. 6. 7. 8. 9. 10.
19 1 9.09 3.03 15.15 0 13.64 7.61 15.15 15.15 16.71 13.64
2 42.42 37.91 50 25.76 45.45 28.81 24.24 39.39 40.91 34.85 3 22.73 25.81 22.73 25.76 13.64 27.27 39.39 15.15 18.18 24.24 4 22.73 22.73 12.12 42.42 24.24 27.27 16.71 27.27 13.64 16.71 5 3.03 10.60 3.03 6.06 3.03 9.09 4.55 3.03 10.61 10.60 Total 100.00 100.00 100.00 100.00 100.00 100.00 100.00 100.00 100.00 100.00 N=66
1. When there is a choice, I always choose the product that contributes to the least amount of environmental damage. 2. I have switched products for environmental reasons.
3. If I understand the potential damage to the environment that some products can cause, I do not purchase those products. 4. I do not buy household products that harm the environment.
5. Whenever possible, I buy products packaged in reusable or recyclable containers.
6. I make every effort to buy paper products (toilet paper, tissues, etc.) made from recycled paper. 7. I will not buy a product if I know that the company that sells it is socially irresponsible.
8. I do not buy products from companies that I know use sweatshop labour, child labour, or other poor working conditions. 9. I have paid more for environmentally friendly products when there is a cheaper alternative.
10. I have paid more for socially responsible products when there is a cheaper alternative.
Green Products Identification Ability – Male Experiment
Day I Day II
1. I can recognize green products among other products.
2. I am aware of green products.
3. I can identify green products .
4. I do know the difference between green products and standard products.
1. I can recogniz e green products among other products .
2. I am aware of green products . 3. I can identif y green produc ts.
20 Percent Percent Percent Percent Percent Percent Percent Percent
1 21.86 21.86 28.13 28.13 25 31.25 25 25
2 56.25 59.36 46.88 53.13 56.25 40.63 50 46.88
3 9.38 15.63 21.88 15.63 15.63 21.88 21.88 15.63
4 9.38 0 0 0 3.13 6,25 3.13 12.5
5 3.13 3.13 3.13 3.13 0 0 0 0
Total 100.00 100.00 100.00 100.00 100.00 100.00 100.00 100.00
21 Green Products Identification Ability – Female Control
Day I Day II
1. I can recognize green products among other products.
2. I am aware of green products.
3. I can identify green products.
4. I do know the difference between green products and standard products.
1. I can recognize green products among other products.
2. I am aware of green products . 3. I can identi fy green produ cts.
4. I do know the difference between green products and standard products.
Percent Percent Percent Percent Percent Percent Percent Percent
1 18.75 28.13 28.31 25 25 34.38 31.25 31.25
2 46.88 43.75 37.5 53.13 59.41 46.88 46.88 53.13
3 18.75 15.63 21.86 9.38 6.25 9.38 9.38 6.25
4 15.63 6.06 12.5 12.5 6.25 6.25 6.25 6.25
5 0 0 0 0 3.13 3.13 3.13 3.13
Total 100.00 100.00 100.00 100.00 100.00 100.00 100.00 100.00
22 Green Products Identification Ability – Female Experiment
Day I Day II
1. I can recogniz e green products among other products .
2. I am aware of green produc ts.
3. I can identify green products.
4. I do know the difference between green products and standard products.
1. I can recognize green products among other products.
2. I am aware of green produc ts.
3. I can identify green products .
4. I do know the difference between green products and standard products.
Percent Percent Percent Percent Percent Percent Percent Percent
1 29.41 35.29 35.29 35.29 35.29 44.12 41.18 35.29
2 64.71 58.82 55.88 52.94 58.82 47.06 50 52.94
3 2.94 0 2.94 0 8.82 5.88 5.88 2.94
4 0 2.94 2.94 5.88 2.94 2.94 0 2.94
5 2.94 2.94 2.94 5.88 0 0 2.94 5.88
23 Green Products Identification Ability – Male Control
Day I Day II
1. I can recogniz e green products among other products .
2. I am aware of green produc ts.
3. I can identify green products.
4. I do know the difference between green products and standard products.
1. I can recognize green products among other products.
2. I am aware of green product s. 3. I can identif y green produc ts.
4. I do know the difference between green products and standard products.
Percent Percent Percent Percent Percent Percent Percent Percent
1 14.71 20.59 20.59 23.53 29.41 35.29 32.35 32.35
2 44.12 55.89 52.94 41.18 44.12 47.1 47.1 47.06
3 20.59 11.76 14.71 23.53 17.65 11.76 5.88 8.82
4 20.59 11.76 14.71 8.82 8.82 5.88 14.71 11.76
5 0 0 0 2.94 0 0 0 0
Total 100.00 100.00 100.00 100.00 100.00 100.00 100.00 100.00
Health Consciousness - Male 1. I reflect
about my health a lot.
2. I'm very self-conscious about my health.
3. I'm generally attentive to my inner feelings about my health.
4. I'm constantly examining my health.
5. I'm alert to changes in my health.
6. I'm usually aware of my health.
7. I'm aware of the state of my health as I go through the day.
Percent Percent Percent Percent Percent Percent Percent
24
2 43.94 48.48 48.48 18.18 59.09 51.52 46.97
3 10.61 10.61 15.15 33.33 9.09 13.64 19.7
4 3.03 4.55 1.52 24.24 9.09 0 3.03
5 0 1.52 0 7.58 0 0 0
Total 100.00 100.00 100.00 100.00 100.00 100.00 100.00
25 Health Consciousness - Female
1. I reflect about my health a lot.
2. I'm very self-conscious about my health.
3. I'm generally attentive to my inner feelings about my health.
4. I'm constantly examining my health.
5. I'm alert to changes in my health.
6. I'm usually aware of my health.
7. I'm aware of the state of my health as I go through the day.
Percent Percent Percent Percent Percent Percent Percent
1 40.9 42.42 27.27 15.15 27.27 45.45 30.30
2 51.52 43.94 54.55 30.30 56.06 45.45 54.55
3 4.55 9.09 13.64 19.70 10.61 6.06 7.58
4 0 1.52 3.03 27.27 3.03 0 4.55
5 3.03 3.03 1.52 7.58 3.03 3.03 3.03
Total 100.00 100.00 100.00 100.00 100.00 100.00 100.00
26 Health Risk Assessment – Male Experiment Group
Day I Day II
1. How likely are you to have serious health problems in your lifetime?
2. How applicable is this issue to you?
3. How serious a threat are serious health problems to you
1. How likely are you to have serious health problems in your lifetime?
2. How applicable is this issue to you?
3. How serious a threat are serious health problems to you
Percent Percent Percent Percent Percent Percent
1 11.76 3.13 9.38 3.13 3.13 9.38
2 18.75 15.63 15.63 37.5 28.13 25
3 24.24 53.13 46.88 50 53.13 40.63
4 9.09 21.88 25 6.25 12.5 21.88
5 0 6.25 3.13 3.13 3.13 3.13
Total 100.00 100.00 100.00 100.00 100.00 100.00
27 Health Risk Assessment – Female Control Group
Day I Day II
1. How likely are you to have serious health problems in your lifetime?
2. How applicable is this issue to you?
3. How serious a threat are serious health problems to you
1. How likely are you to have serious health problems in your lifetime?
2. How applicable is this issue to you?
3. How serious a threat are serious health problems to you
Percent Percent Percent Percent Percent Percent
1 3.13 0 9.38 9.38 3.13 9.38
2 21.88 15.63 31.25 18.75 12.5 6.25
3 34.38 50 34.38 43.75 62.5 53.13
4 21.88 21.88 12.5 21.88 15.63 25
5 18.75 12.5 12.5 6.25 6.25 6.25
Total 100.00 100.00 100.00 100.00 100.00 100.00
28 Health Risk Assessment – Female Experiment Group
Day I Day II
1. How likely are you to have serious health problems in your lifetime?
2. How applicable is this issue to you?
3. How serious a threat are serious health problems to you
1. How likely are you to have serious health problems in your lifetime?
2. How applicable is this issue to you?
3. How serious a threat are serious health problems to you
Percent Percent Percent Percent Percent Percent
1 0 0 5.88 0 2.94 2.94
2 29.41 17.65 23.53 29.41 20.59 17.65
3 35.29 38.24 29.42 41.12 29.41 41.18
4 23.53 20.59 23.53 20.59 29.41 26.47
5 11.76 23.53 17.65 8.82 17.65 11.76
Total 100.00 100.00 100.00 100.00 100.00 100.00
29 Health Risk Assessment – Male Control Group
Day I Day II
1. How likely are you to have serious health problems in your lifetime?
2. How applicable is this issue to you?
3. How serious a threat are serious health problems to you
1. How likely are you to have serious health problems in your lifetime?
2. How applicable is this issue to you?
3. How serious a threat are serious health problems to you
Percent Percent Percent Percent Percent Percent
1 0 0 14.71 2.94 5.88 11.76
2 20.59 11.76 14.71 14.71 8.82 14.71
3 32.35 50 29.41 38.24 50 38.24
4 32.35 23.53 35.29 26.47 26.47 29.41
5 14.71 14.71 5.88 17.65 8.82 5.88
Total 100.00 100.00 100.00 100.00 100.00 100.00
30 Attitude towards consuming the food – salmon – Male Experiment Group
Day I Day II
1. Eating salmon would be
pleasurable.
2. I would enjoy eating salmon.
3. Salmon would be satisfying.
4. Salmon would taste good.
1. Eating salmon would be pleasurable.
2. I would enjoy eating salmon.
3. Salmon would be satisfying.
4. Salmon would taste good.
Percent Percent Percent Percent Percent Percent Percent Percent
1 53.13 53.13 46.88 56.25 21.88 21.88 21.88 28.13
2 34.38 21.88 25 25 46.88 53.13 43.75 50
3 9.38 18.75 21.88 12.5 25 18.75 18.75 18.75
4 0 3.13 3.13 3.13 6.25 6.25 12.5 0
5 3.13 3.13 3.13 3.13 0 0 3.13 3.13
Total 100.00 100.00 100.00 100.00 100.00 100.00 100.00 100.00
31 Attitude towards consuming the food – salmon – Female Control Group
Day I Day II
1. Eating salmon would be
pleasurable.
2. I would enjoy eating salmon.
3. Salmon would be satisfying.
4. Salmon would taste good.
1. Eating salmon would be pleasurable.
2. I would enjoy eating salmon.
3. Salmon would be satisfying.
4. Salmon would taste good.
Percent Percent Percent Percent Percent Percent Percent Percent
1 56.25 56.25 46.88 50 50 53.13 46.88 50
2 18.75 18.75 28.13 31.25 21.88 18.75 21.88 25
3 15.63 15.63 9.38 9.38 18.75 15.63 21.88 12.5
4 9.38 9.38 15.63 9.38 3.13 6.25 3.13 6.25
5 0 0 0 0 6.25 6.25 6.25 6.25
Total 100.00 100.00 100.00 100.00 100.00 100.00 100.00 100.00
32 Attitude towards consuming the food – salmon – Female Experiment Group
Day I Day II
1. Eating salmon would be
pleasurable.
2. I would enjoy eating salmon.
3. Salmon would be satisfying.
4. Salmon would taste good.
1. Eating salmon would be pleasurable.
2. I would enjoy eating salmon.
3. Salmon would be satisfying.
4. Salmon would taste good.
Percent Percent Percent Percent Percent Percent Percent Percent
1 50.0 50.0 44.1 47.1 35.3 35.3 32.4 47.1
2 26.5 23.5 23.5 29.4 35.3 35.3 32.4 23.5
3 5.9 8.8 14.7 8.8 14.7 11.8 17.6 20.6
4 14.7 14.7 14.7 11.8 11.8 11.8 14.7 5.9
5 2.9 2.9 2.9 2.9 2.9 5.9 2.9 2.9
Total 100.00 100.00 100.00 100.00 100.00 100.00 100.00 100.00
33 Attitude towards consuming the food – salmon – Male Control Group
Day I Day II
1. Eating salmon would be
pleasurable.
2. I would enjoy eating salmon.
3. Salmon would be satisfying.
4. Salmon would taste good.
1. Eating salmon would be pleasurable.
2. I would enjoy eating salmon.
3. Salmon would be satisfying.
4. Salmon would taste good.
Percent Percent Percent Percent Percent Percent Percent Percent
1 47.1 44.1 38.2 38.2 35.3 38.2 38.2 44.1
2 23.5 26.5 26.5 35.3 32.4 26.5 23.5 32.3
3 11.8 11.8 11.8 8.8 20.6 20.6 23.5 8.8
4 8.8 5.9 11.8 8.8 5.9 5.9 5.9 5.9
5 8.8 11.8 11.8 8.8 5.9 8.8 8.8 8.8
Total 100.00 100.00 100.00 100.00 100.00 100.00 100.00 100.00
34 Health Benefits of the Product - Long Term – Male Experiment Group
Day I Day II
1. To what extent were your thoughts about the long-term benefits of
consuming salmon?
2. To what extent were your thoughts about staying healthy in the long run?
3. To what extent were your thoughts about the long-reaching
consequences of your diet?
1. To what extent were your thoughts about the long-term benefits of
consuming salmon?
2. To what extent were your
thoughts about staying healthy in the long run?
3. To what extent were your thoughts about the long-reaching
consequences of your diet?
Percent Percent Percent Percent Percent Percent
1 6.25 6.25 6.25 9.38 15.63 12.5
2 21.88 34.38 28.13 31.25 46.88 34.38
3 28.13 34.38 40.63 34.38 21.88 34.38
4 25 12.5 15.63 21.88 12.5 18.75
5 18.75 12.5 9.38 3.13 3.13 0
Total 100.00 100.00 100.00 100.00 100.00 100.00
35 Health Benefits of the Product - Long Term – Female Control Group
Day I Day II
1. To what extent were your thoughts about the long-term benefits of
consuming salmon?
2. To what extent were your thoughts about staying healthy in the long run?
3. To what extent were your thoughts about the long-reaching
consequences of your diet?
1. To what extent were your thoughts about the long-term benefits of
consuming salmon?
2. To what extent were your
thoughts about staying healthy in the long run?
3. To what extent were your thoughts about the long-reaching
consequences of your diet?
Percent Percent Percent Percent Percent Percent
1 15.63 25 21.88 21.88 25 12.5
2 21.88 31.25 40.63 15.63 31.25 50
3 18.75 25 15.63 31.25 18.75 25
4 25 6.25 6.25 15.63 18.75 0
5 18.75 12.5 15.63 15.63 6.25 12.5
Total 100.00 100.00 100.00 100.00 100.00 100.00
36 Health Benefits of the Product - Long Term – Female Experiment Group
Day I Day II
1. To what extent were your thoughts about the long-term benefits of
consuming salmon?
2. To what extent were your thoughts about staying healthy in the long run?
3. To what extent were your thoughts about the long-reaching
consequences of your diet?
1. To what extent were your thoughts about the long-term benefits of
consuming salmon?
2. To what extent were your
thoughts about staying healthy in the long run?
3. To what extent were your thoughts about the long-reaching
consequences of your diet?
Percent Percent Percent Percent Percent Percent
1 29.4 14.7 26.5 11.8 20.6 17.6
2 14.7 20.6 17.6 20.6 29.4 32.4
3 26.4 17.6 26.5 32.4 26.5 41.2
4 17.6 32.4 17.6 20.6 14.7 8.8
5 11.8 14.7 11.8 14.7 8.8 0
Total 100.00 100.00 100.00 100.00 100.00 100.00
37 Health Benefits of the Product - Long Term – Male Control Group
Day I Day II
1. To what extent were your thoughts about the long-term benefits of
consuming salmon?
2. To what extent were your thoughts about staying healthy in the long run?
3. To what extent were your thoughts about the long-reaching
consequences of your diet?
1. To what extent were your thoughts about the long-term benefits of
consuming salmon?
2. To what extent were your
thoughts about staying healthy in the long run?
3. To what extent were your thoughts about the long-reaching
consequences of your diet?
Percent Percent Percent Percent Percent Percent
1 20.6 23.5 20.6 14.7 20.6 17.6
2 20.6 23.5 26.5 14.7 26.5 32.4
3 5.9 26.5 29.4 44.1 44.1 41.2
4 29.4 11.8 14.7 8.8 5.9 8.8
5 23.5 14.7 8.8 17.6 2.9 0
Total 100.00 100.00 100.00 100.00 100.00 100.00
38 Edibility of the Product – Male Experiment Group
Day I Day II
1. How likely are you to ingest this product?
2. How likely are you to eat this product?
3. How edible is this product?
1. How likely are you to ingest this product?
2. How likely are you to eat this product?
3. How edible is this product?
Percent Percent Percent Percent Percent Percent
1 31.25 31.25 43.75 9.38 12.5 6.25
2 50 59.38 34.38 53.13 53.13 34.38
3 12.5 3.13 15.63 18.75 9.38 21.88
4 0 0 3.13 12.5 15.63 21.88
5 6.25 6.25 3.13 6.25 9.38 15.63
Total 100.00 100.00 100.00 100.00 100.00 100.00
39 Edibility of the Product – Female Control Group
Day I Day II
1. How likely are you to ingest this product?
2. How likely are you to eat this product?
3. How edible is this product?
1. How likely are you to ingest this product?
2. How likely are you to eat this product?
3. How edible is this product?
Percent Percent Percent Percent Percent Percent
1 37.5 43.75 31.25 28.13 34.38 34.38
2 40.63 37.5 31.25 46.88 34.38 31.25
3 18.75 15.63 34.38 18.75 18.75 25
4 3.13 3.13 3.13 3.13 9.38 6.25
5 0 0 0 3.13 3.13 3.13
Total 100.00 100.00 100.00 100.00 100.00 100.00
40 Edibility of the Product – Female Experiment Group
Day I Day II
1. How likely are you to ingest this product?
2. How likely are you to eat this product?
3. How edible is this product?
1. How likely are you to ingest this product?
2. How likely are you to eat this product?
3. How edible is this product?
Percent Percent Percent Percent Percent Percent
1 44.1 41.2 52.9 23.5 20.6 29.4
2 26.5 35.3 23.5 38.2 44.1 44.1
3 11.8 5.9 11.8 14.7 11.8 8.8
4 14.7 14.7 8.8 14.7 17.6 11.8
5 2.9 2.9 2.9 8.8 5.9 5.9
Total 100.0 100.00 100.00 100.00 100.00 100.00
41 Edibility of the Product – Male Control Group
Day I Day II
1. How likely are you to ingest this product?
2. How likely are you to eat this product?
3. How edible is this product?
1. How likely are you to ingest this product?
2. How likely are you to eat this product?
3. How edible is this product?
Percent Percent Percent Percent Percent Percent
1 32.4 29.4 35.3 29.4 32.4 32.4
2 35.3 44.1 35.3 35.3 29.4 29.4
3 11.8 8.8 17.6 11.8 23.5 23.5
4 11.8 8.8 5.9 14.7 5.9 5.9
5 8.8 8.8 5.9 8.8 8.8 8.8
Total 100.00 100.00 100.00 100.00 100.00 100.00
42 Willingness to pay a Price Premium
Willingness to pay a Price Premium 1 – Group 1 (Male Experiment – Female Control) “I am willing to pay more for wild salmon than for farmed salmon.“
Male Experiment Group Day I
Male Experiment Group Day II
Female Control Group Day I
Female Control Group Day II
Female Control Group after watching Video
Percent Percent Percent Percent Percent
1 25 34.38 9.38 28.13 53.13
2 46.88 46.88 59.38 37.5 25
3 18.75 12.5 28.13 21.88 18.75
4 6.25 6.25 0 9.38 0
5 3.13 0 3.13 3.13 3.13
Total 100.00 100.00 100.00 100.00 100.00
43 Willingness to pay a Price Premium 1 – Group 2 (Female Experiment – Male Control)
“I am willing to pay more for wild salmon than for farmed salmon “
Female Experiment Group Day I
Female Experiment Group Day II
Male Control Group Day I
Male Control Group Day II
Male Control Group after watching Video
Percent Percent Percent Percent Percent
1 23.5 32.4 20.6 20.6 38.2
2 29.4 44.1 35.5 41.1 35.3
3 14.7 14.7 20.6 11.8 17.6
4 23.5 5.9 17.6 14.7 2.9
5 8.8 2.9 5.9 11.8 5.9
Total 100.00 100.00 100.00 100.00 100.00
44 Willingness to pay a Price Premium 2 – Group 1 (Male Experiment – Female Control)
“I am willing to pay ___% more for wild salmon over farmed salmon.“
Male Experiment Group Day I
Male Experiment Group Day II
Female Control Group Day I
Female Control Group Day II
Female Control Group after watching Video
Percent Percent Percent Percent Percent
0 – 20 % 56.3 40.6 56.3 46.9 31.3
20 – 30 % 18.7 12.5 31.2 25 6.2
30 – 50% 18.8 40.7 12.5 28.1 50
50 – 80% 3.1 0 0 0 9.4
80 – 200% 3.1 6.2 0 0 3.1
Total 100.00 100.00 100.00 100.00 100.00
45 Willingness to pay a Price Premium 2 – Group 2 (Female Experiment – Male Control)
“I am willing to pay ___% more for wild salmon over farmed salmon.“
Female Experiment Group Day I
Female Experiment Group Day II
Male Control Group Day I
Male Control Group Day II
Male Control Group after watching Video
Percent Percent Percent Percent Percent
0 – 20 % 61.8 52.9 61.8 50.0 41.2
20 – 30 % 11.7 17.7 17.6 23.5 17.6
30 – 50% 14.7 14.7 17.6 20.6 14.8
50 – 80% 5.9 5.9 14.7 0 17.6
80 – 200% 5.9 5.9 2.9 5.9 8.8
Total 100.00 100.00 100.00 100.00 100.00
46 Willingness to pay a Price Premium 2 – Group 1 (Male Experiment – Female Control)
“How much would be available to pay for each product in €/kg?”
Farmed Salmon
Male Experiment Group Day I
Male Experiment Group Day II
Female Control Group Day I
Female Control Group Day II
Female Control Group after watching Video
Percent Percent Percent Percent Percent
0 – 5 9.4 9.4 3.1 12.5 15.6
5 – 10 46.9 43.7 40.7 46.9 46.9
10 – 15 28.1 31.3 37.5 31.2 25
15 – 20 6.2 6.2 9.3 0 0
20 - >20 9.4 9.4 9.4 9.4 12.5
Total 100.00 100.00 100.00 100.00 100.00
47 Willingness to pay a Price Premium 2 – Group 1 (Male Experiment – Female Control)
“How much would be available to pay for each product in €/kg?”
Wild Salmon
Male Experiment Group Day I
Male Experiment Group Day II
Female Control Group Day I
Female Control Group Day II
Female Control Group after watching Video
Percent Percent Percent Percent Percent
0 – 5 0 0 3.1 3.1 3.1
5 – 10 18.8 25.0 25 18.8 18.8
10 – 15 34.3 28.1 21.9 28.1 28.1
15 – 20 28.2 28.2 31.3 34.4 31.3
20 - >20 18.7 18.7 18.7 15.6 18.7
Total 100.00 100.00 100.00 100.00 100.00
48 Willingness to pay a Price Premium 2 – Group 2 (Female Experiment – Male Control)
“How much would be available to pay for each product in €/kg?”
Farmed Salmon
Female
Experiment Group Day I
Female Experiment Group Day II
Male Control Group Day I
Male Control Group Day II
Male Control Group after watching Video
Percent Percent Percent Percent Percent
0 – 5 17.6 20.6 23.5 23.5 29.4
5 – 10 50.0 61.8 35.3 26.5 44.1
10 – 15 17.6 5.9 23.5 29.4 11.8
15 – 20 8.8 5.9 11.7 11.8 8.8
20 - >20 5.9 5.9 5.9 8.8 5.9
Total 100.00 100.00 100.00 100.00 100.00
49 Willingness to pay a Price Premium 2 – Group 2 (Female Experiment – Male Control)
“How much would be available to pay for each product in €/kg?”
Wild Salmon
Female
Experiment Group Day I
Female Experiment Group Day II
Male Control Group Day I
Male Control Group Day II
Male Control Group after watching Video
Percent Percent Percent Percent Percent
0 – 5 2.9 5.9 11.8 8.8 5.9
5 – 10 32.4 26.5 29.4 23.6 20.9
10 – 15 26.5 29.4 23.5 20.5 17.6
15 – 20 23.5 23.5 17.7 26.5 23.5
20 - >20 14.7 14.7 17.7 20.6 32.4
Total 100.00 100.00 100.00 100.00 100.00
50
3.
Multivariate Analysis
3.1 Factor Analysis Group 1: Male Experiment Group Day 1
Factor Analysis of Ethical Consumer Behaviour Male Experiment Day 1
Total Variance Explained
Initial Eigenvalues Extraction Sums of Squared Loadings Component Total % of Variance Cumulative % Total % of Variance Cumulative %
1 4.701 47.008 47.008 4.701 47.008 47.008
2 1.532 15.32 62.328 1.532 15.32 62.328
3 0.972 9.721 72.049
4 0.748 7.483 79.532
5 0.618 6.18 85.712
6 0.432 4.317 90.029
7 0.423 4.23 94.26
8 0.287 2.865 97.125
9 0.194 1.936 99.061
10 0.094 0.939 100
Extraction Method: Principal Component Analysis.
Reliability Statistics
Cronbach's Alpha N of Items
0.865 10
KMO and Bartlett's Test
Kaiser-Meyer-Olkin Measure of Sampling
Adequacy. 0.758
Bartlett's Test of Sphericity Approx. Chi-Square 155.175
df 45
51
Factor Analysis of Green Products Identification Ability Male Experiment Day 1
Total Variance Explained
Initial Eigenvalues Extraction Sums of Squared Loadings Component Total % of Variance Cumulative % Total % of Variance Cumulative %
1 2.68 66.996 66.996 2.68 66.996 66.996
2 0.79 19.742 86.737
3 0.381 9.516 96.253
4 0.15 3.747 100
Extraction Method: Principal Component Analysis.
KMO and Bartlett's Test
Kaiser-Meyer-Olkin Measure of Sampling Adequacy. 0.697 Bartlett's Test of Sphericity Approx. Chi-Square 60.961
df 6
Sig. 0
Reliability Statistics
Cronbach's Alpha N of Items
52
Factor Analysis of Health Consciousness Male Experiment Day 1
Total Variance Explained
Initial Eigenvalues Extraction Sums of Squared Loadings
Component Total % of Variance Cumulative % Total % of Variance Cumulative %
1 2.884 41.195 41.195 2.884 41.195 41.195
2 1.163 16.621 57.816 1.163 16.621 57.816
3 0,89 12.717 70.533
4 0,8 11.434 81.967
5 0.534 7.624 89.591
6 0.491 7.016 96.608
7 0.237 3.392 100
Extraction Method: Principal Component Analysis.
a When components are correlated, sums of squared loadings cannot be added to obtain a total variance.
KMO and Bartlett's Test
Kaiser-Meyer-Olkin Measure of Sampling Adequacy. 0.599
Bartlett's Test of Sphericity Approx. Chi-Square 53.028
df 21
Sig. 0
Reliability Statistics
Cronbach's Alpha N of Items
53
Factor Analysis of Health Risk Assessment Male Experiment Day 1
Total Variance Explained
Initial Eigenvalues Extraction Sums of Squared Loadings Component Total % of Variance Cumulative % Total % of Variance Cumulative %
1 1.904 63.477 63.477 1.904 63.477 63.477
2 0.73 24.322 87.799
3 0.366 12.201 100
Extraction Method: Principal Component Analysis.
KMO and Bartlett's Test
Kaiser-Meyer-Olkin Measure of Sampling Adequacy. 0.586
Bartlett's Test of Sphericity Approx. Chi-Square 19.719
df 3
Sig. 0
Reliability Statistics
Cronbach's Alpha N of Items
54
Factor Analysis of Attitude towards consuming the food Male Experiment Day 1
Total Variance Explained
Initial Eigenvalues Extraction Sums of Squared Loadings
Component Total % of Variance Cumulative % Total % of Variance Cumulative %
1 3.34 83.503 83.503 3,34 83.503 83.503
2 0.351 8.764 92.267
3 0.236 5.893 98.16
4 0.074 1.84 100
Extraction Method: Principal Component Analysis.
KMO and Bartlett's Test
Kaiser-Meyer-Olkin Measure of Sampling Adequacy. 0.752
Bartlett's Test of Sphericity Approx. Chi-Square 112.345
df 6
Sig. 0
Reliability Statistics
Cronbach's Alpha N of Items
55
Factor Analysis of Edibility of the food Male Experiment Day 1
Total Variance Explained
Initial Eigenvalues Extraction Sums of Squared Loadings Component Total % of Variance Cumulative % Total % of Variance Cumulative %
1 1.968 65.601 65.601 1,968 65.601 65.601
2 0.989 32.982 98.583
3 0.043 1.417 100
Extraction Method: Principal Component Analysis.
KMO and Bartlett's Test
Kaiser-Meyer-Olkin Measure of Sampling Adequacy. 0.493
Bartlett's Test of Sphericity Approx. Chi-Square 72.666
df 3
Sig. 0
Reliability Statistics
Cronbach's Alpha N of Items
56
Factor Analysis of Health Benefits of the Product
Total Variance Explained
Initial Eigenvalues Extraction Sums of Squared Loadings Component Total % of Variance Cumulative % Total % of Variance Cumulative %
1 2.413 80.449 80.449 2,413 80.449 80.449
2 0.331 11.044 91.493
3 0.255 8.507 100
Extraction Method: Principal Component Analysis.
KMO and Bartlett's Test
Kaiser-Meyer-Olkin Measure of Sampling Adequacy. 0.739
Bartlett's Test of Sphericity Approx. Chi-Square 46.353
df 3
Sig. 0
Reliability Statistics
Cronbach's Alpha N of Items
57
Factor Analysis of Health Benefits of the Product (after exposure so stimulus)
Total Variance Explained
Initial Eigenvalues Extraction Sums of Squared Loadings Component Total % of Variance Cumulative % Total % of Variance Cumulative %
1 2.317 77.237 77.237 2.317 77.237 77.237
2 0.459 15.311 92.548
3 0.224 7.452 100
Extraction Method: Principal Component Analysis.
KMO and Bartlett's Test
Kaiser-Meyer-Olkin Measure of Sampling Adequacy. 0.692
Bartlett's Test of Sphericity Approx. Chi-Square 41.876
df 3
Sig. 0
Reliability Statistics
Cronbach's Alpha N of Items
58
3.2 Factor Analysis Group 1: Male Experiment Group Day 2
Factor Analysis of Green Products Identification Ability
Total Variance Explained
Initial Eigenvalues Extraction Sums of Squared Loadings Component Total % of Variance Cumulative % Total % of Variance Cumulative %
1 3.002 75.061 75.061 3.002 75.061 75.061
2 0.536 13.393 88.455
3 0.313 7.835 96.29
4 0.148 3.71 100
Extraction Method: Principal Component Analysis.
KMO and Bartlett's Test
Kaiser-Meyer-Olkin Measure of Sampling Adequacy. 0.798
Bartlett's Test of Sphericity Approx. Chi-Square 74.757
df 6
Sig. 0
Reliability Statistics
Cronbach's Alpha N of Items
59
Factor Analysis of Health Risk Assessment
Total Variance Explained
Initial Eigenvalues Extraction Sums of Squared Loadings Component Total % of Variance Cumulative % Total % of Variance Cumulative %
1 1,963 65.447 65.447 1.963 65.447 65.447
2 0.69 23.014 88.461
3 0.346 11.539 100
Extraction Method: Principal Component Analysis.
KMO and Bartlett's Test
Kaiser-Meyer-Olkin Measure of Sampling Adequacy. 0.601
Bartlett's Test of Sphericity Approx. Chi-Square 22.068
df 3
Sig. 0
Reliability Statistics
Cronbach's Alpha N of Items
60
Factor Analysis of Attitude towards consuming the food
Total Variance Explained
Initial Eigenvalues Extraction Sums of Squared Loadings Component Total % of Variance Cumulative % Total % of Variance
Cumulative %
1 2.568 64.189 64.189 2.568 64.189 64.189
2 0.697 17.435 81.624
3 0.404 10.111 91.735
4 0.331 8.265 100
Extraction Method: Principal Component Analysis.
KMO and Bartlett's Test
Kaiser-Meyer-Olkin Measure of Sampling Adequacy. 0.746
Bartlett's Test of Sphericity Approx. Chi-Square 41.218
df 6
Sig. 0
Reliability Statistics
Cronbach's Alpha N of Items
61
Factor Analysis of Edibility of the food
Total Variance Explained
Initial Eigenvalues Extraction Sums of Squared Loadings Component Total % of Variance Cumulative % Total % of Variance Cumulative %
1 2.484 82.814 82.814 2.484 82.814 82.814
2 0.409 13.65 96.464
3 0.106 3.536 100
Extraction Method: Principal Component Analysis.
KMO and Bartlett's Test
Kaiser-Meyer-Olkin Measure of Sampling Adequacy. 0.687
Bartlett's Test of Sphericity Approx. Chi-Square 64.932
df 3
Sig. 0
Reliability Statistics
Cronbach's Alpha N of Items
62
Factor Analysis of Health Benefits of the Product
Total Variance Explained
Initial Eigenvalues Extraction Sums of Squared Loadings Component Total % of Variance Cumulative % Total % of Variance Cumulative %
1 2.361 78.687 78.687 2.361 78.687 78.687
2 0.468 15.584 94.27
3 0.172 5.73 100
Extraction Method: Principal Component Analysis.
KMO and Bartlett's Test
Kaiser-Meyer-Olkin Measure of Sampling Adequacy. 0.675
Bartlett's Test of Sphericity Approx. Chi-Square 48.484
df 3
Sig. 0
Reliability Statistics
Cronbach's Alpha N of Items
63
3.3 Factor Analysis Group 1: Female Control Group Day 1
Factor Analysis of Ethical Consumer Behaviour
KMO and Bartlett's Test
Kaiser-Meyer-Olkin Measure of Sampling Adequacy. 0.617
Bartlett's Test of Sphericity Approx. Chi-Square 78.891
df 45
Sig. 0.001
Reliability Statistics
Cronbach's Alpha N of Items
0.715 10
Total Variance Explained
Initial Eigenvalues
Extraction Sums of Squared Loadings
Rotation Sums of Squared Loadingsa
Component Total
% of Variance
Cumulative
% Total
% of Variance
Cumulative
% Total
1 2.985 29.847 29.847 2.985 29.847 29.847 2,495
2 1.626 16.262 46.109 1.626 16.262 46.109 2,038
3 1.466 14.659 60.768 1.466 14.659 60.768 1,685
4 1.074 10.736 71.505 1.074 10.736 71.505 1,334
5 0.788 7.884 79.388
6 0.606 6.055 85.443
7 0.562 5.615 91.059
8 0.348 3.484 94.543
9 0.292 2.918 97.461
64
Factor Analysis of Green Products Identification Ability
Total Variance Explained
Initial Eigenvalues
Extraction Sums of Squared Loadings
Component Total % of Variance Cumulative % Total % of Variance
Cumulative %
1 2.979 74.48 74.48 2.979 74.48 74.48
2 0.526 13.151 87.632
3 0.37 9.248 96.879
4 0.125 3.121 100
Extraction Method: Principal Component Analysis.
KMO and Bartlett's Test
Kaiser-Meyer-Olkin Measure of Sampling Adequacy. 0.685
Bartlett's Test of Sphericity Approx. Chi-Square 75.718
df 6
Sig. 0
Reliability Statistics
Cronbach's Alpha N of Items
65
Factor Analysis of Health Consciousness
Total Variance Explained
Initial Eigenvalues Extraction Sums of Squared Loadings Component Total % of Variance Cumulative % Total % of Variance Cumulative %
1 4.386 62.655 62.655 4.386 62.655 62.655
2 0.794 11.337 73.992
3 0.572 8.172 82.164
4 0.496 7.088 89.252
5 0.391 5.592 94.845
6 0.221 3.155 98
7 0.14 2 100
Extraction Method: Principal Component Analysis.
KMO and Bartlett's Test
Kaiser-Meyer-Olkin Measure of Sampling Adequacy. 0.801 Bartlett's Test of Sphericity Approx. Chi-Square 123.198
df 21
Sig. 0
Reliability Statistics
Cronbach's Alpha N of Items
66
Factor Analysis of Health Risk Assessment
Total Variance Explained
Initial Eigenvalues Extraction Sums of Squared Loadings Component Total % of Variance Cumulative % Total % of Variance Cumulative %
1 2.086 69.521 69.521 2.086 69.521 69.521
2 0.696 23.193 92.714
3 0.219 7.286 100
Extraction Method: Principal Component Analysis.
KMO and Bartlett's Test
Kaiser-Meyer-Olkin Measure of Sampling Adequacy. 0.533 Bartlett's Test of Sphericity Approx. Chi-Square 33.49
df 3
Sig. 0
Reliability Statistics
Cronbach's
Alpha N of Items
67
Factor Analysis of Attitude Towards Consuming the Food
Total Variance Explained
Initial Eigenvalues Extraction Sums of Squared Loadings Component Total % of Variance Cumulative % Total % of Variance Cumulative %
1 3.546 88.66 88.66 3.546 88.66 88.66
2 0.257 6.427 95.086
3 0.177 4.43 99.516
4 0.019 0.484 100
Extraction Method: Principal Component Analysis.
KMO and Bartlett's Test
Kaiser-Meyer-Olkin Measure of Sampling Adequacy. 0.686 Bartlett's Test of Sphericity Approx. Chi-Square 166.316
df 6
Sig. 0
Reliability Statistics
Cronbach's Alpha N of Items
68
Factor Analysis of Health Benefits of the Product
Total Variance Explained
Initial Eigenvalues
Extraction Sums of Squared Loadings
Component Total % of Variance Cumulative % Total % of Variance
Cumulative %
1 2.536 84.53 84.53 2.536 84,53 84,53
2 0.334 11.117 95.646
3 0.131 4.354 100
Extraction Method: Principal Component Analysis.
KMO and Bartlett's Test
Kaiser-Meyer-Olkin Measure of Sampling
Adequacy. 0.712
Bartlett's Test of Sphericity Approx. Chi-Square 64.257
df 3
Sig. 0
Reliability Statistics
Cronbach's Alpha N of Items
69
Factor Analysis of Edibility of the Food
KMO and Bartlett's Test
Kaiser-Meyer-Olkin Measure of Sampling Adequacy. 0.614 Bartlett's Test of Sphericity Approx. Chi-Square 46.784
df 3
Sig. 0
Reliability Statistics
Cronbach's Alpha N of Items
0.823 3
Total Variance Explained
Initial Eigenvalues Extraction Sums of Squared Loadings
Component Total % of Variance Cumulative % Total % of Variance
Cumulative %
1 2.245 74.847 74.847 2.245 74.847 74,847
2 0.607 20.235 95.083
3 0.148 4.917 100
70
3.4 Factor Analysis Group 1: Female Control Group Day 2
Factor Analysis Green Products Identification Ability
Total Variance Explained
Initial Eigenvalues Extraction Sums of Squared Loadings Component Total % of Variance Cumulative % Total % of Variance Cumulative %
1 3.616 90.39 90.39 3.616 90.39 90.39
2 0.176 4.405 94.795
3 0.119 2.984 97.779
4 0.089 2.221 100
Extraction Method: Principal Component Analysis.
KMO and Bartlett's Test
Kaiser-Meyer-Olkin Measure of Sampling Adequacy. 0.614
Bartlett's Test of Sphericity Approx. Chi-Square 144.088
df 6
Sig. 0
Reliability Statistics
Cronbach's Alpha N of Items
71
Factor Analysis Health Risk Assessment
Total Variance Explained
Initial Eigenvalues Extraction Sums of Squared Loadings Component Total % of Variance Cumulative % Total % of Variance Cumulative %
1 2.13 71.002 71.002 2.13 71.002 71.002
2 0.516 17.203 88.205
3 0.354 11.795 100
Extraction Method: Principal Component Analysis.
KMO and Bartlett's Test
Kaiser-Meyer-Olkin Measure of Sampling Adequacy. 0.689 Bartlett's Test of Sphericity Approx. Chi-Square 27.539
df 3
Sig. 0
Reliability Statistics
Cronbach's Alpha N of Items
72
Factor Analysis Attitude towards Consuming the Food
Total Variance Explained
Initial Eigenvalues Extraction Sums of Squared Loadings Component Total % of Variance Cumulative % Total % of Variance Cumulative %
1 3.827 95.677 95.677 3.827 95.677 95.677
2 0.117 2.915 98.591
3 0.042 1.061 99.652
4 0.014 0.348 100
Extraction Method: Principal Component Analysis.
KMO and Bartlett's Test
Kaiser-Meyer-Olkin Measure of Sampling Adequacy. 0.828 Bartlett's Test of Sphericity Approx. Chi-Square 237.654
df 6
Sig. 0
Reliability Statistics
Cronbach's Alpha N of Items
73
Factor Analysis Health Benefits of the Product
Total Variance Explained
Initial Eigenvalues Extraction Sums of Squared Loadings Component Total % of Variance Cumulative % Total % of Variance Cumulative %
1 2.144 71.454 71.454 2.144 71.454 71.454
2 0.582 19.413 90.867
3 0.274 9.133 100
Extraction Method: Principal Component Analysis.
KMO and Bartlett's Test
Kaiser-Meyer-Olkin Measure of Sampling Adequacy. 0.634
Bartlett's Test of Sphericity Approx. Chi-Square 31.29
df 3
Sig. 0
Reliability Statistics
Cronbach's Alpha N of Items
74
Factor Analysis Edibility of the Product
Total Variance Explained
Initial Eigenvalues Extraction Sums of Squared Loadings Component Total % of Variance Cumulative % Total % of Variance Cumulative %
1 2.673 89.092 89.092 2.673 89.092 89.092
2 0.213 7.11 96.202
3 0.114 3.798 100
Extraction Method: Principal Component Analysis.
KMO and Bartlett's Test
Kaiser-Meyer-Olkin Measure of Sampling Adequacy. 0.746 Bartlett's Test of Sphericity Approx. Chi-Square 79.742
df 3
Sig. 0
Reliability Statistics
Cronbach's Alpha N of Items
75
Factor Analysis Health Benefits of the Product (after watching video)
Total Variance Explained
Initial Eigenvalues Extraction Sums of Squared Loadings Component Total % of Variance Cumulative % Total % of Variance Cumulative %
1 2.111 70.376 70.376 2.111 70.376 70.376
2 0.684 22.794 93.171
3 0.205 6.829 100
Extraction Method: Principal Component Analysis.
KMO and Bartlett's Test
Kaiser-Meyer-Olkin Measure of Sampling Adequacy. 0.616 Bartlett's Test of Sphericity Approx. Chi-Square 35.527
df 3
Sig. 0
Reliability Statistics
Cronbach's Alpha N of Items
76
Factor Analysis Health Risk Assessment (after watching video)
Total Variance Explained
Initial Eigenvalues Extraction Sums of Squared Loadings Component Total % of Variance Cumulative % Total % of Variance Cumulative %
1 2.217 73.888 73.888 2,217 73.888 73.888
2 0.597 19.902 93.79
3 0.186 6.21 100
Extraction Method: Principal Component Analysis.
KMO and Bartlett's Test
Kaiser-Meyer-Olkin Measure of Sampling Adequacy. 0.634 Bartlett's Test of Sphericity Approx. Chi-Square 40.838
df 3
Sig. 0
Reliability Statistics
Cronbach's Alpha N of Items
77
Factor Analysis Edibility Product (after watching video)
Total Variance Explained
Initial Eigenvalues Extraction Sums of Squared Loadings Component Total % of Variance Cumulative % Total % of Variance Cumulative %
1 2.442 81.395 81.395 2.442 81.395 81.395
2 0.423 14.1 95.495
3 0.135 4.505 100
Extraction Method: Principal Component Analysis.
KMO and Bartlett's Test
Kaiser-Meyer-Olkin Measure of Sampling Adequacy. 0.672 Bartlett's Test of Sphericity Approx. Chi-Square 57.429
df 3
Sig. 0
Reliability Statistics
Cronbach's Alpha N of Items
78
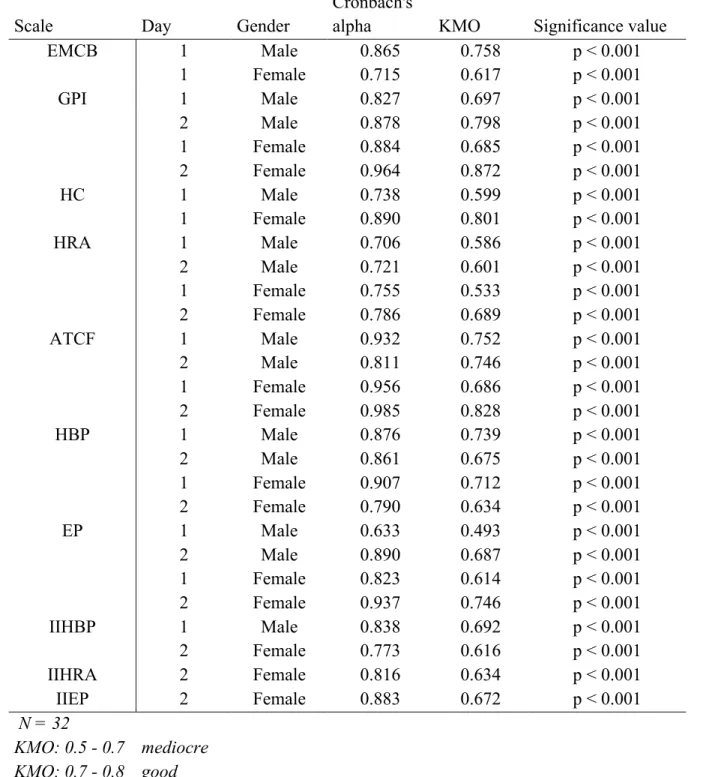
Overview reliability and validity Group 1
Scale Day Gender
Cronbach's
alpha KMO Significance value
EMCB 1 Male 0.865 0.758 p < 0.001
1 Female 0.715 0.617 p < 0.001
GPI 1 Male 0.827 0.697 p < 0.001
2 Male 0.878 0.798 p < 0.001
1 Female 0.884 0.685 p < 0.001
2 Female 0.964 0.872 p < 0.001
HC 1 Male 0.738 0.599 p < 0.001
1 Female 0.890 0.801 p < 0.001
HRA 1 Male 0.706 0.586 p < 0.001
2 Male 0.721 0.601 p < 0.001
1 Female 0.755 0.533 p < 0.001
2 Female 0.786 0.689 p < 0.001
ATCF 1 Male 0.932 0.752 p < 0.001
2 Male 0.811 0.746 p < 0.001
1 Female 0.956 0.686 p < 0.001
2 Female 0.985 0.828 p < 0.001
HBP 1 Male 0.876 0.739 p < 0.001
2 Male 0.861 0.675 p < 0.001
1 Female 0.907 0.712 p < 0.001
2 Female 0.790 0.634 p < 0.001
EP 1 Male 0.633 0.493 p < 0.001
2 Male 0.890 0.687 p < 0.001
1 Female 0.823 0.614 p < 0.001
2 Female 0.937 0.746 p < 0.001
IIHBP 1 Male 0.838 0.692 p < 0.001
2 Female 0.773 0.616 p < 0.001
IIHRA 2 Female 0.816 0.634 p < 0.001
IIEP 2 Female 0.883 0.672 p < 0.001
N = 32
KMO: 0.5 - 0.7 mediocre
KMO: 0.7 - 0.8 good
KMO: 0.8 - 0.9 great
Sig. Value < 0.05
79
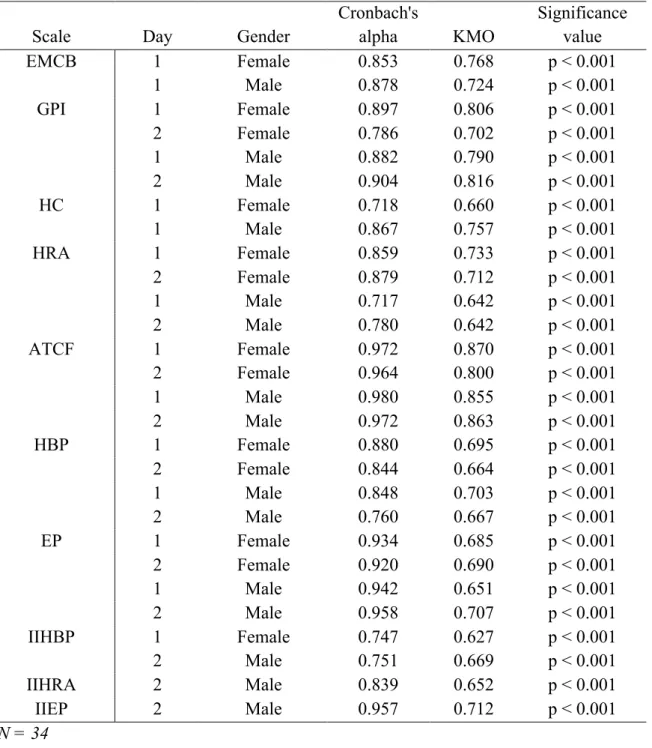
3.5 Factor Analysis Group 2: Female Experiment Group Day 1
Factor Analysis Ethical Minded Consumer Behaviour
Total Variance Explained
Initial Eigenvalues Extraction Sums of Squared Loadings
Component Total % of Variance Cumulative % Total % of Variance Cumulative %
1 4.439 44.394 44.394 4.439 44.394 44.394
2 1.395 13.951 58.345 1.395 13.951 58.345
3 1.117 11.17 69.514 1.117 11.17 69.514
4 0.843 8.426 77.94
5 0.574 5.735 83.675
6 0.503 5.027 88.702
7 0.407 4.068 92.771
8 0.37 3.699 96.47
9 0.202 2.022 98.492
10 0.151 1.508 100
Extraction Method: Principal Component Analysis.
a When components are correlated, sums of squared loadings cannot be added to obtain a total variance.
KMO and Bartlett's Test
Kaiser-Meyer-Olkin Measure of Sampling Adequacy. 0.768 Bartlett's Test of Sphericity Approx. Chi-Square 140.275
df 45
Sig. 0
Reliability Statistics
Cronbach's Alpha N of Items
80
Factor Analysis Green Products Identification Ability
Total Variance Explained
Initial Eigenvalues Extraction Sums of Squared Loadings Component Total % of Variance Cumulative % Total % of Variance Cumulative %
1 3.159 78.981 78.981 3.159 78.981 78.981
2 0.475 11.865 90.846
3 0.259 6.477 97.323
4 0.107 2.677 100
Extraction Method: Principal Component Analysis.
KMO and Bartlett's Test
Kaiser-Meyer-Olkin Measure of Sampling Adequacy. 0.806 Bartlett's Test of Sphericity Approx. Chi-Square 98.047
df 6
Sig. 0
Reliability Statistics
Cronbach's Alpha N of Items
81
Factor Analysis Health Consciousness
Total Variance Explained
Initial Eigenvalues Extraction Sums of Squared Loadings Component Total % of Variance Cumulative % Total % of Variance Cumulative %
1 2.949 42.135 42.135 2.949 42.135 42.135
2 1.206 17.234 59.368 1.206 17.234 59.368
3 1.05 14.999 74.367 1.05 14.999 74.367
4 0.911 13.008 87.375
5 0.362 5.178 92.553
6 0.318 4.541 97.094
7 0.203 2.906 100
Extraction Method: Principal Component Analysis.
a When components are correlated, sums of squared loadings cannot be added to obtain a total variance.
KMO and Bartlett's Test
Kaiser-Meyer-Olkin Measure of Sampling Adequacy. 0.66 Bartlett's Test of Sphericity Approx. Chi-Square 75.454
df 21
Sig. 0
Reliability Statistics
Cronbach's Alpha N of Items
82
Factor Analysis Health Risk Assesment
Total Variance Explained
Initial Eigenvalues
Extraction Sums of Squared Loadings
Component Total % of Variance
Cumulative
% Total
% of Variance
Cumulative %
1 2.352 78.408 78.408 2.352 78.408 78.408
2 0.359 11.982 90.389
3 0.288 9.611 100
Extraction Method: Principal Component Analysis.
KMO and Bartlett's Test
Kaiser-Meyer-Olkin Measure of Sampling Adequacy. 0.733 Bartlett's Test of
Sphericity Approx. Chi-Square 43.992
df 3
Sig. 0
Reliability Statistics
Cronbach's Alpha N of Items
83
Factor Analysis Attitude Towards Consuming the Food
Total Variance Explained
Initial Eigenvalues Extraction Sums of Squared Loadings Component Total % of Variance Cumulative % Total % of Variance Cumulative %
1 3.695 92.369 92.369 3,695 92.369 92.369
2 0.14 3.507 95.876
3 0.103 2.565 98.441
4 0.062 1.559 100
Extraction Method: Principal Component Analysis.
KMO and Bartlett's Test
Kaiser-Meyer-Olkin Measure of Sampling Adequacy. 0.87 Bartlett's Test of Sphericity Approx. Chi-Square 176.03
df 6
Sig. 0
Reliability Statistics
Cronbach's Alpha N of Items