*e-mail: [email protected]
1. Introduction
Recently, nanobelts have attracted great interests due to their peculiar physical and chemical properties and potential technological applications1-5. Various methods have
been explored to synthesize nanobelts, such as molecular self-assembly6, microemulsion technology7, sol-gel8 and
hydrothermal method9. Although the above methods can
synthesize nanobelts, preparation process is relatively complicated. Electrospinning, one of the most effective and convenient techniques to produce nanomaterials, has drawn much attention from scholars. To date, some inorganic and organic nanomaterials have been prepared by electrospinning technique10-15.
Yttrium Aluminum Garnet (Y3Al5O12, denoted as YAG for short) has a cubic structure with a garnet structure and is an important inorganic nonmetal material. Great efforts have been focused on the high quality YAG single crystals due to its superior physical, chemical, thermal, mechanical and optical properties. Recently, rare-earth-doped nanocrystals have been widely used as high performance luminescent devices, magnets and other functional materials. YAG has received considerable attention when doped with rare earth ions owing to their interesting properties16-21. YAG doped
with Eu3+ ions is an important phosphor with a variety
of applications in many luminescent and optical devices. The interests in the synthesis of YAG: Eu3+ phosphor are
motivated by the need to improve the luminescence eficiency of materials. Li et al.22 have prepared YAG: Eu3+ phosphor
powders by metallorganic chemical vapor deposition22. R.
Lopez et al.23 synthesized YAG: Eu3+ micrometer ibers by
the citrate precursor method23. There were no reports on the
preparation of YAG: Eu3+ nanobelts. In this study, YAG: Eu3+
nanobelts were fabricated by electrospinning processing. The effect of the Eu3+ concentration, the morphology and
luminescence characteristics of YAG: Eu3+ nanobelts were
investigated, and some meaningful results were obtained.
2. Experimental
2.1. Chemicals
Polyvinyl pyrrolidone (PVP, Mw=90 000) and N, N-dimethyl formamide (DMF) were purchased from Tianjin Tiantai Fine Chemical Reagents Co. Ltd. and HNO3 was bought from Beijing Chemical Company. Y2O3 (99.99%), Eu2O3 (99.99%) and Al(NO3)3·9H2O were bought from Sinopharm Chemical Reagents Co. Ltd. Y(NO3)3 and Eu(NO3)3 was prepared by dissolving Y2O3 and Eu2O3 in dilute nitric acid, then evaporated the water from the solution by heating. All chemicals were analytically pure and directly used as received without further puriication.
2.2. Preparation of samples
YAG: x% Eu3+ [x=1, 3, 5, 7, x stands for molar ratio of Eu3+
to (Y3++Eu3+)] were prepared by a method of electrospinning
combined with sol-gel process. In a typical procedure of preparing YAG: 5% Eu3+, 0.95 mmol Y(NO
3)3, 0.05 mmol
Eu(NO3)3 and 1.38 g Al(NO3)3·9H2O were dissolved in 13.0 g DMF and 5.0 g PVP was added. In the precursor solution, the mass ratios of rare earth nitrates, DMF and PVP were equal to 10: 70: 20. The precursor sol was stirred for 24h to form a homogeneous mixture sol for further electrospinning. Subsequently, PVP/[ Y(NO3)3+Eu(NO3)3+Al(NO3)3] composite nanobelts were prepared by electrospinning technology.
Electrospinning Preparation and Photoluminescence Properties of Y
3Al
5O
12:Eu
3+Nanobelts
Fei Bia, Xiangting Donga*, Jinxian Wanga, Guixia Liua
aKey Laboratory of Applied Chemistry and Nanotechnology at Universities of Jilin Province,
Changchun University of Science and Technology, 130022 Changchun, China
Received: November 12, 2014; Revised: February 10, 2015
Novel structures of Y3Al5O12: Eu3+ (denoted as YAG: Eu3+ for short) nanobelts were fabricated
by calcination of the electrospun PVP/[Y(NO3)3+Eu(NO3)3+Al(NO3)3] composite nanobelts. X-ray powder diffraction (XRD) analysis showed that YAG: Eu3+ nanobelts were cubic in structure with
space group Ia3d. Fourier transform infrared spectroscopy (FTIR) analysis manifested that pure YAG: Eu3+ nanobelts were formed at 900 °C. Scanning electron microscope (SEM) analysis indicated that
the YAG: Eu3+ nanobelts have coarse surface. The width and thickness of YAG: Eu3+ nanobelts were
ca. 3.25 µm and ca. 220 nm, respectively. Fluorescence spectra analysis revealed that YAG: Eu3+
nanobelts emitted the main strong emission centering at 592 nm under the ultraviolet excitation of 235 nm, which was attributed to 5D
0→ 7F
1 of Eu
3+, and the optimum doping molar concentration of
Eu3+ ions was 5%. CIE analysis demonstrated that the emitting colors of YAG: Eu3+ nanobelts could
be tuned by adjusting doping concentration of Eu3+. The possible formation mechanism of YAG: Eu3+
nanobelts was also proposed.
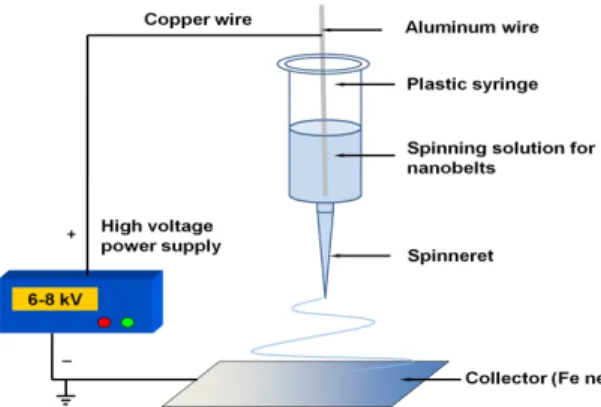
The schematic diagram of electrospinning equipment was illustrated in Figure 1. The electrospinning apparatus consisted of a high voltage power supply, a spinneret (syringe), and a collector plate (a grounded conductor). The precursor sol was loaded into the syringe. In a typical electrospinning process, the precursor sol was ejected from the tip of the spinneret under the effect of high voltage that was applied between the spinneret and the collector to form an electrically charged jet of sol. The sol jet solidiied along with evaporation of solvent and formed a non-woven mat on the collector. The distance between the spinneret (a plastic needle) and collector (Fe net) was ixed at 18-20 cm and the high voltage supply was maintained at 6-8 kV. The room temperature was 20-24 °C and the relative humidity was 60-70%. PVP/[Y(NO3)3+Eu(NO3)3+Al(NO3)3] composite nanobelts were fabricated. YAG: 5% Eu3+ nanobelts can
be obtained after the relevant composite nanobelts were calcined in air at 900 °C for 8 h with the heating rate of 1 °C·min–1. Other series of YAG: x% Eu3+ (x=1, 3, 7) were
also prepared by the similar procedure except for different ratios of rare earth salts in sol.
2.3. Characterization methods
X-ray diffraction (XRD) measurements were carried out using a Rigaku D/max-RA XRD diffractometer with Cu Kα radiation of 0.15418 nm. Fourier transform infrared spectra (FTIR) were measured with Shimadzu 8400S infrared spectrophotometer using the KBr pellet-pressing technique. The size and morphology of the products were observed by a ield emission scanning electron microscope (FESEM, XL-30, FEI Company). The excitation and emission spectra of samples were recorded with a HITACHI F-7000 Fluorescence Spectrophotometer used a Xe lamp as the excitation source. For luminescent measurements, 0.2 g of each sample was loaded into a standard circular cell (sample cell size: 11 mm in diameter, 1.5 mm in thickness) and compacted into a wafer with the thickness of ca. 1.5 mm.
3. Results and Discussion
3.1. XRD patterns
PVP/[Y(NO3)3+Eu(NO3)3+Al(NO3)3] composite nanobelts and samples doped with various concentration of Eu3+
obtained by calcining the relevant composite nanobelts were characterized by XRD, as indicated in Figure 2 and Figure 3.
The XRD patterns of the PVP/[Y(NO3)3+Eu(NO3)3+Al(NO3)3] composite nanobelts were shown in Figure 2a. There was a broad peak around 22° for the composite nanobelts, indicating that the sample was amorphous. However, when the calcination temperature was 900 °C, the obvious diffraction peaks can be observed. All the relection peaks can be readily indexed to those of the pure cubic phase with primitive structure of YAG (PDF 33-0040) with space group Ia3d, indicating that the pure phase of YAG: Eu3+ nanobelts were successfully
prepared. No other phase was detected at these doping levels, indicating that the Eu3+ ions can be eficiently built into
the YAG host lattice by replacing of the Y3+ ion. When the
doping concentration of Eu3+ was increased, the diffraction
peak intensity of YAG: Eu3+ nanobelts was increased and
reached the maximum at 5%Eu3+ (as shown in the Figure 3
and the inset of the Figure 3). The diffraction peaks of YAG: Eu3+ samples were shifted a little to lower angles compared
with the peaks position of standard YAG patterns. This was because Y3+ was smaller than Eu3+ in the YAG host lattice
Figure 1. Schematic diagram of electrospinning setup.
Figure 2. XRD patterns of the composite nanobelts and YAG: Eu3+ nanobelts doped with various concentration of Eu3+. a. PVP/
[Y(NO3)3+Eu(NO3)3+Al(NO3)3] composite nanobelts b. 1% c. 3%
d. 5% e. 7%. The standard data for cubic YAG (PDF card 33-0040) is also presented in the igure for comparison.
Figure 3. Widening patterns of part XRD results of YAG: Eu3+
nanobelts doped with various concentration of Eu3+. The inset indicated
that variation of diffraction peaks intensity of crystallographic planes (420) and (422) with doping molar concentration of Eu3+
(radius (Y3+)=1.02 nm, radius (Eu3+)=1.07 nm). However,
the shift was very small due to the low doping concentration of Eu3+.
3.2. FTIR spectra analysis
PVP/[Y(NO3)3+Eu(NO3)3+Al(NO3)3] composite nanobelts and YAG: 5% Eu3+ nanobelts were investigated by FTIR, as
shown in Figure 4. All the absorption peaks were attributed to PVP at 3446 cm–1, 2964 cm–1, 1635 cm–1, 1429 cm–1 and
1280 cm–1 (as shown in Figure 4a), corresponded to the
stretching vibrations of hydroxyl group, C-H bond, carbonyl group, C-H bond and C-N bond or C-O bond, respectively. And all the absorption peaks weakened or disappeared and new absorption peaks appeared at low wavenumbers in the spectrum of YAG: 5% Eu3+ nanobelts (as shown
in Figure 4b). The band near 3446 cm–1 was due to the
stretching vibration of H2O. The band about 1615 cm-1 was
a result from the bending vibration of H2O. The new peaks at 785 cm–1, 718 cm–1 and 457 cm–1 were associated with the
metal-oxygen bonds (Al-O and Y-O) vibrations. The peaks at about 785 cm–1 in Figure 4b represented the characteristic
Al-O bond vibration, while the peaks at about 718 cm–1 and
457 cm–1 were the characteristic Y-O bond vibration. These
characteristic metal-oxygen vibration absorption indicated formation of YAG structure24. FTIR analysis manifested that
YAG: Eu3+ nanobelts were formed at 900 °C. The results
were in good agreement with XRD patterns.
3.3. SEM analysis
As seen from Figure 5a and Figure 5b, the surface of PVP/[Y(NO3)3+Eu(NO3)3+Al(NO3)3] composite nanobelts were smooth. Image-Pro Plus 6.0 software was used to measure width and thickness of 100 nanobelts from SEM images, and the results were analyzed with statistics, and then the histograms of width and thickness distribution of the nanobelts were drawn by using Origin 8.5 software. Figure 6a and Figure 6b showed the width and thickness distribution histogram of PVP/[Y(NO3)3+Eu(NO3)3+Al(NO3)3] composite nanobelts. The width and thickness of nanobelts were located at 6-16 μm and 280-340 nm, respectively, and the average width and thickness of composite nanobelts were ca. 12 µm and ca. 310 nm, respectively. Figure 5c and Figure 5d showed the SEM images of YAG: 5% Eu3+
nanobelts calcined at 900 °C. YAG: 5% Eu3+ nanobelts had
coarse surface and the nanobelts were composed of linked nanorods. The width and thickness of the YAG: 5% Eu3+
nanobelts were located at 1.75-5.75 μm and 170-320 nm, respectively, and the average width and thickness were ca. 3.25 µm and ca. 220 nm (as shown in Figure 6c and Figure 6d), respectively. After being calcined at 900 °C, the width and thickness of nanobelts greatly decreased due to the decomposition of the organic species and the formation of inorganic phase.
3.4. Photoluminescence properties
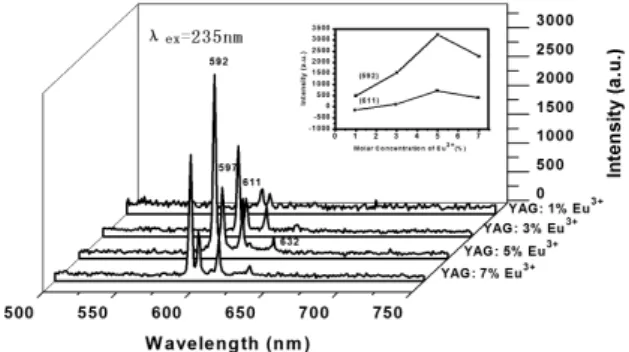
Figure 7 showed the excitation spectra of YAG: x%Eu3+
[x=1, 3, 5, 7] nanobelts monitored at 592 nm. The prominent peak at 235 nm was associated with the charge transfer band (CRT) of O2--Eu3+. In the longer wavelength region
(at 395 nm), the f-f transition peak of Eu3+ ions could be
observed with very weak intensity compared with those of the CTB. The strongest intensity of excitation spectrum (CTB) was obtained when the doping concentration of Eu3+
ion was 5%, as shown in the inset of the Figure 7. Figure 8 demonstrated the emission spectra of the YAG: Eu3+ nanobelts with different doping concentrations of
Eu3+. Obviously, the luminescence intensity of YAG: Eu3+
Figure 4. FTIR spectra of composite nanobelts (a) and YAG: 5% Eu3+ nanobelts (b).
Figure 5. SEM images of composite nanobelts (a and b) and YAG: 5% Eu3+ nanobelts (c and d).
nanobelts increased with the increase of the concentration of Eu3+ from the beginning, reached a maximum value
with the Eu3+ concentration of 5%, and then decreased with
further increase in Eu3+ concentration, as shown in Figure 8
and the inset of the Figure 8. At this time, the bond length between Eu3+ and O2– became shorter and the mixture of
wave function of Eu3+ and O2– was enhanced, therefore, the
strongest luminescence was at 5%. The emission spectrum was associated with the transitions from the excited level of
5D
J (J=0, 1) to the level of 7F
J (J=1, 2) of Eu
3+. The strongest
red emission which split into two peaks at 592 nm and 597 nm were ascribed to transition from 5D
0→ 7F
1 level of
Eu3+, which was mainly a magnetic-dipole transition. The
peak at 611 nm was ascribed to transition from 5D 0→
7F 2
level of Eu3+, which was an electric-dipole transition. The
other emission peak at 623 nm was attributed to the electron transition from 5D
0→ 7F
2 level of Eu 3+.
The relationship between I1 (592 nm)/I2 (611 nm) intensity ratio values and various doping molar concentration of Eu3+
for YAG: Eu3+ nanobelts were shown in Table 1. In cubic
YAG phase, Y3+ was co-ordinated by eight oxygen ions
with D2 point symmetry. The doped Eu3+ was substituted
for Y3+ and also has a D
2 point symmetry. However, the
exact local symmetry was only a small distortion of the centro-symmetric D2h point symmetry. It was established that
5D 0→
7F
2 transition of Eu
3+ ions, which was hypersensitive
to the symmetry of coordinated environment, was usually forbidden in a crystalline environment with inversion symmetry. From the PL spectrum in Figure 7, Figure 8 and Table 1, it was observed that the magnetic-dipole 5D
0→ 7F
1
(592 nm) transition was stronger than that of the electric-dipole 5D
0→ 7F
2 (611 nm) transition, suggesting that the
position of Eu3+ have inversion symmetry.
3.5. CIE analysis
Generally, color can be represented by the Commission Internationale de L’Eclairage (CIE) 1931 chromaticity coordinates. The chromaticity coordinates of YAG: x%Eu3+
[x=1, 3, 5, 7] nanobelts were indicated in Figure 9. The coordinates (X, Y) of YAG: Eu3+ nanobelts excited by
235 nm were (0.4394, 0.5306), (0.5137, 0.4703), (0.5300, 0.4556) and (0.5536, 0.4369), which correspond to the Eu3+
concentrations of 1%, 3%, 5% and 7%, respectively, as revealed in Figure 9. According to the above results, it can be found that the emission colors of YAG: Eu3+ nanobelts
can be tuned by adjusting the concentrations of Eu3+ ions,
which were considered to be promising candidates for application in LEDs.
3.6. Possible formation mechanism of YAG:
Eu3+ nanobelts
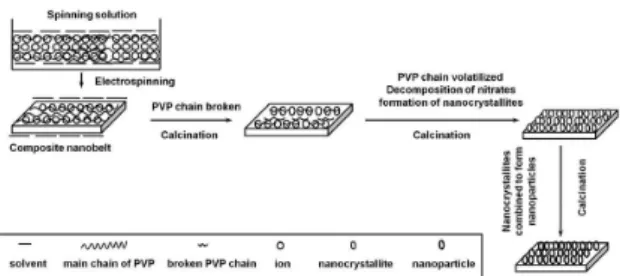
Possible formation mechanism of YAG: Eu3+ nanobelts
was schematically shown in Figure 10. Y3+, Eu3+, Al3+, NO 3
–,
PVP and DMF were mixed into sol with certain viscosity,
Figure 7. Excitation spectra of YAG: Eu3+ nanobelts doped with
various concentration of Eu3+. The inset indicated that variation of
excitation peak intensity at 235 nm with doping molar concentration of Eu3+ for YAG: Eu3+ nanobelts.
Figure 8. Emission spectra of YAG: Eu3+ nanobelts doped with
various concentration of Eu3+. The inset indicated that variation of
emission peak intensity at 592 nm (a) and 611 nm (b) with doping molar concentration of Eu3+ for YAG: Eu3+ nanobelts.
Table 1. Relationship between I1(592 nm)/I2(611 nm) intensity ratio value and various doping molar concentration of Eu
3+ for YAG:
Eu3+ nanobelts.
various doping molar concentration of Eu3+ 1% 3% 5% 7%
I1(592 nm, 5D
0→ 7F
1)/I2(611 nm, 5D
0→ 7F
2) 1.85 3.10 3.14 3.00
Figure 9. CIE chromaticity coordinates diagram of YAG: Eu3+
and fabricated PVP/[Y(NO3)3+Eu(NO3)3+Al(NO3)3] composite nanobelts via electrospinning. PVP acted as template during the formation processing of YAG: Eu3+
nanobelts. Y3+, Eu3+, Al3+, NO 3
– and DMF were mixed
with or absorbed onto PVP molecules to fabricate PVP/ [Y(NO3)3+Eu(NO3)3+Al(NO3)3] composite nanobelts under electrospinning. During calcination treatment of the composite nanobelts, solvent containing Y3+, Eu3+, Al3+, NO
3
- and DMF
in the composite nanobelts would remove to the surface of the PVP/[Y(NO3)3+Eu(NO3)3+Al(NO3)3] composite nanobelts and eventually evaporated from the composite nanobelts. With the increasing in calcination temperature, Y3+, Eu3+,
Al3+, NO 3
- and DMF would oxidize and volatilize rapidly,
Y3+, Eu3+ and Al3+ were oxidized into YAG: Eu3+ crystallites,
and many crystallites were combined into small YAG: Eu3+
nanoparticles, then some small nanoparticles were sintered into big nanoparticles, and these nanoparticles were mutually connected to generate YAG: Eu3+ nanobelts. It was found
from experiments that the average molecular weight of PVP and PVP content in the starting mixed sol had important impact on the formation of YAG: Eu3+ nanobelts.
4. Conclusions
YAG: Eu3+ nanobelts have been successfully synthesized
by electrospinning technique combined sol-gel process. The composite nanobelts were smooth, and the width and thickness of the PVP/[Y(NO3)3+Eu(NO3)3+Al(NO3)3] composite nanobelts were ca. 12µm and ca. 310nm, respectively. YAG: Eu3+ nanobelts were cubic in structure with space group I
a3d,
the width and thickness of YAG: Eu3+ nanobelts were ca.
3.25 µm and ca. 220 nm, respectively. YAG: Eu3+ nanobelts
have coarse surface. The luminescence analysis revealed that YAG: Eu3+ nanobelts emitted the main emission peak at 592
nm, which was attributed to the transition of 5D 0→
7F 1 of Eu
3+.
The strongest luminescence intensity of YAG: Eu3+ nanobelts
were obtained when the molar concentration of Eu3+ was
5%. Color-tuned luminescence of YAG: Eu3+ nanobelts could
be obtained by changing the doping concentration of Eu3+.
Acknowledgements
This work was inancially supported by the National Natural Science Foundation of China (NSFC 50972020, 51072026), Specialized Research Fund for the Doctoral Program of Higher Education (20102216110002, 20112216120003), the Science and Technology Development Planning Project of Jilin Province (Grant Nos. 20130101001JC, 20070402), the Science and Technology Research Project of the Education Department of Jilin Province during the eleventh ive-year plan period (Under grant No. 2010JYT01), Key Research Project of Science and Technology of Ministry of Education of China (Grant No. 207026).
Figure 10. Formation mechanism of YAG: Eu3+ nanobelts.
References
1. Yousefi R and Kamaluddin B. Effect of S- and Sn-doping to the optical properties of ZnO nanobelts. Applied Surface Science. 2009; 255(23):9376-9380. http://dx.doi.org/10.1016/j. apsusc.2009.07.039.
2. Ma WW, Dong XT, Wang JX, Yu WS and Liu GX. Electrospinning preparation of LaOBr:Tb3+ nanostructures and their photoluminescence properties. Journal of Materials Science. 2013; 48(6):2557-2565. http://dx.doi.org/10.1007/ s10853-012-7046-2.
3. Yang LY, Wang JX, Dong XT, Liu GX and Yu WS. Synthesis of Y2O2S:Eu3+ luminescent nanobelts via electrospinning combined with sulfurization technique. Journal of Materials Science. 2013; 48(2):644-650. http://dx.doi.org/10.1007/ s10853-012-6768-5.
4. Ma Q, Yu W, Dong X, Wang J and Liu G. Janus nanobelts: fabrication, structure and enhanced magnetic-fluorescent bifunctional performance. Nanoscale. 2014; 6(5):2945-2952. http://dx.doi.org/10.1039/c3nr05472a. PMid:24480832
5. Shen GZ and Chen D. Fast-heating-vapor-trapping method to aligned indium oxide bi-crystalline nanobelts arrays and their electronic properties. Journal of Materials Chemistry. 2010; 20(48):10888-10893. http://dx.doi.org/10.1039/c0jm02189j.
6. Zhao X, Pan F, Xu H, Yaseen M, Shan H, Hauser CAE, et al. Molecular self-assembly and applications of designer peptide
amphiphiles. Chemical Society Reviews. 2010;
39(9):3480-3498. http://dx.doi.org/10.1039/b915923c. PMid:20498896
7. Chen Y, Somsen C, Milenkovic S and Hassel AW. Fabrication of single crystalline gold nanobelts. Journal of Materials Chemistry. 2009; 19(7):924-927. http://dx.doi.org/10.1039/ B816897K.
8. Wu LL, Liang Y, Liu FW, Lu HQ, Xu HY, Zhang XT, et al. Preparation of ZnO/In2O3(ZnO)n heterostructure nanobelts. CrystEngComm. 2010; 12(12):4152-4155. http://dx.doi. org/10.1039/c0ce00035c.
9. Yan D, Yan PX, Yue GH, Liu JZ, Chang JB, Yang Q, et al. Self-assembled flower-like hierarchical spheres and nanobelts of manganese oxide by hydrothermal method and morphology control of themOriginal Research Article. Chemical Physics Letters. 2007; 440(1-3):134-138. http://dx.doi.org/10.1016/j. cplett.2007.04.027.
10. Ma QL, Wang JX, Dong XT, Yu WS and Liu GX. Fabrication of Magnetic-Fluorescent Bifunctional Flexible Coaxial Nanobelts by Electrospinning Using a Modified Coaxial Spinneret. ChemPlusChem. 2014; 79(2):290-297. http://dx.doi.org/10.1002/ cplu.201300262.
11. Zhang ZY, Shao CL, Sun YY, Mu JB, Zhang MY, Zhang P, et al. Tubular nanocomposite catalysts based on size-controlled and highly dispersed silver nanoparticles assembled on electrospun silica nanotubesfor catalytic reduction of 4-nitrophenol. Journal of Materials Chemistry. 2012; 22(4):1387-1395. http:// dx.doi.org/10.1039/C1JM13421C.
magnetic-photoluminescent bifunctional coaxial nanofibers. Journal of Materials Chemistry. 2012; 22(29):14438-14442. http://dx.doi. org/10.1039/c2jm32043f.
13. Lv N, Ma QL, Dong XT, Wang JX, Yu WS and Liu GX. Parallel Spinnerets Electrospinning Fabrication of Novel Flexible Luminescent-electrical-magnetic Trifunctional Bistrand-aligned nanobundles. Chemical Engineering Journal. 2014; 243:500-508. http://dx.doi.org/10.1016/j.cej.2014.01.022.
14. Ma QL, Wang JX, Dong XT, Yu WS and Liu GX. Electrospinning fabrication of high-performance magnetic@photoluminescent bifunctional coaxial nanocables. Chemical Engineering Journal. 2013; 222:16-22. http://dx.doi.org/10.1016/j.cej.2013.02.063.
15. Zou P, Hong X, Ding YD, Zhang ZY, Chu XY, Shaymurat T, et al. Up-Conversion Luminescence of NaYF4:Yb3+/Er3+ Nanoparticles Embedded into PVP Nanotubes with Controllable
Diameters. The Journal of Physical Chemistry C. 2012;
116(9):5787-5791. http://dx.doi.org/10.1021/jp2114863. 16. Zhou J, Zhang WX, Wang L, Shen YQ, Li J, Liu WB, et al.
Fabrication, microstructure and optical properties of polycrystalline Er:Y3Al5O12 ceramics. Ceramics International. 2011; 37(1):119-125. http://dx.doi.org/10.1016/j.ceramint.2010.08.025. 17. Liu WB, Jiang BX, Zhang WX, Li J, Zhou J, Zhang D, et al.
Influence of heating rate on optical properties of Nd:YAG laser ceramic. Ceramics International. 2010; 36(7):2197-2201. http:// dx.doi.org/10.1016/j.ceramint.2010.05.017.
18. Lv YH, Zhang W, Liu H, Sang YH, Qin HM, Tan J, et al. Synthesis of nano-sized and highly sinterable Nd:YAG powders by the urea homogeneous precipitation method. Powder Technology. 2012; 217:140-147. http://dx.doi.org/10.1016/j. powtec.2011.10.020.
19. Revaux A, Dantelle G, George N, Seshadri R, Gacoin T and Boilot JP. A protected annealing strategy to enhanced light emission and photostability of YAG:Ce nanoparticle-based films. Nanoscale. 2011; 3(5):2015-2022. http://dx.doi.org/10.1039/ c0nr01000f. PMid:21384045
20. Murai S, Fujita K, Iwata K and Tanaka K. Scattering-Based Hole Burning in Y3Al5O12:Ce3+ Monoliths with Hierarchical Porous Structures Prepared via the Sol-Gel Route. The Journal of Physical Chemistry C. 2011; 115(36):17676-17681. http:// dx.doi.org/10.1021/jp204594c.
21. Pereira PFS, Matos MG, Avila LR, Nassor ECO, Cestari A, Ciuffi KJ, et al. Red, green and blue (RGB) emission doped Y3Al5O12 (YAG) phosphors prepared by non-hydrolytic sol-gel route. Journal of Luminescence. 2010; 130(3):488-493. http:// dx.doi.org/10.1016/j.jlumin.2009.10.019.
22. Li YH, Zhang JH, Xiao QQ and Zeng RJ. Synthesis of ultrafine spherical YAG:Eu3+ phosphors by MOCVD. Materials Letters. 2008; 62(23):3787-3789. http://dx.doi.org/10.1016/j. matlet.2008.03.061.
23. Lopez R, Aguilar EA, Zarate-Medina J, Muñoz-Saldaña J and Lozano-Mandujano D. Nanoindentation of melt-extracted amorphous YAG and YAG:Eu, Nd micrometric fibers synthesized by the citrate precursor method. Journal of the European Ceramic Society. 2010; 30(1):73-79. http://dx.doi. org/10.1016/j.jeurceramsoc.2009.07.028.
![Figure 6a and Figure 6b showed the width and thickness distribution histogram of PVP/[Y(NO 3 ) 3 +Eu(NO 3 ) 3 +Al(NO 3 ) 3 ] composite nanobelts](https://thumb-eu.123doks.com/thumbv2/123dok_br/18882260.422931/3.765.66.377.525.773/figure-figure-showed-thickness-distribution-histogram-composite-nanobelts.webp)