ABSTRACT The article analyzes the public expenditures on the Unified Health System in mu-nicipalities, regions and macro-regions of Bahia, from 2009 to 2012. Data were analyzed with the aid of National Health Accounts model. It was verified an increase of 28% in the expenses declared by the municipalities, in the quadrennium. The expenditures were concentrated in the macro-regions with the highest installed capacity. However, compared to the population of these localities, inputs proved to be still insufficient. Half of the health regions did not reach the average per capita spending of the state. The distribution of resources fairly and effectively requires knowledge of the health needs of the population, monitoring and rational use.
KEYWORDS Health expenditures. Healthcare financing. Unified Health System.
RESUMO O artigo analisa os gastos públicos com o Sistema Único de Saúde em municípios, regi-ões e macrorregiregi-ões da Bahia, de 2009 a 2012. Os dados foram analisados com o auxílio do mo-delo de Contas Nacionais de Saúde. Verificou-se um crescimento de 28% nos gastos declarados pelos municípios, no quadriênio. Os gastos concentraram-se nas macrorregiões de maior capaci-dade instalada. Todavia, frente às populações dessas localicapaci-dades, os aportes mostraram-se ainda insuficientes. Metade das regiões de saúde não atingiu a média de gasto per capita do estado. A distribuição dos recursos de forma justa e eficaz exige conhecimento das necessidades de saúde da população, fiscalização e uso racional.
PALAVRAS-CHAVE Gastos em saúde. Financiamento da assistência à saúde. Sistema Único de Saúde.
Public Expenditure on Health in Bahia:
exploring evidence of inequalities
Gasto Público em Saúde na Bahia: explorando indícios de
desigualdades
Andrei Souza Teles1, Thereza Christina Bahia Coelho2, Milla Pauline da Silva Ferreira3
1 Universidade Estadual
de Feira de Santana (UEFS), Programa de Pós-Graduação em Saúde Coletiva (PPGSC) – Feira de Santana (BA), Brasil. [email protected]
2 Universidade Estadual
de Feira de Santana (UEFS), Programa de Pós-Graduação em Saúde Coletiva (PPGSC) – Feira de Santana (BA), Brasil. [email protected]
3 Universidade Estadual
Introduction
The Federal Constitution of 1988, in the act of transitional provisions, defined that 30% of Social Security resources, coming from the budgets of the Union, states, Federal District and municipalities, should be applied to health. There was, however, no definition of what would be the participa-tion of the spheres of government in the fi-nancing of Social Security nor the definition of specific sources, resulting in irregularities of financial contributions, which caused the minimization of resources destined to the Unified Health System (SUS) since its birth
(MENDES; MARQUES, 2009).
After almost 30 years, financing remains an important limitation of the brazilian health system, since the need to expand and improve quality and care capacity is related to the levels of investments in the health area, in the public network. They are indi-cated as consequences of underfinancing: disinvestment in buildings, equipment and technologies; the limitation of personnel and the precariousness of work links in health; the expansion of the participation of private services, contracted or under convention, in the scope of the SUS; in addition to the dis-tancing of the system from the standard of universal health models (SANTOS, 2013).
According to data from the World Health Organization (WHO), the total health spend-ing (public and private) in Brazil, in 2010 was 9,0% of Gross Domestic Product (GDP), which corresponds to a low percentage when compared to the United States (17,6%) and, also, although to a lesser extent, to other countries members of the Organization for Economic Cooperation and Development (OECD), such as Canada (11,4%), Denmark (11,1%) and Spain (9,6%), which use uni-versal health systems. In these countries, public expenditure has been higher than the private total health financing, gener-ally, above 65%. In Brazil, private spending reached 53% of the total, a percentage like
that of the United States, although, much lower than in countries like Argentina and Uruguay, where, respectively, 64,4% and 65,3% of health expenditures were financed with public resources (WHO, 2013; MARQUES; PIOLA, 2014). In 2013, total health spending in Brazil
rose to 9,7% of GDP, but, on the other hand, Public Expenditure on Health increased from 10,7% of total government spending (federal, state and municipal), in 2010, to 6,9%, in 2013 (WHO, 2015).
Although the legal and institutional framework of the SUS is well-founded, it is not capable of, by itself, promoting access to health, since laws and regulations are not enough, it is necessary that funding for a universal system is adequate and adjusted to the demands, needs and health rights of the population. Fostering the clashes about the necessary resources to finance SUS, the Complementary Law nº 141, of 2012, was approved, which regulated Constitutional Amendment nº 29 (EC 29/2000) (BRASIL, 2012) and ratified the obligation of the states
and municipalities to allocate, respectively, 12% and 15% of their revenues to the health sector. For the Union, the standard already adopted in the application of the value of the previous year plus nominal GDP varia-tion remained, frustrating once again the expectations regarding the expansion of the participation of the federal scope in the fi-nancing of health. The CL 141, in fact, pre-pared the legal ground for the reduction of the health budget. As of 2010, which was the highest spending year of all time, there was a reduction to 9,3%, in 2011, 7,9%, in 2012, and 6,9%, in 2013 (WHO, 2015).
2016 and 2020, from 13,2% to 15%, which does not mean to say, necessarily, a ‘progres-sive increase in resources’, since CA 86/2015 created a tax budget that benefits the par-liamentary amendments, and can generate still greater constraints to the social security budget (COELHO; TELES; FERREIRA, 2016).
The process of decentralization of man-agement to states and municipalities rep-resented a major advance for public health policies, which combined the financing of the three spheres of government for the im-plementation of actions and services of the SUS. Considering the fact that the relative participation of the Union in health spending has gradually declined since the enactment of CA 29, in 2000, unlike that of states and municipalities, it is acknowledged that this measure has encouraged the expansion of health services, even though equity has been undervalued, since reducing inequalities re-quires the increase of the participation of Union funding in health spending, especially in the poorer regions of the federation (BRASIL, 2011; PIOLA; FRANCE; NUNES, 2016).
By means of the evolution of the forms of financing outlined by the Ministry of Health, states and municipalities obtained regular and automatic access to the resources of the Union, in accordance with the manage-ment conditions established by the Basic Operational Norms of SUS. The Health Care Operational Standards, of 2001 and 2002, and, subsequently, the Health Pact, of 2006, sought to increase the participation of the states in the management of the SUS, con-substantiating the proposal of regionaliza-tion of service networks to increase access of the population. More recently, the Decree nº 7.508, of June 2011, emphasized the constitu-tion of health regions to reduce socio-spatial inequalities in the universalization of health and to overcome the limits of municipal decentralization of health (BRASIL, 2011). The
regionalized networks refer to integrated structures, with different levels of health
care, circumscribed in a certain regional space that aim to enable the completion of the integrality of actions and services, as well as the optimization of resources. However, underfunding has been cited as an obstacle to conformation of these networks (SILVA, 2011).
At the XV National Health Conference, held in december 2015, underfunding of health was the theme that unified all the speeches, since it made it impossible, in fact, to strengthen public SUS and quality. Health financing, defined by Coelho and Scatena
(2014, P. 285, FREE TRANSLATION) as a “structural and
structuring element that economically sup-ports social practices that care for human life”, has been a matter of concern world-wide, since health services are, usually, ex-pensive, requiring efficiency in spending planning and a distribution that is not only egalitarian, but also equitable in resource al-location (BRASIL, 2006). Ensuring universal and
integral access to health services for more than 206 million people is, certainly, a major challenge, especially in view of the steady increase in spending, due to the growing demand for more and better services, the aging of the population and the increasingly sophisticated technologies.
Methods
The study covered all 417 municipalities in Bahia, the largest state in the Northeast region and the fourth most populous in the Country (BAHIA, 2012). These municipalities
are located, according to the last update of the Master Plan of Regionalization (PDR) of the state (BRASIL, 2013), in 28 health regions
and nine macro-regions (North, West, Central-North, Central-East, Northeast, East, Southwest, South and Extreme South). The PDR is the instrument that organizes the care and orders the process of regionalization of health, to promote greater access of the population to all levels of health care (BRASIL, 2006).
This is a quantitative study, which had as data sources, available on the internet, the Information System on Public Health Budgets (Siops) and the National Health Fund (NHF) to obtain information about the financing of actions and public health services at the government spheres; in ad-dition to the system of population informa-tion maintained by the Brazilian Institute of Geography and Statistics (IBGE). Siops is a SUS planning, management and social control instrument that gathers informa-tion about health financing and expen-diture on health of municipalities, states and the Union, and it is mandatory to reg-ister and update the data, which makes it possible to supervise and evaluate health financing in Brazil. The NHF, in turn, pro-vides complementary information about the financial management of the SUS resources, being possible to access pro-grams, agreements, consultation of pay-ments, among other data (BRASIL, 2011).
Data collection was performed between august 2013 and september 2014, period in which 99% of the total municipalities had transmitted their financial information for the years 2009 to 2012. In 2010, all munici-palities informed the data to Siops; in 2009 and 2011, 99,8%; and, finally, in 2012, 96,4%.
For municipalities that had not reported their financial information to Siops during the data collection, were used, in addition, data of the NHF.
The data reported by the municipalities on the financial resources destined to the execution of health actions and services were collected and organized based on the National Health Accounts (NHA) model, initially developed in the United States and improved by the World Health Organization
(ROSA; COELHO, 2011). This model enables
moni-toring of changes in resource allocation patterns in a given time series and the evalu-ation of the importance given by the govern-ment to certain strategic programs and to the health care system, as a whole, adopted from financial incentives (WHO, 2003).
To standardize the concepts used, the NHA model adopts the basic principles of the System of Health Accounts (SHA), of the Organization for Economic Cooperation and Development (OECD), contained in the SHA Classification Manual, the International Classification for Health Accounts (ICHA) (WHO, 2003). Since SHA is most useful for health systems with a single source of re-sources, the NHA disaggregates the catego-ries, making them more flexible and adapted to the complexity of countries like Brazil, having been adapted to our information systems (ROSA; COELHO, 2011).
The NHAs measure health expenditures in the form of four basic tables. In this study, the first of the four basic tables of the model were used: Financing Sources versus Financing Agents. The sources represent the entities responsible for providing funds for the health sector, while the agents are considered intermediaries of these funds, who use them to pay for health services and products (COELHO; CHAGAS, 2006). These
when), broadening, this way, the vision of the whole structure of health financing.
The NHA model used was adapted to the reality of the brazilian financing and information systems to contemplate the changes in the sources of financing of the SUS each year. It is expected that the model will provide more accessible infor-mation for managers and social control, considering its potential and its ease of use (COELHO; CHAGAS, 2006).
As defined in the national treasury manual (BRASIL, 2004), revenues refer to inflows
of financial resources in government coffers to cover public expenditures. In the budget perspective, the revenues fulfill some stages, and, when the transaction has already been made, the revenue is considered as realized. This type of income consists of a proxy used to measure health expenditures, understood as the resources expended by a given agent, for a given purpose: the financing of actions and health services. Thus, federal and state expenditures constitute revenues trans-ferred to municipalities, while municipal expenditures are represented by the own resources of the Siops (TELES, 2015).
The tables were assembled in different stages that included the construction of op-erational instruments, in which the financial values were accommodated. At the end of the feeding-construction, were obtained the sources of financing used by all municipali-ties, grouped in macro-regions and health regions (horizontal axis), and the totality of agents or managers of the financing (vertical axis), in a single table. The data were tabu-lated in a maximum level of disaggregation for the sources, according to the information systems used and by year of entry into the Municipal Health Funds.
Data analysis and interpretation were performed based on rankings, averages and percentages, as well as the construc-tion of financing indicators, such as Public
Expenditure on Health (PEH), the PEH per capita, the PEH as a proportion of the GDP of the state of Bahia, among other measures of the relation between financing and the production of health services. The PEH refers to the sum of federal, state and munic-ipal expenditures executed under the SUS, declared by municipalities, while PEH per capita is originated from the division of total annual health expenditure by the population of the state each year.
To analyze the evolution of expenditures in the state and so that the comparison between the years could occur through real values, nominal values were deflated by the Amplified Consumer Price Index (IPCA), based on the month of december 2012. When the interest was in the distribution of resources between municipalities and health regions, the nominal value of financial re-sources was maintained.
This study used data from the public domain, still, the project from which it origi-nated was approved by the Research Ethics Committee of the State University of Feira de Santana, under the opinion nº 558.940/2014.
Results e discussion
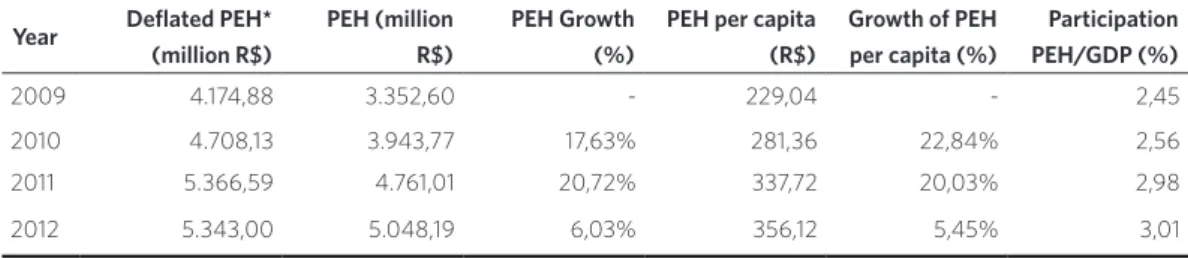
In the state of Bahia, including resources spent by the three spheres of government, in the period from 2009 to 2012, total PEH, considering the cumulative inflation of the period, was approximately R$19,59 billion. The expense went from R$4.174.876.056,72, in 2009, to R$5.343.000.775,05, in 2012, cor-responding to an increase of 28%. The PEH trajectory, from 2009 to 2011, was presented in a linear fashion. From 2009 to 2010, the increase was around 13%, and from 2010 to 2011, 14%. Between 2011 and 2012, however, there was a decrease of R$23.587.999,16, that is, PEH decreased by 0,44%, as shown in
It is worth highlighting that these values do not consider the resources managed by the State Health Secretariat (Sesab). In addition to the resources managed by Sesab (owned by the state treasury and transferred by the federal government) to those managed by the municipalities, public expenditures with SUS, in the state of Bahia, accumulated in the four years of study, in reais, in december 2012, was approximately R$30,94 billion (TELES, 2015).
However, since these resources cannot be disaggregated, they were not accounted for in the distribution of resources by municipality, region and macro-region of health.
A study that used the same NHA method-ology, however, including own state resourc-es not passed on to the municipality, found a health expenditure for the state of Bahia in 2002, of R$2.299.710.019,00. Correcting the inflation of the period, the value of R$4.570.295.104,00, is well below the real value of 2012, which totaled R$7,68 billion with the addition of the own deflated re-sources of the Sesab, which expressed a con-siderable and real increase of 68,12% (COELHO; TELES; FERREIRA, 2016).
The PEH per capita increased from R$285,22, in 2009, to R$376,92, in 2012, pre-senting a growth of 32,15% in the period. The fact that the population of the state of Bahia remained with no greater changes resulted in a pattern of per capita spending behav-ior like that of PEH – growth from 2009 to 2011 and reduction in 2012, compared to the previous year –, with the exception of,
from 2009 to 2010, the highest increase in
per capita value of the whole period was ob-served, around 17,77%.
Spending as a proportion of GDP is an im-portant indicator of the degree of government commitment to constitutionally guaranteed rights. The share of GPS in the PEH of the state increased from 3,05%, in 2009, to 3,19%, in 2012, which also confirms the growing trend of spending on health actions and services.
The decentralization of financial resourc-es and the management of health servicresourc-es and actions for states and municipalities is an organizational guideline of SUS that is closely related, in conceptual and opera-tional terms, with the other principles. Not by chance, it assumes a structural axis role in the articulation and cooperation between the levels of government. Among the main purposes of including decentralization among the constitutional precepts of SUS was the possibility of producing a better balance between the regions of the Country, reducing, thus, regional inequalities in health in terms of distribution of resources and expansion of access to the local level
(GERSCHMAN; VIANA, 2005).
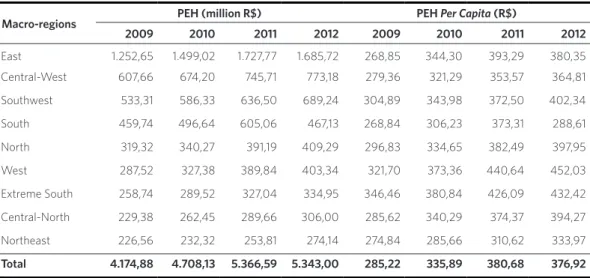
This way, as important as the total volume of resources destined to the SUS in a state is to observe how the distribution of these expendi-tures occurs between its macro-regions, health regions and municipalities. The table 2 shows the distribution of PEH and its per capita varia-tion in the macro-regions of the state, in the four-year period under analysis.
Table 1. Public Expenditure on Health (PEH), per capita expenditure and proportion of the GDP of Bahia, 2009-2012
Source: Siops/IBGE/Superintendency of Economic and Social Studies of Bahia (SEI). *Deflated values for December 2012, according to the Amplified Consumer Price Index (IPCA).
Year Deflated PEH* (million R$)
PEH (million R$)
PEH Growth (%)
PEH per capita (R$)
Growth of PEH per capita (%)
Participation PEH/GDP (%)
2009 4.174,88 3.352,60 - 229,04 - 2,45
2010 4.708,13 3.943,77 17,63% 281,36 22,84% 2,56 2011 5.366,59 4.761,01 20,72% 337,72 20,03% 2,98
It is noticed a situation of imbalance and inequality, regarding the distribution of PEH in the macro-regional perspective. The Eastern macro-region is notable for the large volume of spending, surpassing R$1 billion in all the years highlighted in the study, with an increase of more than 34%, followed by the Central-Eastern macro-region, where PEH ranged between R$607,66 million, in 2009, and R$773,18, in 2012, revealing a percentage growth of about 27%. On the other hand, the Northeast macro-region exhibits the lowest values throughout the four-year period.
Undoubtedly, the number of beds per capita provides an idea of the installed capacity in terms of health services in a region. Headquarters of the state capital, the eastern macro-region is the one that per-forms the most complex procedures and has the highest number of beds per capita, fol-lowed by the South, Southwest and Central-East macro regions, while the Northeast and North macro regions present the least amount of beds. It should be noted that an allocative culture prevails in Brazil, which prioritizes regions with higher installed capacity of health services, which have the
best sanitary and socioeconomic conditions
(BAHIA, 2012; TELES; COELHO; FERREIRA, 2016).
Analyzing the per capita distribution of PEH, there is a growing picture for most macro-regions, throughout the four-year period, with the exception of the Eastern and Southern macro-regions, where the
per capita values of 2012 (R$380,35 and R$288,61, respectively) fell in relation to 2011 (R$393,29 and R$373,31). In the case of the macro-region of the South, this de-crease was very significant, around 23%, which resulted, in the comparison between the macro-regions, in the lower per capita
expenditure in 2012. Despite totaling, from 2009 to 2012, a positive percentage change of 7,35%, this growth was not enough to change its position in the ranking of regional health spending.
The Western and Extreme South macro-regions had the highest per capita values in all years, showing growth of, respectively, 40,51% and 24,81% in the period. In 2009, the East macro-regions (R$268,85) and South (R$268,84), by the way, the most populous of Bahia, obtained the lowest values per capita. In 2010 and 2011, it was the turn of
Table 2. Distribution of Public Expenditure on Health (PEH) and its per capita variation in the state of Bahia, 2009-2012
Source: Siops/IBGE.
Note: Deflated values for December 2012, according to the Amplified Consumer Price Index (IPCA).
Macro-regions PEH (million R$) PEH Per Capita (R$)
2009 2010 2011 2012 2009 2010 2011 2012
East 1.252,65 1.499,02 1.727,77 1.685,72 268,85 344,30 393,29 380,35 Central-West 607,66 674,20 745,71 773,18 279,36 321,29 353,57 364,81
Southwest 533,31 586,33 636,50 689,24 304,89 343,98 372,50 402,34
South 459,74 496,64 605,06 467,13 268,84 306,23 373,31 288,61
North 319,32 340,27 391,19 409,29 296,83 334,65 382,49 397,95
West 287,52 327,38 389,84 403,34 321,70 373,36 440,64 452,03
Extreme South 258,74 289,52 327,04 334,95 346,46 380,84 426,09 432,42
Central-North 229,38 262,45 289,66 306,00 285,62 340,29 374,37 394,27
Northeast 226,56 232,32 253,81 274,14 274,84 285,66 310,62 333,97
the Northeast macro-region to highlight the lowest per capita expenditure, respectively, R$285,66 and R$310,62.
The situation of the Northeast macro-region is doubly represented here in terms of inequality, since this macro-region pres-ents low expenditures, in all the years of the study, both in absolute and per capita terms. This data becomes, thus, important, since it evidences significant differences in the distribution of resources, even though re-gionalization presents itself as a strategy for achieving integrality, broadening access and equity in SUS.
The strong decentralization process, with an emphasis on municipalization, has reiter-ated regional inequalities, mainly in terms of medium and high complexity financing, as well as causing great dependence on states and municipalities in relation to the Union. In this context, regionalization, foreseen since the Federal Constitution and subse-quent laws and ordinances as a mechanism of decentralization, consisted of an attempt to overcome the inability of many munici-palities to finance their own actions and health services (RODRIGUES, 2010; MARTINELLI; VIANA; SCATENA, 2015).
The Eastern macro-region, according to the PDR of the state of Bahia, is composed of 48 municipalities located in four health regions: Camaçari, Cruz das Almas, Salvador and Santo Antônio de Jesus. Two of these
regions were, from 2009 to 2012, at the top of the PEH ranking: Salvador led in the four years with respective R$654.528.252,00, R$ 862.708.359,00, R$1.089.613.935,00 and R$1.088.590.018,00; and Camaçari ranged between the third and fourth positions with the region of Vitória da Conquista, Southwest macro-region, with the following values: R$190.042.858,00, R$214.356.948,00, R$230.186.284,00 and R$246.532.727,00.
The region of Feira de Santana, in the Central-East macro-region, had the second highest expenditure in all years (R$ 275.726.806,00, R$ 311.141.384,00, R$ 370.346.887,00 and R$ 405.985.232,00). On the other hand, the lowest values were observed by the same trio of regions – Seabra, Ibotirama and Itapetinga –, whose PEH ranged from R$34.589.987,00 to R$76.903.088,00. Despite some changes in the ranking of expenditures, it has been observed that, over the years, spending patterns have been maintained, especially among regions that have spent more and less resources on public health actions and services.
It can be observed that half of the regions did not reach the state’s average per capita
expenditure (R$280,36). The region of Salvador, which had presented the largest PEH, was below average (R$274,75). Only two health regions, Camaçari and Barreiras, spent more than R$350,00 per inhabitant/ year. This is an interesting fact, since the mu-nicipality of Camaçari is home to the largest industrial center in Bahia, while Barreiras is one of the largest agricultural centers in
Bahia, which stimulates and influences the economy of its health regions. In 2010, they were among the municipalities with the highest GDP per capita in Bahia, respective-ly, R$53.464,89 and R$13.649,55 (IBGE, 2010).
When ordering the PEH of the 417 mu-nicipalities of Bahia in a decreasing way, in the period from 2009 to 2012, it was ob-served that the five municipalities with the highest values remained in the same position during the four years studied, in the following
Graph 1. Public Expenditure on Health per capita in the health regions of the state of Bahia, in 2010
Source: Siops/IBGE.
Camaçari
Irecê
Bahia Barreiras
Santa Maria da Vitória
Salvador
Alagoinhas Teixeira de Freitas
Itaberaba
Cruz das Almas
Seabra
Itapetinga Feira de Santana
Brumado
Jacobina
Senhor do Bonfim
Serrinha Vitória da Conquista
Jequié Porto Seguro
Guanambi
Itabuna
Valença Paulo Afonso
Ilhéus Juazeiro
Santo Antônio de Jesus
Ibotirama
Ribeira do Pombal
order: Salvador, Feira de Santana, Vitória da Conquista, Camaçari and Juazeiro, ranging from R$68.774.537,00 to R$864.469.915,00. From then on, the municipalities began to occupy, increasingly, different positions, as was the case of Anguera, which left the last position (417th), in 2009, with a value of R$1.102.078,00, to position 390th (R$2.098.147,00), in 2010, and from position 362nd (R$2.831.784,00), in 2011, to position 371st (R$3.090.808,00), in 2012. Anyhow, Anguera, like other smaller mu-nicipalities, remained in the worst quadrant, or among the hundred municipalities with the lowest health expenditure.
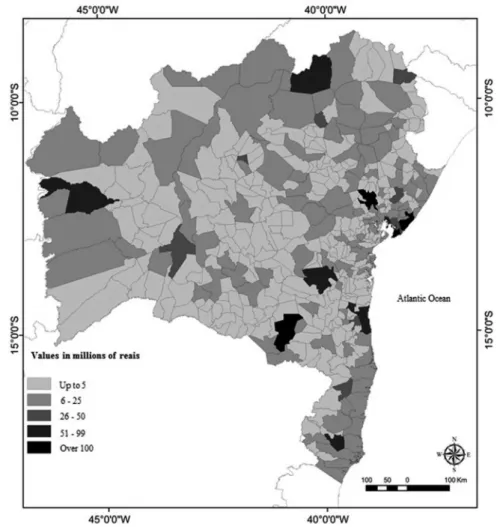
The figure 1 shows the geographical
distribution of PEH by municipalities in the state of Bahia, in 2010. The analysis by size of expenditure reveals that, approximately, 70% (290) of the municipalities of Bahia did not exceed the level of R$5 million. About 26% (107) were in the range of R$6 million to 25 million, 2,4% (10) in the expenditure between R$26 million to 50 million, 1,44% (6) from R$51 million to 99 million, and finally, those that surpassed the R$100 million figure rep-resented only 0,96% (4) of the total munici-palities, they are: Salvador (R$667.190.609,00), Feira de Santana (R$185.361.146,00), Vitória da Conquista (R$118.908.234,00) and Camaçari (R$114.701.239,00).
Figure 1. Geographic distribution of the Public Expenditure on Health of the municipalities of the state of Bahia, in 2010
Approximately 60% of the municipalities of Bahia are considered small-sized, with less than 20.000 inhabitants. This fact requires, un-doubtedly, a greater effectiveness in the forma-tion of the health services network, especially for medium and high complexity, since these small municipalities present difficulties to develop these types of services, due to the in-sufficient contributions of resources, and even to develop basic care (BAHIA, 2009).
A study carried out by Rosa and Coelho
(2011) brought to light an important
reflec-tion on the federal financing of the Family Health Program (FHP), in 2005 (before the Health Pact and the financing blocks) in a municipality of medium size in Bahia. The fact was that the average cost of one FHP unit was R$17.302,00 per month, but the federal government only passed 16,4% of this amount (R$2.834,00), making it clear that this program was underfinanced by the federal government, as well as its inductive role in the development of the policy, since the municipality needed to make great effort to comply with the norms and guidelines postulated and to increase the access to this type of service.
The figure 1 shows, also, that the largest expenditures were evidenced in the Eastern macro-region, which includes the mu-nicipalities of Salvador and Camaçari. It is worth mentioning that the municipalities with the highest spending (over 100 million) had, in 2010, the largest population in Bahia, with more than 240 thousand inhabitants. Therefore, health spending, in addition to being concentrated in the richest region of the state, was related to the population size of the municipalities.
In terms of PEH, the municipal-ity of Salvador deserves to be highlighted. Analyzing the evolution of the year-to-year expenditure of the capital of Bahia, whose population decreased from 2.998.058 in-habitants, in 2009, to 2.710.968, in 2012, the following sequence of values is shown: R$ 472.145.804,00, R$ 667.190.609,00, R$
864.469.915,00 and R$ 834.285.786,00. Compared with the municipality of Feira de Santana, which had the second largest expense in the period, PEH in Salvador was almost four times higher, in 2011. Next, the annual values, from 2009 to 2012, in Feira de Santana: R$ 171.573.668,00, R$ 185.361.146,00, R$ 218.780.752,00 and R$ 224.621.098,00.
Coelho and Chagas (2006), with the purpose
of describing the flow of health resources in the municipality of Feira de Santana for the year 2002, measured the expenditures in the sector with Siops data from the NHA model, the same methodology used in this study. As a result, they found health spending, including the three levels of government, of about R$75 million. In a comparative analysis with the findings of the year 2010, it is possible to estimate an increase of almost 150% in the period.
Looking at the distribution of health expenditure per capita, the position of mu-nicipalities changes drastically. The munici-pality of Salvador, which assumed the first place in the ranking of absolute spending, in the year 2009, was in the 377th position, with PEH per capita of only R$ 157,48. Then, in the year of 2010, it reached 246th place, with R$249,36 per inhabitant/year, and, in 2011, it reached 168th position (R$320,93). Finally, it rose again in the ranking, in 2012, to 284th place, with R$307,74 per inhabit-ant/year. In return, smaller municipalities stood out more, as is the case of Madre de Deus, São Félix, Irecê, São Francisco do Conde, among many others. The latter draws attention. With an average population of 33 thousand inhabitants, in the period, it pre-sented the highest expenditures per capita of the state in all the years: R$1.699,49, in 2009; R$1.844,54, in 2010; R$2.004,09, in 2011; and R$2.198,92, in 2012.
A study carried out by Rodrigues (2010)
found, at a national level, some similar and different results of this research, since both total health spending and per capita
municipalities, especially in the North and Northeast regions of Brazil, with higher ex-penditure in the Southwest, especially for municipalities with a population of more than 500 thousand inhabitants. In short, it was spent more in the richer regions and in the more populous municipalities of Brazil. The detail is that 90,6% of the brazilian local-ities have less than 50 thousand inhabitants.
Conclusions
It should be noted that the resources handled by the municipalities of the state of Bahia, from 2009 to 2012, have shown an increase in the expenses with actions and public health services. However, there was a decrease in PEH in the last year of the qua-drennium in relation to the previous year.
Analyzing the distribution of spending among the macro-regions, there was a great imbalance in favor of those who, evidently, have greater installed capacity, such as East and Central-East. In view of the large population of these regions, these contribu-tions have not yet proved sufficient, since the respective expenditures per capita were among the minors of the state.
Regarding the indicators used, the PEH seems to be intrinsically related to the population size of the municipalities. The expenditure of, approximately, 70% of the municipalities was less than R$5 million, in 2010. Only four municipalities spent more than R$100 million on health, not by chance, the most populous in Bahia, which translates into a policy of financing that is strongly based on the population criterion, but which cannot be enough to reduce inequalities.
Regarding the mechanisms for allocating resources used by government spheres, it should be pointed out that transfers of re-sources need not only follow equality crite-ria, such as per capita transfers, but also must be adjusted based on the demographic, epi-demiological and socioeconomic conditions
of each municipality or region. This mecha-nism is still incipient in the management of the resources of SUS.
One of the main challenges in the in-vestigation of public spending is the diffi-culty of accessing information on the health budget. Although Siops, the main informa-tion system for financing health acinforma-tions and services, has already been consolidated for more than a decade, some information is still difficult to access, especially about de-tailed state expenditure. In addition, some municipalities do not yet adequately and periodically transmit information about the detail of their resources, and it is necessary, sometimes, to resort to other information systems, such as the Computer Department of the Unified Health System (Datasus) and the NHF, to avoid distortions in results.
For most of the analysis period, resources for health have increased. But it is important to highlight that the demand for services has also increased considerably in recent years, throughout Brazil, especially with the expansion of access from the expansion of Primary Care. Thus, given the difficulties that the population faces, especially when it needs the services of medium and high complexity, this increase in spending is not so visible in the daily life of users and health workers of the SUS, who continue to com-plain about the precariousness of services.
References
BAHIA. Secretaria de Saúde do Estado da Bahia. Plano
Estadual de Saúde 2007-2010. Rev. Baiana de Saúde
Publ., v. 33, n. supl., p. 13-87, nov. 2009.
______. Secretaria de Saúde do Estado da Bahia. Plano
Estadual de Saúde 2012-2015. Rev. Baiana de Saúde
Publ., Salvador, v. 36, n. supl., p. 1- 166, dez. 2012.
BRASIL. Lei Complementar nº 141, de 13 de janeiro de 2012. Regulamenta o § 3o do art. 198 da Constituição Federal para dispor sobre os valores mínimos a serem aplicados anualmente pela União, Estados, Distrito Federal e Municípios em ações e serviços públicos de saúde; estabelece os critérios de rateio dos recursos de transferências para a saúde e as normas de fisca-lização, avaliação e controle das despesas com saúde nas 3 (três) esferas de governo; revoga dispositivos das Leis nos 8.080, de 19 de setembro de 1990, e 8.689, de
27 de julho de 1993; e dá outras providências. Diário
Oficial [da] União, Brasília, DF, 16 jan. 2012. Disponível em: <http://www.planalto.gov.br/ccivil_03/leis/LCP/ Lcp141.htm>. Acesso em: 12 maio 2017.
______. Ministério da Fazenda. Secretaria do Tesouro
Nacional. Receitas públicas: manual de
procedimen-tos aplicado à União, Estados, Distrito Federal e Municípios. Brasília, DF: Ministério da Fazenda, 2004.
______. Ministério da Saúde. Conselho Nacional de
Secretários de Saúde. O Financiamento da Saúde.
Brasília, DF: CONASS, 2011.
______. Ministério da Saúde. Conselho Nacional de
Secretários de Saúde. SUS: avanços e desafios. Brasília,
DF: CONASS, 2006.
______. Resolução da CIB nº 164, de 27 de maio de 2013. Aprova a transferência do município de Maraú, da região de saúde de Valença para a região de saúde
de Itabuna. Diário Oficial [da] União, Brasília, DF, 28
maio 2013. Disponível em: <http://portalarquivos. saude.gov.br/images/pdf/2015/junho/03/4.a%20--%20RESOLU%C3%87%C3%83O%20CIB-BA%20 N%C2%BA%20164.pdf>. Acesso em: 12 maio 2017.
COELHO, T. C. B.; CHAGAS, F. L. O fluxo dos recursos públicos de saúde em 2002 no município de Feira de Santana-BA: das fontes de financiamento até as
ativi-dades. Bahia Anál Dados, Salvador, v. 16, n. 2, p. 303-313,
jul./set. 2006.
COELHO, T. C. B.; SCATENA, J. H. G. Financiamento do SUS. In: PAIM, J. S.; ALMEIDA-FILHO, N. (Org.).
Saúde Coletiva: teoria e prática. Rio de Janeiro: MedBook, 2014. p. 271-286.
Collaborators
Andrei Souza Teles, Thereza Christina Bahia Coelho and Milla Pauline da Silva Ferreira
COELHO, T. C. B.; TELES, A. S.; FERREIRA, M. P. S.
Financiamento do SUS: abrindo a caixa-preta. Feira de Santana: UEFS, 2016.
GERSCHMAN, S.; VIANA, A. L. A. Descentralização e desigualdades regionais em tempos de hegemonia
li-beral. In: LIMA, N. T. et al. (Org.). Saúde e Democracia:
história e perspectivas do SUS. Rio de Janeiro: Fiocruz, 2005. p. 307-352.
INSTITUTO BRASILEIRO DE GEOGRAFIA E
ESTATÍSTICA (IBGE). Cidades: Bahia. Rio de Janeiro:
IBGE, 2010. Disponível em: <http://cidades.ibge.gov. br/xtras/perfil.php?codmun=290570>. Acesso em: 6 set. 2012.
MARQUES, R. M.; PIOLA, S. F. O financiamento da Saúde depois de 25 anos de SUS. In: RIZZOTTO, M. L.
F.; COSTA, A. M. (Org.). 25 anos do direito universal à
saúde. Rio de Janeiro: Cebes. 2014. p. 177-94.
MARTINELLI, N. L.; VIANA, A. L. A.; SCATENA, J. H. G. O Pacto pela Saúde e o processo de regionalização
no estado de Mato Grosso. Saúde em Debate, Rio de
Janeiro, v. 39, n. esp., p. 76-90, dez. 2015.
MENDES, A.; MARQUES, R. M. O financiamento
do SUS sob os “ventos” da financeirização. Ciência &
Saúde Coletiva, Rio de Janeiro, v. 14, n. 3, p. 841-850, 2009.
PIOLA, S. F.; FRANÇA, J. R. M.; NUNES, A. Os efeitos da Emenda Constitucional 29 na alocação regional dos gastos públicos no Sistema Único de Saúde no Brasil.
Ciência & Saúde Coletiva, Rio de Janeiro, v. 21, n. 2, p. 411-421, 2016.
RODRIGUES, R. Federalismo, relação público-privado
e gasto em saúde no Brasil. Rev Política, Planejamento e
Gestão em Saúde, v. 1, n. 1, p. 141-156, 2010.
ROSA, M. R. R.; COELHO, T. C. B. O que dizem os gastos com o Programa Saúde da Família em um
município da Bahia. Ciência & Saúde Coletiva, Rio de
Janeiro, v. 16, n. 3, p. 1863-1873, 2011.
SANTOS, N. R. SUS, política pública de Estado: seu desenvolvimento instituído e instituinte e a busca de
saídas. Ciência & Saúde Coletiva, Rio de Janeiro, v. 18, n.
1, p. 273-280, 2013.
SILVA, F. S. Organização das redes regionalizadas e integradas de atenção à saúde: desafios do Sistema
Único de Saúde (Brasil). Ciência & Saúde Coletiva, Rio
de Janeiro, v. 16, n. 6, p. 2753-2762, 2011.
TELES, A. S. Financiamento do Sistema Único de Saúde
no estado da Bahia. 2015. 129 f. Dissertação (Mestrado em Saúde Coletiva) – Programa de Pós-Graduação em Saúde Coletiva, Universidade Estadual de Feira de Santana, Feira de Santana, 2015.
TELES, A. S.; COELHO, T. C. B.; FERREIRA, M. P. S. Sob o prisma da equidade: financiamento federal do
Sistema Único de Saúde no estado da Bahia. Saúde Soc.,
São Paulo, v. 25, n. 2, p. 786-799, 2016.
WORLD HEALTH ORGANIZATION (WHO). Global
Health Observatory (GHO) data. Geneva: WHO, 2015. Disponível em: <http://www.who.int/gho/en/>. Acesso em: 8 maio 2015.
______. Guide to producing national health accounts:
with special applications for low income e middle--income countries. Geneva: Switzerland, 2003.
______. World health statistics. Geneva: WHO, 2013.
Disponível em: <http://www.who.int/gho/publica-tions/world_health_statistics/2013/en/>. Acesso em: 15 abr. 2015.
Received for publication : October, 2016 Final version: April, 2017
Conflict of interests: non-existent