Luciano Eduardo Maluf Patah Ana Maria Malik
GVsaude. Escola de Administração de Empresas de São Paulo. Fundação Getúlio Vargas. São Paulo, SP, Brasil
Correspondence:
Luciano Patah
R. Peixoto Gomide, 1903 Jardim Paulista
01309-003 São Paulo, SP, Brasil E-mail: [email protected] Received: 11/5/2009
Approved: 8/23/2010
Article available from: www.scielo.br/rsp
Models of childbirth care and
cesarean rates in different
countries
ABSTRACT
The paper reports the results of a literature review on cesarean rates and models of childbirth care in different countries according to their utilization of technology. There were reviewed 60 studies published between 1999 and 2010 retrieved from the Brazilian Federal Agency for Support and Evaluation of Graduate Education (CAPES) and ProQuest databases. The Brazilian model of childbirth care relies on the physician-patient relationship, level of technology utilization and cesarean delivery.
DESCRIPTORS: Cesarean Section, statistics & numerical data. Perinatal
Care, trends. Review.
INTRODUCTION
Models of childbirth care and cesarean rates have been discussed since the
1980s.6,18,22,34 The complexity of factors involved in child delivery and
child-birth care has raised questions ranging from the quality of obstetric care to the
meaning of childbirth to women.5
According to the World Health Organization (WHO), childbirth care aims to keep the mother’s and her child’s health, with minimal medical intervention,
and ensure their safety.a The WHO recommends health providers get involved in
the birth of a child only when necessary. Despite this recommendation, cesarean rates are increasing in several countries, and many international and national studies have been conducted to understand this trend.1,5,7,10,15,17,20
Cesarean delivery is a surgical procedure originally designed to reduce the risk of maternal and/or fetus complications during pregnancy and labor. It is
not a risk-free procedure37 in spite of its improved safety. Cesarean sections
were fi rst only performed in dead women to save their fetus but now it has
performed to protect the mother and her child in complicated situations. While most authors agree cesarean sections should not be performed when there is no medical indication, some claim that improvements in surgical techniques, infection prevention and blood transfusions would permit to indicate it to meet
the mother’s and/or her family’s needs.28,29
Cesarean rates are increasingly common almost worldwide. The main reasons for this increase reported in the literature are social, demographic, cultural and
economic characteristics of pregnant women2,20 associated with the mother’s
request and factors related to health care models in some countries including
aspects of medical practice, medical preferences1 and economic interests of
different actors involved in this process.9,22
Different countries have unique characteristics as to health care organization, public health priorities, health policies and level of state intervention and involve-ment at different levels of care. Social, economic and educational differences of their populations are also relevant. Prenatal care is shaped to these characteristics, determining the model of childbirth care. The model of hospital childbirth care together with non-consensus
medical interventions14 have been questioned by the
society and academic community,24 and compelling
criticism has been centered on obstetric practice. In this context, the present review aimed to describe models of childbirth care and related cesarean rates in some countries.
METHODS
Aspects related to the history of international recommen-dations on cesarean rates are here summarized. Then, obstetric care in some countries is categorized based on their level of intervention following the classifi cation
proposed by Wagner43 (2001), and their recent cesarean
rates are presented. Finally, the model of childbirth care in the Brazilian health system is described, as well as cesarean rates in the public and private sectors. In this study a literature review was carried out in the Coordenação de Aperfeiçoamento de Pessoal de Nível Superior (CAPES – Brazilian Federal Agency for Support and Evaluation of Graduate Education) and ProQuest databases and the main publications on childbirth care comprising the period 1999–2010 were retrieved. The search strategy included the following descriptors: “cesarean,” “delivery,” “cesarean rates,” “health systems,” “health model,” “models of care,” “perinatal care,” “decision making factors,” “deter-minants,” in Portuguese and “cesarean section,” “statistics & numerical data,” “perinatal care, trends” in English. There were retried 65 articles, of which 44 were selected to be reviewed as they addressed care models and types of delivery.
Some relevant studies from a period earlier than the study period were included to offer conceptual support.
RESULTS
International recommendations about cesarean rates
In the late 1970s and early 1980s an international collaboration group was established to examine child-birth care, and in 1985, the “Conference on Appropriate Technology for Birth” was held with WHO coordina-tion. This meeting was a milestone in public health and
b Organization for Economic Cooperation and Development. Health at a Glance. OECD Indicators 2005. Paris; 2005
women’s rights advocacy, and its recommendations (Fortaleza consensus) sought to promote actions for change in the organization and model of obstetric care. The report recommended, among others, women’s involvement in the design and evaluation of programs, women’s free choice of birth position, the presence of doulas during labor and delivery and the end of certain medical procedures during labor/delivery (e.g., routine
episiotomy and drug induction of labor).13
The WHO has argued since this fi rst meeting that
lower rates of perinatal mortality are seen in countries where cesarean rates are below 10% and rates above
10%–15% are not justifi able.44 The WHO
recommenda-tion that optimal cesarean rates should not be higher
than 10% to 15%44 was published in The Lancet and
is a reference up to this date; however, it does not differentiate countries and regions with specifi c cultural characteristics and distinct health systems. Moreover, this recommendation has not been updated despite the new available technologies, changes in women’s behaviors as their insertion in the labor market has
become more signifi cant, the increased availability of
health information (scientifi c or otherwise), and better schedule management by health providers.
The International Federation of Gynecology and Obstetrics (FIGO) Committee for Ethical Aspects of
Human Reproduction and Women’s Health affi rmed, in
1999, that there was no scientifi c evidence supporting
cesarean for non-medical reasons. Medical institutions have been since highly concerned about increasing cesarean rates due to several factors, such as physi-cians’ fear of legal actions, psychological and social
and cultural aspects of pregnant women and fi nancial
incentives for doctors.25
In contrast to FIGO guidelines, the American College of Obstetricians and Gynecologists (ACOG) has issued a guideline stating that, given there was no signifi cant evidence about the risks and benefi ts of cesarean sections, American doctors can ethically perform a cesarean delivery when they judge it will provide a greater level of health and well-being to the mother and her child than vaginal delivery. The ACOG has also recommended American doctors not to perform a cesarean when they do not agree with the patient’s request and are not able to convince them otherwise, and they should refer these
patients to another provider.4 More recently the ACOG
reinforced this with a new recommendation, ethically
approving cesarean sections on demand.3
Is there an optimal cesarean rate?
Almost all members of the Organization for Economic Cooperation and Development of European Countries
(OECD)b have cesarean rates above the 10% to 15%
c Patah LEM. Por que 90%? Uma análise das taxas de cesárea em serviços hospitalares privados do município de São Paulo. [doctoral thesis]. São Paulo: Escola de Administração de Empresas de São Paulo da FGV; 2008.
Some African countries have low cesarean rates.a
This fact can be explained by lack of medical care and access barriers to health care. In parts of Africa it is estimated that one in every 12 women die from obstetric causes, possibly due to limited access to
medical and hospital care.35 This is especially true in
the Sub-Saharan Africa, in countries such as Burkina
Faso, Rwanda and Ethiopia.16
Many authors argue that the optimal rates proposed by the WHO in 1985 are a reference only rather than a
normative goal.6 According to the WHO Family Health
and Community manager in 2001, the WHO recom-mendation is quite reasonable based on expert opinion
and medical knowledge at that time.6 He contends that
countries with high-risk populations (and low socioeco-nomic development) would have need of performing higher cesarean rates than other countries, whereas those with low-risk populations may have an excess rate and
would require local assessment of the optimal rate.6
Models of childcare and cesarean rates
The clinical determinants of cesarean sections seem to be associated to maternal and fetal health conditions, which are considerably similar in different parts of the world.
In a recent study, Mendoza-Sassi et al34 found risk
factors for cesarean sections are not consistent when examined individually, and they suggested a combined analysis of patient’s behavior and medical practice within the care model.
The increase in cesarean rates over the past 20 years and differences between countries should be contextualized and analyzed in terms of social and cultural factors as well as the health care model as they could have an
infl uence over the choice of the delivery mode.c
The models of childbirth care have different character-istics such as: forms of payment of health providers, funding for the system, provision of care staff, birth
setting, confl icts of interest, reserve labor market,
among others. The model adopted in a given setting
has strong infl uence over the choice of delivery mode,
both by the woman and the health provider assisting childbirth. The model of obstetric care has a major role in the physician-patient relationship, economic incen-tives, utilization of medical technology and cesarean rates.21,22 Aspects related to malpractice lawsuits10 and physicians’ perception of the mother’s desired delivery
mode17 also infl uence medical practice. Few studies
have examined economic and incentive-related factors that may be associated to physicians’ interests and their decision for a cesarean section and these factors should be analyzed according to the prevailing medical model
and forms of payment for services in a given country, region or clientele.8,22
Wagner43 (2001) classifi ed the models of childbirth care into three categories:
• a highly medicalized model based on high tech-nology and low involvement of midwives, found in the U.S., Ireland, Russia, Czech Republic, France, Belgium and urban areas of Brazil;
• a less medicalized model, so-called “humanized care,” characterized by greater involvement of midwives and low level of interventions, found in the Netherlands, New Zealand and Scandinavian countries;
• an intermediate model, found in Great Britain, Canada, Germany and Australia.
Each of these models and countries has distinctive medical and social behaviors, and cesarean rates. In the group of countries with a highly medicalized model of care, cesarean rates have been most exten-sively studied in the U.S. as they are the most common surgical procedure among women. In the U.S., the cesarean rate progressively increased from 1970 until mid-1980s when it peaked at 25%. After that it declined to 22.6% in 1991 and 20.7% in 1996 due to an increase in vaginal births in women with previous cesarean sections, encouraged by government programs. But then the rates have rebounded due to increased rates in women without previous cesarean (primary cesarean section) and a reduction of vaginal delivery in women with previous cesarean sections. In 2000 it reached
22.9%32 and increased continuously until 2004, when
1.2 million women underwent cesarean sections accounting for 29.1% of all deliveries.23,33 U.S. studies attribute this high rate to the practice of defensive medi-cine with doctors afraid of malpractice lawsuits, and
the mode of delivery is a patient choice.19 Recent data
show new high rates of about 31.8% in 2007.11,a
In the U.S. model of care, obstetricians provide childbirth care, including prenatal care and vaginal or cesarean delivery, mostly in in-hospital settings. Patients are seen by doctors of their choice at private clinics and by the obstetrician on duty in public maternity hospitals. In this model, the cesarean rate in private settings can
be determined by physician convenience,42 including
their time availability, schedule management, and form of payment. Physicians caring for patients with private insurance are better paid and perform more cesareans than those assisting women in the U.S. public health
system.22 Patients with private insurance can choose
Caesarean sections on demand increased by 42% in the
U.S.d between 1999 and 2002. In the light of that, the
National Institutes of Health (NIH) held a conference to discuss the risks and benefi ts of cesarean sections40 with the following conclusions:
• there is insuffi cient evidence to assess the risks and
benefi ts of cesarean sections on demand compared
with vaginal delivery; any decision to perform a caesarean section on demand should be made on an individual basis and carefully and ethically contemplated;
• given the risks of placenta previa and placenta accreta (abnormal location and adherence of the placenta in the uterus during pregnancy), a cesarean section on demand is not recommended in women who want many children;
• cesarean on demand should not be performed before
39 weeks of gestation or without confi rmation of
fetal lung maturity.
These conclusions were interpreted as an encourage-ment to “naturalization” of cesarean section and stirred
great controversy among U.S. nursing bodies.27, 30
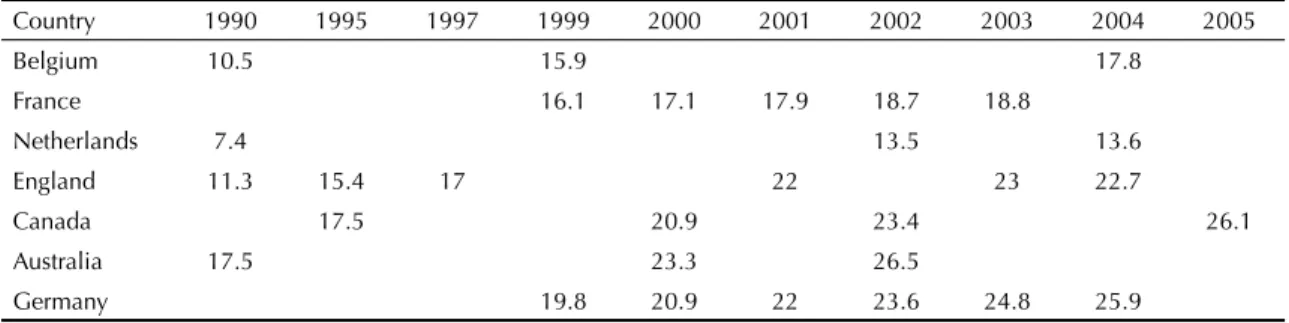
Many European countries have reported high rates of cesarean sections since the 1990s. They have a diversity
of models of care (Table) with specifi c regulations for
midwivese whose autonomy and freedom of action are
not even across Europe.
The Netherlands and Britain are more favorable to midwife care while in Belgium, categorized as having a highly medicalized model according to Wagner,
midwives are still not widely accepted.31
In Belgium, the health system offers fi nancial incentives to encourage obstetricians to provide childbirth care, paying them by procedure. Though it could be provided by licensed midwives, 94% of deliveries are assisted or supervised by obstetricians.31 The cesarean rates are low in Belgium but they have been increasing, from 10.5%
in 1990 to 15.9% in 1999 up to 17.8% in 2004.b
In France, where health care is run by the state, there has been a similar growing, but lower rates. The cesarean rate was 16.1% in 1999 and increased to
18.8% in 2003.f
Among countries with the lowest levels of medical intervention during labor and delivery, the Netherlands stands out among other developed countries. The level of medical interventions is low and about 30% of low-risk woman give birth at home. Obstetric care is provided by midwives; when they suspect there might be childbirth complications, the mother is referred to a hospital. The Dutch model has showed that effec-tive birth care can be provided outside the hospital by midwives.26 Although they are still low, cesarean rates has been rising, from 7.4% in 1990 to 13.5% in 2002,
remaining at 13.6% in 2004.g
Britain, Canada and Germany are among countries with an intermediate model of care, combining extensive use of medical technology and low level of intervention, that been investigating cesarean rates and its causes. Their model of care relies on the involvement of midwives and general practitioners for childbirth care, but home birth is not as common as in the Netherlands. In Britain, cesarean rates increased from 11.3% in 1989–1990 to 15.4% in 1994–1995 and to 17.0% in
1997–1998,h reaching 22% and 23% in 2003–2004.i
This increase can be attributed to the practice of defen-sive medicine due to fear of lawsuits for medical errors,
increasing maternal age,9 and improved socioeconomic
condition of the population.2
Canada has a universal public health system. Childbirth care is provided by doctors and midwives and funded by the government. The cesarean rate was 17.5% in 1995,
rising to 20.9% in 2000 and 23.4% in 2002.38 In 2000,
the Ontario Women’s Health Council, concerned about these increasing rates, established a Cesarean Section Working Group. Twelve critical factors for reducing
these rates were identifi ed, including cultural changes
(reinforcing the idea that vaginal childbirth is physi-ological), multidisciplinary team work and changes in obstetric practices.j
d Health Grades. Number of “patient choice” c-sections rises by 25 percent. Health Grades Study Finds. New York; 2004[cited 2007 Sep 22]. Available from: http://www.healthgrades.com/media/DMS/pdf/PatientChoiceCSectionsRiseJune2004.pdf
e European Parliament European Council. Directive 2005/36/EC of the European Parliament and of the Council of 7 September 2005 on the recognition of professional qualifi cations. Off J Eur Union. 2005 Sept 30[cited 2007 Oct 25]:1-121. Available from: http://eur-lex.europa.eu/ LexUriServ/site/en/oj/2005/l_255/l_25520050930en00220142.pdf
f World Health Organization. World Health Statistics. Paris; 2007[cited 2007 Dec 10]. Available from: http://www.who.int/whosis/ whostat2007.pdf
g World Health Organization. Regional Offi ce for Europe Caesarean section per 1000 live births. European health for all database (HFA-DB). Copenhagen; 2006[cited 2009 Oct 31]. Available from: http://www.inisphoedata.ie/phis/indicators/tables.php?resID=855
h Scotland. Department of Health. Why mothers die. Report on confi dential enquires into maternal deaths in the United Kingdom, 1997-1999. Edinburgh; 2001. [cited 2007 Feb 10]. Available from: http://homepages.ed.ac.uk/asb/SHOA2/confi dential_enquiries.htm
i Scotland. Department of Health. Government Statistical Service, 2005. NHS Maternity Statistics, England: 2003-2004. Edinburgh; 2005[cited 2009 Sep 22]. Available from: http://www.dh.gov.uk/en/Publicationsandstatistics/Publications/PublicationsStatistics/DH_4107060 (Statistical Bulletin, 2005/10).
Cesarean rates in Germany has increased, from 19.8%
in 1999, to 20.9% in 2000 and reaching 25.9% in 2004.b
An economically developed country, Germany has a health system supported by the state through assess-ment funds (sick funds) that provide health insurance to the population. Financing and provision of health services are based on contracts between sick funds and organizations of health care providers.
The Brazilian model of childbirth care
Brazil has showed increasingly high cesarean rates over recent years: from 38.9% in 2000 to 46.5% in 2007. Preliminary data for 2008 show a rate of 48.4% (Figure 2).k
In the Brazilian model childbirth care is defi ned as a
technological or medical event, where pregnant women are treated as patients and births are mostly in-hospital
assisted by doctors.14 Hotimsky et al24 identifi ed that cesarean rates have been strongly determined by the organization of obstetric care in both public and private health system, where there are two distinct scenarios with individual models of childcare.
A small proportion of the population (25.9%) has
private health insurancel and may choose medical
providers and negotiate with them the desired form of care. These clients, supported by the Supplementary Health Care System or who pay out-of-pocket, is generally assisted by the same doctor during prenatal and childbirth care and have a close doctor-patient relationship. In private practice the same physi-cian provides thorough prenatal and childbirth care.
However, Hotimsky et al24 points to the burden on
obstetricians including long working hours including a private practice, shifts in public hospitals, delivery
k Brazilian Ministry of Health. SUS Department of Information Technology Health Information. Brasília; 2008 [cited 2009 Nov 10]. Available from: www.datasus.gov.br
l Instituto Brasileiro de Geografi a e Estatística. Pesquisa Nacional por Amostra de Domicílios 2003. Rio de Janeiro; 2003 [cited 2008 Apr 9]. Available from: http://www.ibge.gov.br/home/estatistica/populacao/trabalhoerendimento/pnad2008/default.shtm
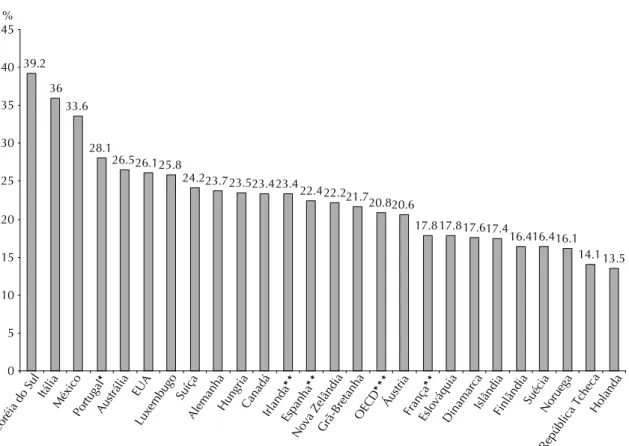
Source: Adapted from Organization for Economic Cooperation and Development. Health at a Glance. OECD Indicators 2005. Paris; 2005.
Notes:
* For Portugal, only births in public hospitals are included, so the results may be overestimated.
* *2001 Data.
* * * The OECD data are averages of the leading countries in this group
Figure 1. Proportion of cesareans per 100 live births. Organization for Economic Cooperation and Development of European Countries, 2005.
39.2
36 33.6
28.1
26.526.125.8
24.223.723.523.423.4
22.422.221.720.820.6
17.817.817.617.4
16.416.416.1 14.113.5
0 5 10 15 20 25 30 35 40 45%
Coréia do Sul Itália
México Portugal
*
Austrália EUA
Luxembugo Suíça
AlemanhaHungria CanadáIrlanda
**
Espanha
**
Nova ZelândiaGrã-Bretanha OECD
***
Áustria França
**
EslováquiaDinamarcaIslândiaFinlândia Suécia
Noruega
care in private hospitals and sometimes teaching and research, and no time available to wait for regular labor, making them opt for cesarean delivery. Care is paid by the patient, either out-of-pocket or through private insurance. The model of private medical care is based on a close doctor-patient relationship, where the patient can choose her medical provider and opt for an elective cesarean section so that she will be assisted by this same
provider.21 These patients are unwilling to accept care
from other providers and demand to be assisted by their
own doctor during childbirth.b
However, most Brazilian population is served by the state-run Sistema Único de Saúde (SUS – National Health System), which provides outpatient and hospital
care in public services. Hotimsky et al24 assert that
pregnant women with no health insurance or no access to private services often do not have the option of choosing the doctor who will assist them and are not likely to have the power to negotiate the type of delivery desired. These patients are routinely assisted during childbirth by a medical provider other than the one providing prenatal care. This lack of continuity between prenatal and childbirth care in the public service can be a contributing factor for cesarean sections due to lack of information at the time of delivery on the current and previous pregnancies. In addition, the provider
on duty at SUS-affi liated hospitals does not establish
a proper relationship with the woman in labor as they
have not met before.24 There are reports that in some
public hospitals, a woman should not be in labor from one shift to another, and all cases have to be “fully
managed” during the same shift.m
The increase in cesarean rates in Brazil predominantly from 1970s points to the importance of identifying and studying factors associated with the choice of type of birth delivery. There are several actors and stakeholders in the chain of delivery care infl uencing the entire health care process. These actors and stakeholders, including physicians, patients and insurers (health insurance for patients and professional liability insurance for
physicians for medical malpractice), hospitals and the government, through health policies, determine the utilization of medical procedures, and there is a need to identify the each actor/stakeholder’s motivation and its effect on utilization.41
In the private health care system, some issues char-acteristic of metropolitan areas and large urban cities of Brazil have made the doctor-patient relationship
more complex and confl icted with health insurance
companies mediating the contractual relationship between client and doctor, greater involvement of civil society through movements toward empowerment and human rights advocacy and greater access of clients to information.
Access to information has increased worldwide, and in Brazil it has led to changes in health care decisions. Before, patients with symptoms would seek a doctor who would establish a diagnosis and recommend a treatment. Patients would accept this advice without further questioning and the decisions were made by the medical team only. In contrast, nowadays, during the
m Freitas PF. The epidemic of caesarean sections in Brazil, factors infl uencing type of delivery in Florianópolis, South Brazil. [doctoral thesis]. London: London School of Hygiene and Tropical Medicine; 1999.
60.00
50.00
40.00
30.00
20.00
10.00
0.00
2000 2001 2002 2003 2004 2005 2006 2007 2008*
Figure 2. Proportion of cesarean sections per 100 live births. Brazil, 2000–2008.
Source: DATASUS
(Brazilian National Health System Database)
Note: * 2008 Preliminary data.
Table. Proportion of cesarean sections per 100 live births in selected countries. 1990–2005.
Country 1990 1995 1997 1999 2000 2001 2002 2003 2004 2005
Belgium 10.5 15.9 17.8
France 16.1 17.1 17.9 18.7 18.8
Netherlands 7.4 13.5 13.6
England 11.3 15.4 17 22 23 22.7
Canada 17.5 20.9 23.4 26.1
Australia 17.5 23.3 26.5
Germany 19.8 20.9 22 23.6 24.8 25.9
fi rst prenatal visit, doctor and patient usually discuss a birth planning, including preferences for anesthesia, episiotomy, forceps, cesarean section, breastfeeding and other aspects relevant to the client, who has now access to this information.4
Currently, almost 25% of births in Brazil take place in private hospital settings, and the cesarean rate in the
private health system is around 80%.n In the public
system that provides care to the majority of the
popula-tion, cesarean rates are on average around 35%.o In the
public system birth deliveries are assisted by doctors on duty who do not have any prior relationship with the patients and in most cases are paid regardless the number and type of deliveries performed. This duality of health systems in Brazil is translated by a wide regional disparity in cesarean rates. Regions with high insurance coverage have also higher cesarean rates. In 2006, cesarean rates in the North and Northeast regions were 34.6% and 33.8% whereas in the Central-West, Southeast and South they were 50.6%, 53.1% and 51.3%, respectively.o Private health insurance coverage in the North and Northeast was 38.2% and 37.3% while in the Central-West, Southeast and South was 53.3%,
54.4% and 53%, respectively.p
Despite different realities, both models of care show very high cesarean rates. Brazil has one of the highest rates worldwide. It should be noted that, in the public sector, although care is mostly provided by doctors, this model is similar to that of many European coun-tries, birth deliveries are assisted by a medical provider contracted by the hospital and paid per load work rather than for productivity (except in some cases). Despite this similarity, cesarean rates in Brazil are not even close
to those in European countries. Dias & Deslandes12
highlight the paradox between cesarean rates in public services in Rio de Janeiro (Southeastern Brazil) and the organization of obstetric care in that system. Maternity hospital costs are covered by the state and providers’ pay does not vary according to what type of delivery is performed. Providers work in teams where it is expected that technical limitations of one member can be counterbalanced by the expertise of another one, thus reducing the odds of choosing not to perform a vaginal delivery due to training limitations. And time of labor progression is not a pressing issue to accelerate delivery since providers work in shifts, with fi xed hours,
and patient care is taken up by a new team at the end of their shift. These authors have postulated that public maternity hospitals have higher than expected cesarean rates because the indications for cesarean deliveries are affected by factors related to medical training and cultural trends, which are highly complex issues in the obstetric practice.12
FINAL CONSIDERATIONS
Cesarean rates have been increasing worldwide since
the 1980s–1990s. A signifi cant number of academic
and nonacademic studies on the subject have been
published, examining it from different perspectives.1,
5,9,39 These studies rely on local contextualization and are based on the model of obstetric care and social and cultural characteristics of women assisted.
It would be simplistic, as reported in some papers, to explain the high cesarean rates as a result of medical decision only, disregarding factors related to the doctor-patient relationship, social context and current model of care, either public or private.36 Therefore, the study of cesarean rates from an perspective calls for a socioeco-nomic and cultural contextualization of the population studied with an analysis of the role of all stakeholders
in the chain of care. D’Orsi et al15 point to the need
to reexamine the organization of obstetric practice to promote changes in childbirth care, respecting the female physiology and the role of stakeholders.
There is no clear evidence on the optimal cesarean rates. Many countries have higher rates than those recommended by WHO 25 years ago. However, a “good birth,” either vaginal or cesarean, should ensure
the mother’s and her child’s well-being.37 Decisions
regarding the type of delivery should take into consid-eration the women’s preferences, provided that they are able to freely choose what best suits them. Furthermore, the analyses of cesarean rates should be based on the model of care in place and social and cultural charac-teristics of a given society. And it should be stressed that the model of obstetric care defi ned by a particular country, state, region or funding entity, comprising, among others, the doctor-patient relationship, economic incentives and utilization of medical technology, greatly infl uence cesarean rates.
n Brazilian National Agency for Supplementary Health Care. Brasil tem uma das maiores taxas de cesariana na Saúde Suplementar. Brasília; 2006 [cited 2007 Mar 25]. Available from: http://www.ans.gov.br/portal/site/home2/destaque_22585_2.asp
o Ministério da Saúde. MS capacita profi ssionais para atender mães e bebês. Brasília; 2009. [cited 2009 Jun 5]. Available from: http://portal.saude. gov.br/portal/aplicacoes/noticias/default.cfm?pg=dspDetalheNoticia&id_area=124&CO_NOTICIA=10229
1. Al-Mufti R, Mccarthy A, Fisk NM. Survey of obstetricians’ personal preference and discretionary
practice. Eur J Obstet Gynecol Reprod Biol.
1997;73(1):1-4. DOI:10.1016/S0301-2115(96)02692-9
2. Alves B, Sheikh A. Investigating the relationship
between affl uence and elective caesarean sections. Br J
Obstet Gynaecol. 2005;112(7):994-6.
3. American Congress of Obstetricians and Gynecologists Committee on Ethics. ACOG Committee Opinion #321: Maternal decision making, ethics, and the law.
Obstet Gynecol. 2005;106(5Pt1):1127-37.
4. American College of Obstetricians and Gynecologists Committee Opinion. Surgery and patient choice:
the ethics of decision making. Obstet Gynecol.
2003;102(5Pt 1):1101-6. DOI:10.1016/j. obstetgynecol.2003.09.030
5. Barbosa GP, Giffi n K, Ângulo-Tuesta A, Gama AS, Chor D, D’orsi E, et al. Parto cesáreo: Quem
o deseja? Em quais circunstâncias? Cad Saude
Publica. 2003;19(6):1611-20.
DOI:10.1590/S0102-311X2003000600006
6. Barros FC, Vaugham JP, Victora CG. Why so many caesarean sections? The need for a further policy
change in Brazil. Health Policy Plan. 1986;1(1):19-29.
DOI:10.1093/heapol/1.1.19
7. Bergholt T, Ostberg B, Legarth J, Weber T. Danish obstetricians’ personal preference and general attitude to elective cesarean section on maternal request: a
nation-wide postal survey. Acta Obstet Gynecol Scand.
2004;83(3):262-6.
8. Bost BW. Cesarean delivery on demand: what will it
cost? Am J Obstet Gynecol. 2003;188(6):1418-23.
DOI:10.1067/mob.2003.455
9. Caesarean section on the rise. Lancet.
2000;356(9423):1697. DOI:10.1016/S0140-6736(00)03196-2
10. Chandraharan E, Arulkumaran S.
Medico-legal problems in obstetrics. Curr Obstet
Gynaecol. 2006;16(4):206-10. DOI:10.1016/j.
curobgyn.2006.05.003
11. Centers for Disease Control and Prevention. National Vital Statistics System. Birth Data 2007. Disponível em http://www.cdc.gov/nchs/births.htm.
12. Dias MAB, Deslandes SF. Cesarianas: percepção de risco e sua indicação pelo obstetra em uma
maternidade pública no Município de São Paulo. Cad
Saude Publica. 2004;20(1):109-16. DOI:10.1590/
S0102-311X2004000100025
13. Diniz CSG. Humanização da assistência ao parto no
Brasil: os muitos sentidos de um movimento. Cienc
Saude Coletiva. 2005;10(3):627-37. DOI: 10.1590/
S1413-81232005000300019
14. Domingues RMS, Santos EM, Leal MC. Aspectos da satisfação das mulheres com assistência ao parto:
contribuição para o debate. Cad Saude Publica.
2004;20Suppl1:S52-62. DOI:10.1590/S0102-311X2004000700006
15. D’orsi E, Chor D, Giffi n K, Ângulo-Tuesta A, Barbosa GP, Gama AS, et al. Qualidade da atenção ao parto
em maternidades do Rio de Janeiro. Rev Saude
Publica. 2005;39(4):646-54.
DOI:10.1590/S0034-89102005000400020
16. Dumond A, de Bernis L, Bouvier-Colle MH, Bréart G. Caesarean section rate for maternal indication in
sub-Saharan Africa: a systematic review. Lancet 2001; 358:
1328–334.
17. Faúndes A, Pádua KS, Osis MJD, Cecatti JG, Souza MH. Opinião de mulheres e médicos brasileiros
sobre a preferência pela via de parto. Rev Saude
Publica. 2004;38(4):488-94. DOI:
10.1590/S0034-89102004000400002
18. Feldman GB, Freiman JA. Prophylactic cesarean
at term? N Engl J Med. 1985;312(19):1264-7.
DOI:10.1056/NEJM198505093121926
19. Flamm BL. 2004 C-section rate is all-time U.S. high at 29%: medical, legal, and choice issues combine.
Obstet Gynecol News. 2004;40:1-3.
20. Freitas PF, Drachler ML, Leite JCC, Grassi PR. Desigualdade social nas taxas de cesariana em
primíparas no Rio Grande do Sul. Rev Saude
Publica. 2005;39(5):761-7.
DOI:10.1590/S0034-89102005000500010
21. Gomes UA, Silva AM, Bettiol H, Barbieri MA. Risk factors for the increasing cesarean section rate in Southeast Brazil: a comparison of two birth cohorts,
1978-1979 and 1994. Int J Epidemiol.
1999;28(4):687-94. DOI:10.1093/ije/28.4.687
22. Grant D. Explaining source of payment differences in U.S. cesarean rates: why do privately insured mothers receive more cesareans than mothers who are not
privately insured? Health Care Manag Sci.
2005;8(1):5-17. DOI:10.1007/s10729-005-5212-7\
23. Hamilton BE, Martin JA,Ventura SJ. National Vital
Statistics Report. Births: data for 2007. Natl Vital Stat
Rep. 2007;57(12):1-23.
24. Hotimsky SN, Rattner D, Venancio SI, Bogus CM, Miranda MM. O parto como eu vejo... ou como eu o desejo? Expectativas de gestantes, usuárias do SUS,
acerca do parto e da assistência obstétrica. Cad Saude
Publica. 2002;18(5):1303-11.
DOI:10.1590/S0102-311X2002000500023
25. International Federation of Gynecology and Obstetrics. FIGO Committee for the Ethical Aspects of Human
Reproduction and Women’s Health. J Obstet Gynecol
Res. 1999;25(4):5-9.
26. Kwee A, Cohlen BJ, Kahnai HH, Bruinse HW, Visser GH. Caesarean section on request: a survey in the
Netherlands. Eur J Obstet Gynecol Reprod Biol. 2004;
113(2):186-90. DOI:10.1016/j.ejogrb.2003.09.017 27. Leeman ML, Plante LA. Patient-choice vaginal delivery?
Ann Fam Med. 2006;4(3): 265-8. DOI:10.1370/
afm.537
28. Lurie S, Glezerman M. The history of cesarean
technique. Am J Obstet Gynecol. 2003; 189(6):1803-6.
29. Lurie S. The changing motives of cesarean section:
from the ancient world to the twenty-fi rst century. Arch
Gynecol Obstet. 2005;271(4):281-5. DOI:10.1007/
s00404-005-0724-4
30. McCandlish R. Meeting maternal request for caesarean
section: paving the road to hell? Midwifery. 2006;
22(3):204-6. DOI:10.1016/j.midw.2006.06.002 31. Mead M, Bogaerts A, Reyns M. Midwives’ perception
of the intrapartum risk of healthy nulliparae in spontaneous labour, in the Flanders, Belgium.
Midwifery. 2007;23(4):361-71. DOI:10.1016/j.
midw.2006.05.003. 2006.
32. Menacker F, Curtin SC. Trends in cesarean birth and
vaginal birth after previous cesarean, 1991-99. Natl
Vital Stat Rep. 2001;49(13):1-15.
33. Menacker F, Declercq E, Macdorman MF. Cesarean delivery: background, trends and epidemiology.
Semin Perinatol. 2006;30(5):235-41. DOI:10.1053/j.
semperi.2006.07.002
34. Mendoza-Sassi RA, Cesar JA, Silva PR, Denardin G, Rodrigues MM. Risk factors for cesarean
section by category of health service. Rev Saude
Publica. 2010;44(1):80-9.
DOI:10.1590/S0034-89102010000100009
35. Okonofua F. Optimising caesarean-section rates
in west Africa. Lancet. 2001; 358(9290):1289.
DOI:10.1016/S0140-6736(01)06456-X
36. Osis MJD, Padua KS, Duarte GA, Souza TR, Faúndes A. The opinion of Brazilian women regarding vaginal
labor and cesarean section. Int J Gynecol Obstet.
2001;75(Supll 1):S59-66. DOI:10.1016/S0020-7292(01)00518-5
37. Rezende J. Operação cesariana. Rio de Janeiro: Guanabara Koogan; 1969. Obstetrícia; p.952-91. 38. Robson SJ, Tan WS, Adeyemi A, Dear KB. Estimating
the rate of cesarean section by maternal request: anonymous survey of obstetricians in Australia.
Birth. 2009;36(3):208-12.
DOI:10.1111/j.1523-536X.2009.00331.x
39. Shearer EL. Cesarean section: medical benefi ts
and costs. Soc Sci Med. 1983;37(10): 1223-31.
DOI:10.1016/0277-9536(93)90334-Z
40. State-of-the-Science Conference Statement on cesarean
delivery on maternal request. NIH Consens State Sci
Statements. 2006;23(1):1-29.
41. Turcotte L, Robst J, Polachek S. Medicaid coverage and
medical interventions during pregnancy. Int J Health
Care Finan Econ. 2005;5(3):255-71. DOI:10.1007/
s10754-005-1789-0
42. Wagner M. Choosing caesarean section. Lancet.
2000;356(9242):1677-80. DOI:10.1016/S0140-6736(00)03169-X
43. Wagner M. Fish can’t see water. The need to humanize
birth. Int J Gynecol Obstet. 2001; 75Suppl 1:S25-37.
DOI:10.1016/S0020-7292(01)00519-7
44. World Health Organization. Appropriate technology
for birth. Lancet. 1985; 2(8452):436-7.
Article based on the doctoral thesis by Patah LEM presented to the School of Business Administration of Sao Paulo at Fundação Getúlio Vargas in 2008.