OR
IGI
N
A
L
R
E
S
E
A
R
C
H
Corresponding address: Paula S. C. Chagas – Faculdade de Fisioterapia, UFJF – Rua Eugênio do Nascimento, S/N, Bairro Dom Bosco – Juiz de Fora (MG), Brasil – Zip Code: 36038-330 – Phone: +55 (32) 21023843 – Email: [email protected] – Financing source: FAPEMIG e PROPESQ/UFJF– Conlict of interests: Nothing to declare – Presentation: Oct. 2016 – Accepted for publication: Feb. 2017 – Approved by the Ethics Committee 1.402.580.
1Doctor in Rehabilitation Sciences, Professor at Faculdade de Fisioterapia, Department of Cardiorespiratory and Musculoskeletal Physical Therapy, Universidade Federal de Juiz de Fora (UFJF) – Juiz de Fora (MG), Brazil.
2Physical therapist, Graduated in Physical Therapy from Universidade Federal de Juiz de Fora (UFJF) – Juiz de Fora (MG), Brazil. 3Master’s in Collective Health, Professor of Physical Therapy, Department of Physical Therapy, Universidade Federal de Juiz de Fora (UFJF) – Governador Valadares (MG), Brazil.
4Master’s in Collective Health, Professor at Faculdade de Fisioterapia, Department of Physical Therapy of Older Adults, Adults and Maternal-Child, Universidade Federal de Juiz de Fora (UFJF) – Juiz de Fora (MG), Brazil.
5Doctor in Rehabilitation Sciences, Professor at Faculdade de Fisioterapia, Department of Physical Therapy of Elderly, Adults and Maternal and Infant, Universidade Federal de Juiz de Fora (UFJF) – Juiz de Fora (MG), Brazil.
ABSTRACT | Plantar pressure is used in clinical evaluation of the feet and informs about characteristics of the plantar load distribution during functional activity. Many evaluation instruments are used and its measurements properties must be tested. Test-retest reliability is a measure which informs about reproducibility. The objective of this study was to analyze test-retest reliability of maximum pressure measurements during static and dynamic in children and youths with normal development (ND). Eleven children and youths with ND of both sexes, with mean age between 6 and 17 years old, were evaluated twice in a weight bearing platform in orthostatic posture, barefooted and with their usual footwear, when the feet were positioned spontaneously (interrupted step) and the feet were aligned. Intraclass correlation coeicients (ICC) were analyzed (α=0.05). ICC were consistent for: anterior barefoot weight bearing (ICC=0.83) and posterior barefoot weight bearing (ICC=0.95) and with footwear (ICC=0.83), during the static analysis with interrupted step. They were also consistent for the variable static weight bearing of the right lower limb (ICC=0.86) and left lower limb (ICC=0.82) barefooted with interrupted step, and with footwear with the feet aligned (ICC=0.82). In the left lower limb analysis with footwear, the maximum pressure also showed a satisfactory result
46
(ICC=0.85). Other variables showed ICC variation between 0.25 and 0.74, considered unsatisfactory. The conclusions are that test-retest ICC were considered excellent for some static conditions, and inconsistent in the dynamic evaluation.
Keywords | Child; Adolescent; Data Accuracy; Pressure; Foot.
RESUMO | A pressão plantar é utilizada na avaliação clínica do pé e informa características da distribuição de carga plantar em atividades funcionais. Diversos instrumentos de avaliação podem ser utilizados e devem ter as propriedades psicométricas analisadas. A coniabilidade teste-reteste é uma medida de reprodutibilidade. O objetivo deste estudo foi analisar a coniabilidade teste-reteste das medidas de pressão máxima na estática e dinâmica de crianças e adolescentes com desenvolvimento normal (DN). Onze crianças e adolescentes com DN, de ambos os sexos, com idade entre 6 e 17 anos foram avaliados duas vezes, em uma plataforma sensível à pressão plantar em ortostatismo, com e sem calçado usual, com os pés posicionados de forma livre (passo interrompido) e com os pés alinhados. Dados dinâmicos foram obtidos pela caminhada sobre a plataforma com e sem calçado. Coeicientes de correlação intraclasse (CCI) foram analisados (α=0,05). Os CCI foram consistentes para: descarga de peso (DP) anterior calçado (CCI=0,83) e
Reliability analysis of static and dynamic plantar
pressure measurements of children and youths with
normal development
Análise de coniabilidade de medidas das press
ões
plantares estática e dinâmica de crianças e
adolescentes com desenvolvimento normal
El análisis de la exactitud de las medidas de las presiones plantares estática y dinámica de niños y
adolescentes con desarrollo normal
Jennifer Granja Peixoto
1, Alessandra Germano Dias
2, Laís Maini Miranda
2,
Érica Cesário Defilipo
3,
DP posterior descalço (CCI=0,95) e calçado (CCI=0,83) durante a análise estática com o passo interrompido. Também foram consistentes para a variável DP estática do membro inferior (MI) direito (CCI=0,86) e esquerdo (CCI=0,82) com passo interrompido descalço e, com os pés alinhados, utilizando calçados (CCI=0,82). Na análise do MI esquerdo, com o uso de calçado, a variável pressão máxima também gerou resultado satisfatório (CCI=0,85). As demais variáveis apresentaram variação de CCI entre 0,25 e 0,74, consideradas insatisfatórias. Conclui-se que os valores de CCI foram considerados excelentes para algumas condições estáticas e inconsistentes na avaliação dinâmica.
Descritores | Criança; Adolescente; Coniabilidade dos Dados; Pé.
RESUMEN | Se emplea la presión plantar para examinar clínicamente el pie ya que ofrece información sobre las características de distribución del peso plantar en actividades funcionales. Hay varios instrumentos de evaluación que pueden ser utilizados y que se deben de analizar sus propiedades psicométricas. La exactitud prueba-reprueba es una medida de reproducibilidad. El propósito de este estudio es evaluar la exactitud prueba-reprueba de las medidas de presión plantar máxima en la estática y dinámica de niños y adolescentes con
desarrollo normal (DN). Se evaluaron dos veces a once niños y adolescentes con DN, de ambos géneros, entre 6 y 17 años de edad, utilizando una plataforma sensible a la presión plantar en ortostatismo, con y sin los zapatos habituales, con los pies posicionados de manera libre (marcha interrumpida) y con los pies alienados. Se recolectaron datos dinámicos por intermedio de caminata sobre la plataforma con y sin zapatos. Se evaluaron los coeicientes de correlación intraclase –CCI (α=0,05). Los CCI fueron consistentes para: descarga del peso (DP) anterior del zapato (CCI=0,83) y DP posterior sin zapato (CCI=0,95) y con zapato (CCI=0,83) durante el análisis estático con la marcha interrumpida. También fueron consistentes para la variable DP estática del miembro inferior (MI) derecho (CCI=0,86) e izquierdo (CCI=0,82) con la marcha interrumpida sin zapato y, con los pies alienados, con el uso de zapatos (CCI=0,82). En el análisis del MI izquierdo, con el uso de zapato, la variable de la presión máxima también presentó un buen resultado (CCI=0,85). La CCI osciló en las demás variables entre 0,25 y 0,74, consideradas insatisfactorias. Se concluye que los valores de CCI fueron excelentes para algunas condiciones estáticas e inconsistentes en la evaluación dinámica.
Palabras clave | Niño; Adolescente; Exactitud de los Datos; Pie.
INTRODUCTION
Plantar pressure analysis is used for the clinical
assessment of the foot and reports on characteristics of
the plantar load distribution during the performance
of functional activities
1. he distribution of weight
discharge and maximum pressure underfoot may
be inluenced by changes in the development of
children and youths. hese variables can be used to
study the motor function of the lower limbs and thus
contribute to the determination of more speciic
therapeutic objectives and to improve the quality of
the treatment ofered
2.
Literature reports diferent systems for assessing
static plantar loading
2-9and dynamics
1,5-8,10-19in
children and youths. However, information about
test-retest reliability is infrequent
1,20. his, in turn,
weakens the extrapolation of the results, given the
internal validity failure, generating doubt about
the reliability of the evaluator in using a speciic
instrument. herefore, the data obtained can be
attributed to the actual characteristics of the sample
or to the failure of the evaluation process
1.
Reliability is deined as a measure of consistency
of data on relative levels of performance between
raters, regardless of the absolute value of each
rater’s classiication
21. It is related to the consistency
and precision of the results of the measurement
process
22. It is important to assess the reliability
of the decisions taken by observers to know what
measures are being taken
23.
he intraclass correlation coeicient (ICC) is
the statistical tool most commonly used to measure
the reliability of measures
23. It is suitable to measure
the homogeneity of two or more quantities and is
interpreted as the proportion of the total variability
attributed to the measured object
23. ICC consists of
the number of times the evaluators agree, divided
by the total number of evaluations and ranges from
0 to 100%
23.
METHODOLOGY
Participants
In this methodological study were included
children and youths with normal development, of
both sexes, aged between six and 17 years, who did
not perform bone and / or muscular surgery in the
lower limbs in the last year and who were able to
understand simple orders such as verbal commands
to perform body adjustments by maintaining
orthostatic posture or walking on the platform.
Volunteers and guardians were guided regarding
the objectives and characteristics of this study and
were asked to sign the Informed Consent Form
and, when applicable, the authorization term for
image use. he research project was approved
by the Research Ethics Committee of Hospital
Universitário of Universidade Federal de Juiz de
Fora (UFJF), under opinion no. 1.402.580.
Demographic, Clinical and Anthropometric Data
he volunteers of this study were evaluated in a
room of the Faculdade de Enfermagem of UFJF.
Initially, anthropometric data and lower limb length
were collected. he last variable was measured in the
orthostatic posture, from the greater trochanter to
the ground
24, by a trained evaluator with adequate
test-retest reliability (ICC=0.93).
Instruments and procedures
Instrument
For the evaluation of the weight discharge,
M.P.S. Platform® (Pressure Modular System –
LorAnEngineering, Bologna, Italy) was used, which
is a plantar pressure sensitive platform that captures
information on gait and weight discharge. he platform
was connected to a computer with the FootChecker®
4.0 software to analyze the variables of static weight
discharge and dynamics of interest
25.
Procedures
Volunteers were evaluated regarding static and
dynamic weight discharge with and without the
usual footwear. In addition, in the static collections,
the volunteers were evaluated with their feet freely
positioned (when they stopped walking).and with their
feet aligned in relation to the acromion
24.
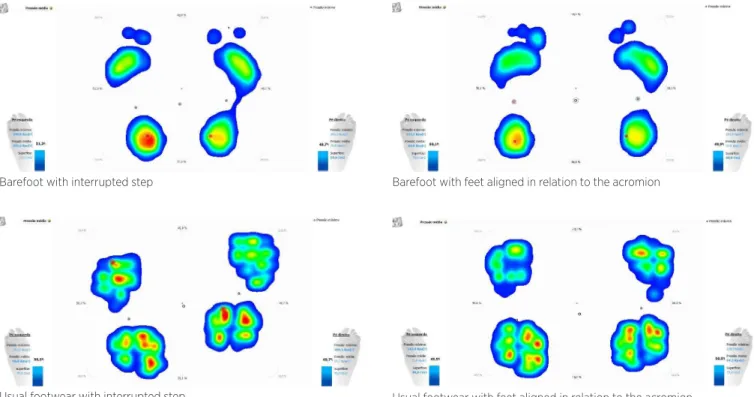
Figure 1. Weight discharge data captured by the platform during the static analysis with the step interrupted and with the feet aligned with the acromion with and without the use of usual footwear
Source: Authors (2016)
Barefoot with interrupted step
To evaluate the static weight discharge with
interrupted step, volunteers were asked to walk naturally
and stop at the beginning of the platform with the feet
parallel (Figure 1). hen, the evaluator aligned the feet
of the volunteers in relation to the acromion (Figure 1).
In both positions, volunteers were asked to remain for
15 seconds on the platform, with horizontal gaze and
upper limbs along the body.
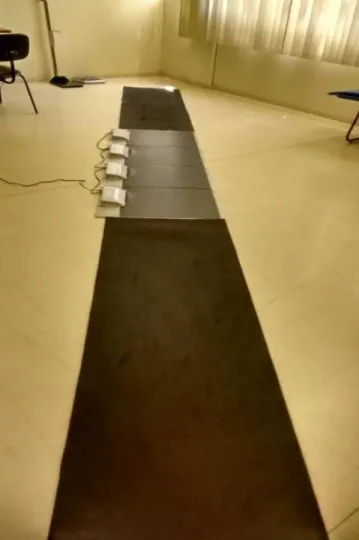
In the analysis of dynamic weight discharge, to allow
the initial acceleration and the terminal deceleration
were made markings on the ground two meters before
the edges of the platform, totaling six meters of total
track. However, to ensure that the transition from the
irst step from the acceleration area to the platform
and to that the deceleration area was smooth, a rubber
with 0.5 mm thickness and the same color than the
platform was aixed in such a way that the carpet
became fully lat and did not demarcate transition
areas (Figure 2).
Figure 2. M.P.S. Platform® with rubberized mat aixed to the loor
Volunteers were asked to walk uninterruptedly,
keeping their eyes horizontal. he procedure was
repeated until totaling 30 meters per individual. Before
that, a pretest with two replications was performed to
familiarize the equipment.
Data were obtained in two distinct moments, with
interval of not less than seven days, by two trained and
experienced evaluators. Verbal commands and body
adjustments were always performed by the irst evaluator.
Data were recorded and analyzed by a second evaluator.
Statistical analysis
Descriptive statistics of the anthropometric and
demographic variables and the distribution tests of
normality of Shapiro-Wilk of the outcome variables
were performed. Next, we performed ICC tests in the
statistical program SPSS 15.0 (
α
= 0.05). Satisfactory
ICCs equal to or greater than 75% were considered,
which is the minimum acceptable agreement
26.
RESULTS
Sixteen children and/or youths participated in this
study, but due to errors in the software, analyzable data
were only collected from 11 volunteers. Descriptive
information, with mean and standard deviation (SD)
can be visualized in Table 1.
Table 1. Demographic and anthropometric data (n=11)
Variables Average ± Standard Deviation Minimum-Maximum
Age (years) 10.73±3.29 7.00–17.00
Weight (Kilograms) 37.53±16.73 18.50–71.20 4 (100%)
Height (meters) 1.41±0.18 1.18–1.67 42 (100%)
BMI (kg/m2) 17.77±3.84 13.00–26.50 46 (100%)
Dysmetria of LL (cm) 0.18±0.34 0.00–1.00
Caption: BMI: Body mass index; Kg = kilograms; M²: square meters; LL: lower limbs; Cm: centimeters; Dysmetria: diference in length between limbs
Table 2. Test-retest of static analysis (n=11)
STATIC VARIABLES FIRST ASSESSMENT Average
± SD SME
SECOND ASSESSMENT Average
± SD SME ICC
Previous weight discharge
Barefoot IS 41.93±14.69 3.28 45.91±12.28 2.75 0.74
AF 37.99±15.04 11.75 42.70±9.03 7.05 0.67
Footwear IS 44.12±10.56 4.35 45.19±12.77 5.26 0.83*
AF 43.52±12.04 9.41 41.15±14.06 5.60 0.39
Posterior weight discharge
Barefoot IS 58.07±14.69 3.28 54.09±12.28 2.75 0.95*
AF 62.01±15.04 8.64 57.30±9.03 5.19 0.67
Footwear IS 55.88±10.56 4.35 54.81±12.77 5.26 0.83*
AF 56.48±12.04 9.41 55.21±7.17 5.60 0.39
Right lower limb barefoot
IS MP 189.75±32.75 25.15 174.14±17.69 13.59 0.41
Weight discharge 49.77±4.28 1.60 52.67±3.63 1.36 0.86*
AF MP 202.10±35.44 19.41 185.59±42.20 15.15 0.70
Weight discharge 51.01±4.65 2.86 50.78±2.75 1.69 0.62
Left lower limb barefoot
IS MP 199.67±32.88 16.76 185.17±42.20 21.52 0.74
Weight discharge 50.23±4.28 1.81 46.96±3.94 1.67 0.82*
AF MP 219.30±35.69 40.37 186.37±28.81 32.59 −0.28**
Weight discharge 48.99±4.65 2.86 49.22±2.75 1.69 0.62
Right lower limb footwear
IS MP 198.72±33.41 28.94 182.34±46.07 39.90 0.25
Weight discharge 49.47±3.26 4.69 50,88±4.12 5.93 −1.07**
AF MP 194.61±41.79 20.04 183,91±29.64 14.22 0.77**
Weight discharge 51.86±5.64 2.39 51.22±4.36 1.85 0.82*
Left lower limb footwear
IS MP 196.97±41.79 21.31 192.95±59.44 30.31 0.74
Weight discharge 50.53±3.26 4.69 49.12±4.12 5.93 −1.07**
AF MP 188.86±46.35 17.95 179.26±38.46 14.90 0.85*
Weight discharge 48.14±5.64 2.39 48.79±4.36 1.85 0.82*
Caption: SD: Standard Deviation; SME: Standard Measurement Error; ICC: Intraclass Correlation Coeicients; IS: Interrupted Step; AF: Aligned Feet; MP: Maximum Pressure *ICC values considered excellent; ** Negative values due to the negative mean of variance between items that violate the precepts of the reliability model
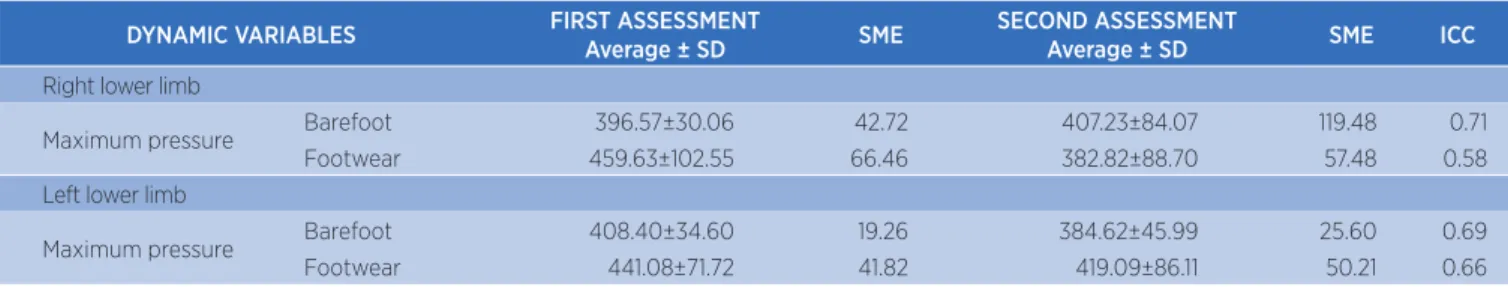
Table 3. Test-retest of the dynamic analysis
DYNAMIC VARIABLES FIRST ASSESSMENT Average ± SD SME SECOND ASSESSMENT Average ± SD SME ICC
Right lower limb
Maximum pressure Barefoot 396.57±30.06 42.72 407.23±84.07 119.48 0.71
Footwear 459.63±102.55 66.46 382.82±88.70 57.48 0.58
Left lower limb
Maximum pressure Barefoot 408.40±34.60 19.26 384.62±45.99 25.60 0.69
Footwear 441.08±71.72 41.82 419.09±86.11 50.21 0.66
DISCUSSION
he aim of this study was to analyze the test-retest
reliability of the measures of maximum pressure and
discharge of weight in the feet during the orthostatic
posture and in the gait of children and youths with
normal development. he results showed inconsistent
reliability values in some conditions and, satisfactorily,
in others.
Values were consistent for the variables discharge of
previous weight footwear and discharge of later weight
with and without the use of footwear. Both measurements
were obtained during the interrupted step. Still in
the static, the results were satisfactory for the variable
discharge of weight of the lower limbs with the step
interrupted with the volunteers barefoot and, with feet
aligned, with the use of footwear. he maximum pressure
variable, obtained with the feet aligned and making
use of footwear also generated a satisfactory result. he
maximum weight and pressure discharge evaluated in
percent, in each lower limb, are mirror variables and,
therefore, the results were complementary.
ICC values for the anterior and posterior weight
discharge variable with the feet aligned were not
consistent. his may be due to an error generated by
the evaluator during alignment or it may mean that
the alignment of the feet to the acromion generated an
internal disturbance in the individual who did not have
the time to adjust. hus, this change in the position
of the feet maybe can cause new posture strategies
to be elaborated, including synergies, patterns of
joint movements, torques and contact force
27,28. If the
individual does not have previous experience with these
speciic adjustments, their instability will be greater
in response to the external disturbance, afecting their
postural control
l28,29.
he weight discharge variable also generated
inadequate ICC values when the feet were aligned in
relation to the acromion, with the volunteers barefoot
and in the interrupted step, making use of footwear.
Although not always satisfactory, ICC values were
better when the feet were aligned in relation to the
acromion and volunteers were using the usual footwear.
his may have occurred due to greater stability
and greater distribution of foot pressures when the
individual is wearing footwear. It is possible that, with
bare feet, volunteers have greater joint instability at the
ankles and therefore take longer to adjust their postural
adjustments, causing the maximum pressure to have a
punctual distribution on the soles of the feet, that is,
more concentrated in certain anatomical points
On the other hand, still in the static analysis, ICC
values were satisfactory only for the variable of maximum
pressure in the lower limbs with the feet aligned by the
acromion and barefoot. As suggested in other studies
1,2,9,
the maximum pressure may travel through diferent
regions of the feet (forefoot, midfoot and hindfoot)
and may also be inluenced by age. hus, it might be
appropriate and more reliable not only to evaluate the
peak pressure, but also where it occurs, always with care
to analyze the sample by age strata, due to the greater
immaturity of postural control in younger children
1,2,9.
Dynamic analysis presented all ICC values
classiied as moderate. Rosenbaum et al
12. analyzed
children with typical development between four and
12 years of age, controlling speed during walking. hey
have shown that normal walking speed inluences
the characteristics of the load underfoot. hus, it
is possible that the great variability of this measure
be a relection of the lack of standardization of gait
velocity, which may have generated ICC values
below desirable. Nevertheless, it is known that there
is an increase in joint stifness with advancing age in
healthy children, which increases the pressures under
the metatarsals, generating constant variations in the
distribution of the pressures observed during gait
10.
Consequently, it is possible that the variability of the
sample age has determined the great variability in the
maximum pressure measurements during gait, since
the measurements performed on volunteers under 13
years tended to be more unstable
1,5.
At the same time, it should be pointed out that the
acquisition of motor skills, mainly in the development
process, can be explained by the perception and action
of the repeated task
19, which may have occurred in the
volunteers when walking on the platform for the second
time. his can generate a learning efect that is a process
of thinning and improving the detected responses.
With this, the individual structures the available actions
to improve and adjust postural adjustments
30.
to return to the beginning of the platform, which made
the evaluation process tiring and time-consuming, and
thus fatigue may have occurred.
In this study, we observed that the test-retest
reliability of the weight-bearing variable between lower
limbs and measurements obtained in the dynamic
analysis was considered inadequate and this can occur
by a variability of the measurement and not by the rater.
CONCLUSION
he test-retest reliability analysis of the variables
maximum pressure and static weight discharge
in children and youths with normal development
presented adequate values for measurements with the
interrupted step and without footwear and when the
feet were aligned to the acromion, when using footwear.
he measurements obtained in the dynamic analysis did
not reach satisfactory levels of intra-examiner reliability.
REFERENCES
1. Cousins SD, Morrison SC, Drechsler WI. The reliability of plantar pressure assessment during barefoot level walking in children aged 7-11 years. J Foot Ankle Res. 2012;5(1):8. doi: 10.1186/1757-1146-5-8.
2. Orlin MN, McPoil TG. Plantar pressure assessment. Phys Ther. 2000;80(4):399-409.
3. Azevedo LA, Nascimento LF. A distribuição da força plantar está associada aos diferentes tipos de pés? Rev Paul Pediatr. 2009;27(3):309-14. doi: 10.1590/ S0103-05822009000300012.
4. Matsuda S, Demura S. Age-related, interindividual, and right/ left diferences in anterior-posterior foot pressure ratio in preschool children. J Physiol Anthropol. 2013;32(1):8. doi: 10.1186/1880-6805-32-8.
5. Mayolas PC, Arrese AL, Aparicio AV, Masià JR. Distribution of plantar pressures during gait in diferent zones of the foot in healthy children: the efects of laterality. Percept Mot Skills. 2015;120(1):159-76. doi: 10.2466/26.10.PMS.120v15x8.
6. Filippin NT, Barbosa VLP, Sacco ICN, Lobo da Costa PH. Efeitos da obesidade na distribuição de pressão plantar em crianças. Rev Bras Fisioter. 2007;11(6):495-501. doi: 10.1590/ S1413-35552007000600012.
7. Becerro-de-Bengoa-Vallejo R, Losa-Iglesias ME, Rodriguez-Sanz D. Static and dynamic plantar pressures in children with and without sever disease: a case-control study. Phys Ther. 2014;94(6):818-26. doi: 10.2522/ptj.20120164.
8. Chang HW, Chieh HF, Lin CJ, Su FC, Tsai MJ. The relationships between foot arch volumes and dynamic plantar pressure during midstance of walking in preschool children. PLoS One. 2014;9(4):e94535. doi: 10.1371/journal.pone.0094535.
9. Yoon SW. Efect of the application of a metatarsal bar on pressure in the metatarsal bones of the foot. J Phys Ther Sci. 2015;27(7):2143-6. doi: 10.1589/jpts.27.2143.
10. Phethean J, Pataky TC, Nester CJ, Findlow AH. A cross-sectional study of age-related changes in plantar pressure distribution between 4 and 7 years: a comparison of regional and pixel-level analyses. Gait Posture. 2014;39(1):154-60. doi: 10.1016/j.gaitpost.2013.06.015.
11. Bosch K, Gerss J, Rosenbaum D. Development of healthy children’s feet: nine-year results of a longitudinal investigation of plantar loading patterns. Gait Posture. 2010;32(4):564-71. doi: 10.1016/j.gaitpost.2010.08.003.
12. Rosenbaum D, Westhues M, Bosch K. Efect of gait speed changes on foot loading characteristics in children. Gait Posture. 2013;38(4):1058-60. doi: 10.1016/j.gaitpost.2013.03.020. 13. Latour E, Latour M, Arlet J, Adach Z, Bohatyrewicz A.
Gait functional assessment: spatio-temporal analysis and classiication of barefoot plantar pressure in a group of 11-12-year-old children. Gait Posture. 2011;34(3):415-20. doi: 10.1016/j.gaitpost.2011.06.013.
14. Alvarez C, De Vera M, Chhina H, Black A. Normative data for the dynamic pedobarographic proiles of children. Gait Posture. 2008;28(2):309-15. doi: 10.1016/j.gaitpost.2008.01.017. 15. Kellis E. Plantar pressure distribution during barefoot
standing, walking and landing in preschool boys. Gait Posture. 2001;14(2):92-7. doi: 10.1016/S0966-6362(01)00129-1.
16. Bosch K, Gerss J, Rosenbaum D. Preliminary normative values for foot loading parameters of the developing child. Gait Posture. 2007;26(2):238-47. doi: 10.1016/j. gaitpost.2006.09.014.
17. Phethean J, Nester C. The inluence of body weight, body mass index and gender on plantar pressures: results of a cross-sectional study of healthy children’s feet. Gait Posture. 2012;36(2):287-90. doi: 10.1016/j.gaitpost.2012.03.012. 18. Morag E, Cavanagh PR. Structural and functional predictors
of regional peak pressures under the foot during walking. J Biomech. 1999;32(4):359-70.
19. Smith LB, Thelen E. Development as a dynamic system. Trends Cogn Sci. 2003;7(8):343-8.
20. Mokkink LB, Terwee CB, Patrick DL, Alonso J, Stratford PW, Knol DL, et al. The COSMIN checklist for assessing the methodological quality of studies on measurement properties of health status measurement instruments: an international Delphi study. Qual Life Res. 2010;19(4):539-49. doi: 10.1007/s11136-010-9606-8.
21. Graham M, Milanowski A, Miller J. Measuring and promoting inter-rater agreement of teacher and principal performance ratings [Internet]. Center for Educator Compesation Reform; 2012 [cited 2017 Mar 21]. Available from: http://iles.eric. ed.gov/fulltext/ED532068.pdf
22. Matos DAS. Coniabilidade e concordância entre juízes: aplicações na área educacional. Est Aval Educac. 2014;25(59):298-324.
23. Shrout PE, Fleiss JL. Intraclass correlations: uses in assessing rater reliability. Psychol Bull. 1979;86(2):420-8.
tilt angle in healthy young women? MTP & Rehab Journal. 2015;13:017. doi: 10.17784/mtprehabjournal.2015.13.251. 25. Zequera ML, Garavito L, Sandham W, Alvarado JA, Rodríguez
Á, Wilches CA, et al. Assessment of the efect of time in the repeatability of the stabilometric parameters in diabetic and non-diabetic subjects during bipedal standing using the LorAn pressure distribution measurement system. Conf Proc IEEE Eng Med Biol Soc. 2011;2011:8531-4. doi: 10.1109/ IEMBS.2011.6092105.
26. Stemler SE. A comparison of consensus, consistency, and measurement approaches to estimating interrater reliability. Practical Assessment, Research & Evaluation. 2004;9(4).
27. Ting LH. Dimensional reduction in sensorimotor systems: a framework for understanding muscle coordination of posture. Prog Brain Res. 2007;165:299-321. doi: 10.1016/ S0079-6123(06)65019-X.
28. Carvalho RL, Almeida GL. Aspectos sensoriais e cognitivos do controle postural. Rev Neurocienc. 2009;17(2):156-60. 29. Horak FB. Postural orientation and equilibrium: what do we
need to know about neural control of balance to prevent falls? Age Ageing. 2006;35(Suppl 2):ii7-ii11. doi: 10.1093/ ageing/al077.