people with mental and behavioral disorders in
Brazil, 2008-2014
doi: 10.5123/S1679-49742017000100005
Abstract
Objective: to analyze the evolution of hospitalizations and hospital mortality of elderly people with mental and behavioral
disorders in Brazil, from 2008 to 2014. Methods: this is a time series ecological study, with data from the Hospital Information
System of the Brazilian National Health System (SIH/SUS), and analyzed through Prais-Winsten regression. Results: during
the studied period, 139,941 hospitalizations and 2,962 deaths were recorded; the hospitalization coefficient for mental and behavioral disorders decreased in Brazil, from 122.3 to 84.2 per 100 thousand inhabitants (-0.14%; 95%CI -0.25;-0.03), and its macroregions, except the South, which presented stationary trend (0.08%; 95%CI -0.11;0.27); the hospital mortality coefficients in Brazil, in 2008 and 2014, were, respectively, 1.73 and 2.38 per 100 thousand inhabitants; dementia was the
main diagnosis in hospitalizations that registered deaths (32.3%). Conclusion: despite the reduction in hospitalization
coefficient for mental and behavioral disorders during the studied period, the hospital mortality coefficient has increased.
Key words: Mental Disorders; Aged; Hospitalization; Unified Health System; Time Series Studies.
Correspondence:
Vanessa Cruz Santos – Universidade Federal da Bahia, Programa de Pós-Graduação em Saúde Coletiva, Instituto de Saúde Coletiva, Rua Basílio da Gama, s/n, Canela, Salvador-BA, Brasil. CEP: 40110-040
E-mail: [email protected]
Vanessa Cruz Santos1
Karla Ferraz dos Anjos2
Rita Narriman Silva de Oliveira Boery3
Ramon Missias Moreira4
Diego Pires Cruz3
Eduardo Nagib Boery3
1Universidade Federal da Bahia, Instituto de Saúde Coletiva, Salvador-BA, Brasil
2Universidade Federal da Bahia, Programa de Pós-Graduação em Enfermagem, Salvador-BA, Brasil
Epidemiol. Serv. Saude, Brasília, 26(1), Jan-Mar 2017
Introduction
The population of elderly people has grown worldwide. According to the United Nations (UN), in 2009, there were 865 million elderly people (≥ 65 years) in the world, which corresponds to 12.3% of the population. In that same year in Brazil, there were approximately 21 million people aged 60 years or over, representing 11.3% of the whole country population.1 Since the
2000s, the top of the age pyramid has widen, and the growth of the participation of individuals aged 65 or over stands out: from 4.8% in 1991, to 5.9% in 2000 and 7.4% of the total Brazilian population in 2010.2
With the increase of life expectancy and birth control, population aging has become a fact, bringing along higher prevalence of chronic-degenerative diseases, such as mental and behavioral disorders.3 According to the 10th
Revision of the International Statistical Classification of Diseases and Related Health Problems (ICD-10), disorder stands for "a recognizable set of symptoms or behaviors clinically associated with suffering and interference with personal functions".
According to the World Health Organization (WHO), the prevalence of mental disorders in the world population in 2011 was of approximately 10.0%, exceeding 25.0% if episodes during lifetime are considered.4 In 2015, 20.0% of individuals aged 60
or over suffered from some mental or neurological illness, being dementia and depression among the most frequent neuropsychiatric disorders.5
In Brazil, a study conducted in São Paulo-SP in 2013 identified prevalence of 29.7% of common mental disorders among elderly people.6 According to another
research carried on in two hospitals of the Brazilian National Health System (SUS), also in São Paulo-SP in 2011, mental and behavioral disorders accounted for 40.3% of hospitalizations, and constituted the first cause of elderly hospitalization in the geriatric hospital and the seventh in the university hospital.7
Elderly people are more likely to develop mental disorders due to several reasons. They are more prone to experiment grief, decline of socioeconomic status after retirement, or some disability. All these factors
may result in isolation, loss of independence, loneliness and psychological suffering.5
The ordinance MS/GM No. 2528, dated 19 October 2006 of the Ministry of Health, which approved the National Health Policy for the Elderly, alludes to the promotion of a healthy and active aging process. Its guidelines describe the need for promoting integrate and inclusive group actions, with mental health assessment, diagnosis and treatment for the elderly.8
The increase of knowledge on the magnitude of mental and behavioral disorders of the Brazilian elderly population is necessary, due to the lack of research on this topic, especially epidemiological.
This study aims to describe the evolution of elderly hospitalizations and hospital mortality due to behavioral and mental disorders in Brazil, in the period from 2008 to 2014.
Methods
This is a time series ecological study, with secondary aggregate data obtained from the National Hospital Information System (SIH/SUS).
The objective of SIH/SUS is to register all medical care originated from hospitalizations funded by the Brazilian National Health System (SUS). Reports are generated so the health managers can forward the payment to the health facilities. Its source-document is the Inpatient Hospital Authorization (IHA). Its average coverage, estimated for the period from 2008 to 2014 is of 6.0%.9
Data were collected from the IT Department of SUS (Datasus), from the Ministry of Health, in July 2015. All the hospitalizations of elderly (people aged 60 or over)10
due to mental and behavioral disorders (F00-F99), which are on chapter V of ICD-10, were included.11
We also included all hospitalizations of elderly people in Brazil, according to place of residence, from 2008 to 2014 – complete years available to access.
The hospitalization coefficient was calculated by dividing the number of elderly people’s hospitalizations due to mental and behavioral disorders by the elderly population living in the same year and place, multiplied by 100,000 inhabitants. The hospital mortality coefficient was calculated by dividing the number of hospital deaths of elderly people due to mental and behavioral disorders by the number of hospitalizations of elderly individuals in that same year, multiplied by 100,000 inhabitants.
Hospitalization and hospital mortality of elderly people with mental and behavioral disorders
Population data were based on the results of the 2010 Population Census provided by the Brazilian Institute of Geography and Statistics (IBGE).2 The population
calculated on census was used as denominator for the 2008-2010 period. In addition, we used the population estimates for the 2011-2014 period.
The amount and coefficients of hospitalizations, as well as the number of deaths and mortality coefficients for each year of study were stratified according to the following variables:
a) sex (male; female);
b) age group, in years (60-69; 70-79; 80 or over); c) skin color or ethnicity (white; black; brown; yellow;
indigenous; not informed);
d) country macroregion (North; Northeast; Southeast; South; Midwest); and
e) diagnosis groups according to chapter V of the ICD-10: - dementia (F00-F03)
- mental and behavioral disorders due to use of alcohol (F10)
- mental and behavioral disorders due to use of other psychoactive substances (F11-F19)
- schizophrenia, schizotypal disorders and delusional disorders (F20-F29)
- mood [affective] disorders (F30-F39)
- neurotic, stress-related and somatoform disorders - mental retardation (F70-F79)
- other mental and behavioral disorders (F04-F09, F50-F69, F80-F99)
In order to analyze time trends, we used the Prais-Winsten regression model, with the coefficients of hospitalization and of hospital mortality being the predictor variables (Y), and time (year), the outcome variable (X). Hospitalization and mortality coefficient trends were classified as increasing, decreasing or stationary. The annual variation coefficients of the measures, and their respective confidence intervals (95%CI) were also quantified.
Tools developed by SUS IT Department (Datasus) – TabWin and TabNet – were used to tabulate data and perform descriptive analysis, and Microsoft Office Excel 2007 was used to build graphics and tables, as well as Stata version 12.0, a software for data analysis and statistics. This study was carried out exclusively with secondary data and aggregates of public access. Thus, the project was exempted from appreciation by an Ethics Research Committee, in accordance with the Resolution of the National Health Council (CNS) No. 466, dated December 12th 2012.
Results
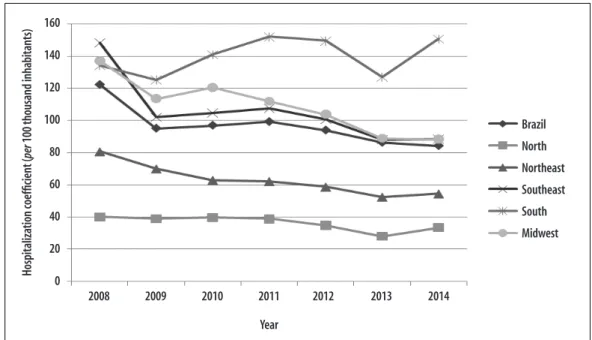
From 2008 to 2014, 139,941 hospitalizations of elderly individuals due to mental and behavioral disorders were registered in SIH/SUS, in Brazil. The hospitalization coefficient trend decreased from 122.3/100 thousand inhabitants in 2008 to 84.2/100 thousand inhabitants in 2014 (-0.14%; 95%CI -0.25;-0.03) (Figure 1 and Table 1). A reduction in the annual variation of hospitalization coefficients in almost all macroregions was observed: North (-0.39%; 95%CI -0.72;-0.06), Northeast (-0.20%; 95%CI -0.29;-0.12), Southeast (-0.08%; 95%CI -0.15;-0.01) and Midwest (-0.11%; 95%CI -0.16;-0.06); except for the South, where the evolution trend for this coefficient was stationary (0.08%; 95%CI -0.11;0.27). The South also presented the highest hospitalization coefficient in 2014: 150.7/100 thousand inhabitants (Figure 1 and Table 1).
The hospitalization coefficient was higher among males, during the whole research period, being of 103.5/100 thousand inhabitants for men and 68.8/100 thousand inhabitants for women, in 2014. The highest hospitalization coefficients were observed for the 60-69 years old age group (107.6/100 thousand inhabitants in 2014). For both sexes and all age groups studied, the hospitalization coefficient decreased in the period between 2008 and 2014 (Table 1).
A decrease in the total hospitalization coefficient of diagnosis groups was observed: -0.14%; 95%CI -0.25;-0.03. When we analyze the total hospitalizations in the period, we can notice the prevalence of schizophrenia, schizotypal disorders and delusional disorders (36.9%): the hospitalization coefficient for this group corresponded to 52.00 in 2008 and 28.10 in 2014. In addition, we shall highlight hospitalizations due to mood disorders (21.6%; 20.40/100 thousand inhabitants in 2014) and mental and behavioral disorders due to use of alcohol (21.3%; 19.20/100 thousand inhabitants in 2014) (Table 2).
Epidemiol. Serv. Saude, Brasília, 26(1), Jan-Mar 2017 Hospitalization and hospital mortality of elderly people with mental and behavioral disorders
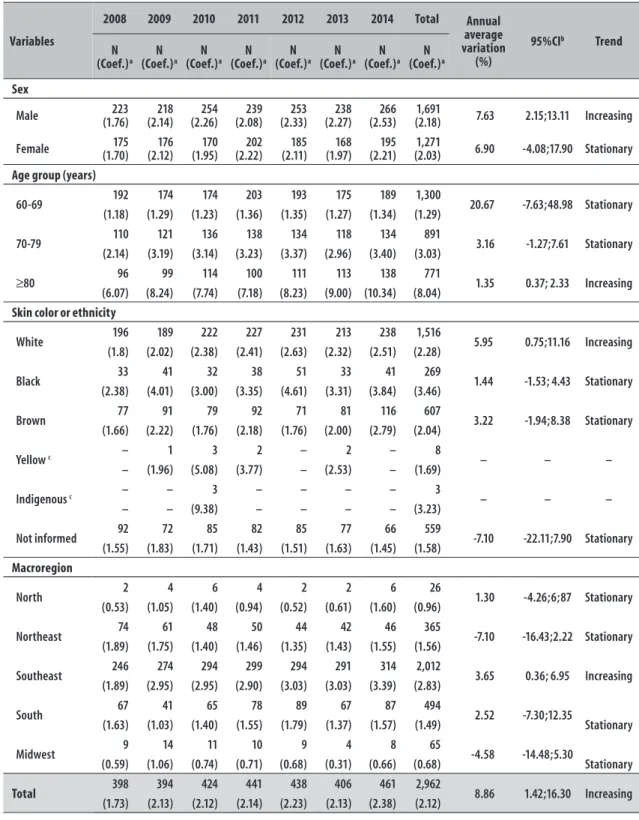
thousand inhabitants) and among black-skinned elderly people (3.46/100 thousand inhabitants), followed by indigenous (3.23/100 thousand inhabitants). The highest hospital mortality coefficients of elderly individuals were observed in the Southeast region: 2.95/100 thousand inhabitants in 2009 and 3.39/100 thousand inhabitants in 2014 (Table 3).
The main diagnosis – present in 32.3% of deaths – related to hospital mortality of elderly individuals due to mental and behavioral disorders was dementia. The hospital mortality coefficient for this diagnosis increased from 6.94/100 thousand inhabitants in 2008 to 13.20/100 thousand inhabitants in 2014 (1.04%; 95%CI 0.72;1.37) (Table 4).
Discussion
The findings of this study point to a decrease in the number and coefficient of hospitalization of elderly people due to mental and behavioral disorders and in its coefficient in Brazil from 2008 to 2014. These results may be related to the changes that have occurred in Brazil regarding mental health care after the implementation of the Brazilian Psychiatric Reform, by substituting the hospitals' traditional model by the psychosocial model: in the assistance area, the State took over a guidance role for building new practices and redefining Mental Health services.12
Despite the reduction of hospitalizations identified in this research, the mortality coefficients for dementia and alcohol use have increased, possibly due to flaws in the model of mental health care adopted in the country. One of the challenges of psychiatric reform is the insertion of Mental Health in primary health care, especially through the Family Health Program teams13
which, under certain conditions, are not prepared to attend the mental health demands of the elderly population in their social and family context and thus, may find themselves curbed from collaborating in the reduction of morbidity and mortality due to mental disorders.
An aggravating factor is the decrease in the demand for mental health services as individuals get older, which is caused by several factors such as beliefs and attitudes of elderly people towards mental disorders.14 These
issues need to be taken into consideration and deserve more attention from the professionals of the Family Health Strategy, who are closer to these individuals.
After analyzing the distribution and coefficient of deriving hospitalizations, we could observe that elderly men tend to be more hospitalized than elderly women. This finding is similar to one from a research carried out on registers of a university hospital, but it is divergent from the registers of a geriatric hospital, both located in São Paulo-SP and analyzed in a 2011 study.7
Hospitaliza
tion coefficient (
per
100 thousand inhabitants)
160
140
120
100
80
60
40
20
0
Brazil
North
Northeast
Southeast
South
Midwest
2008 2009 2010 2011 2012 2013 2014
Year
Figure 1 – Evolution of the hospitalization coefficient of elderly people (per 100 thousand inhabitants) due to
Table 1 – Number, coefficient evolution and hospitalization trends of elderly people due to mental and behavioral disorders according to sex, age group, skin color/ethnicity and macroregion, Brazil, 2008-2014
Variables
2008 2009 2010 2011 2012 2013 2014 Total Annual
coefficient variation
(%)
95%CIb Trend
N (Coef.)a
N (Coef.)a
N (Coef.)a
N (Coef.)a
N (Coef.)a
N (Coef.)a
N (Coef.)a
N (Coef.)a
Sex
Male 12,677
(151.5) 10,183 (117.6)
11,223 (122.5)
11,481 (124.4)
10,843 (116.7)
10,499 (107.6)
10,522 (103.5)
77,428
(120.54) -0.11 -0.20;-0.03 Decreasing
Female 10,270
(98.7) 8,286 (76.9)
8,730 (76.3)
9,093 (78.9)
8,772 (75.6)
8,534 (69.2)
8,828 (68.8)
62,513
(77.77) -0.17 -0.31;-0.03 Decreasing
Age group (years)
60-69 16,236 13,469 14,150 14,904 14,291 13,790 14,076 100,916 -0.11 -0.18;-0.03 Decreasing
(158.2) (126.7) (124.6) (130.3) (124.0) (110.2) (107.6) (126.0)
70-79 5,129 3,798 4,331 4,278 3,976 3,987 3,940 29,439 -0.16 -0.32;-0.01 Decreasing
(87.9) (63.2) (68.6) (67.3) (62.1) (61.1) (58.4) (66.9)
≥80 1,582 1,202 1,472 1,392 1,348 1,256 1,334 9,586 -0.25 -0.52;0.01 Stationary
(59.2) (43.0) (50.1) (47.0) (45.3) (41.3) (42.0) (46.8)
Skin color or ethnicity c
White 10,903 9,337 9,346 9,427 8,790 9,170 9,482 66,455 – – –
– – – – – – – –
Black 1,387 1,022 1,065 1,134 1,107 998 1,068 7,781 – – –
– – – – – – – –
Brown 4,627 4,103 4,481 4,227 4,028 4,058 4,164 29,688 – – –
– – – – – – – –
Yellow 85 51 59 53 76 79 71 474 – – –
– – – – – – – –
Indigenous 26 27 32 3 3 – 2 93 – – –
– – – – – – – –
Not informed 5,919 3,929 4,970 5,730 5,611 4,728 4,563 35,450 – – –
– – – – – – – –
Macroregion
North 378 381 429 425 386 329 375 2,703 -0.39 -0.72;-0.06 Decreasing
(40.0) (38.9) (39.6) (38.80) (34.7) (27.99) (33.4) (36.15)
Northeast 3,921 3,491 3,434 3,420 3,251 2,137 2,963 23,425 -0.20 -0.29;-0.12 Decreasing
(80.7) (70.0) (62.9) (62.2) (58.7) (52.4) (54.4) (62.95)
Southeast 13,006 9,282 9,964 10,302 9,698 9,598 9,258 71,108 -0.08 -0.15;-0.01 Decreasing
(148.1) (101.8) (104.5) (107.3) (100.4) (87.9) (88.4) (105.48)
South 4,121 3,999 4,635 5,025 4,965 4,883 5,547 33,175 0.08 -0.11;0.27 Stationary
(134.1) (125.2) (140.9) (152.0) (149.4) (127.1) (150.7) (139.91)
Midwest 1,521 1,316 1,491 1,402 1,315 1,279 1,207 9,530 -0.11 -0.16;-0.06 Decreasing
(137.1) (113.5) (120.4) (111.9) (103.8) (88.8) (88.2) (109.10)
Total 22,947 18,469 19,953 20,574 19,615 19,033 19,350 139,941 -0.14 -0.25;-0.03 Decreasing
122.3 95.1 96.9 99.2 93.9 86.2 84.2 (96.82)
a) Hospitalization coefficient per 100 thousand inhabitants b) 95%CI: 95% confidence interval
Epidemiol.
S
erv.
Sau
de
, B
rasília,
26(1),
J
an-Mar 2017
H
ospitalization and hospital mor
talit
y of elder
ly p
eople with mental and b
eha
vior
al disor
ders
Table 2 – Number, total percentage, evolution of coefficient and trends of hospitalization of elderly people due mental and behavioral disorders according to diagnosis group, Brazil, 2008-2014
Code of
ICD-10 a Diagnosis
2008 2009 2010 2011 2012 2013 2014 Total Annual
coefficient variation
(%)
95%CI c Trend
N
(Coef.)b (Coef.)N b (Coef.)N b (Coef.)N b (Coef.)N b (Coef.)N b (Coef.)N b (Coef.)N b
F00-F03 Dementia
1,642 1,430 1,443 1,374 1,314 1,322 1,318 9,843 7.0
-2.76;-1.22 Decreasing
(8.70) (7.30) (7.00) (6.60) (6.20) (5.90) (5.70) (6.77) –
F10 Mental and behavioral disorders due to use of alcohol
3,904 3,834 4,291 4,668 4,416 4,293 4,433 29,839 21.3
-2.64;1.38 Stationary
(20.80) (19.70) (20.80) (22.50) (21.10) (19.40) (19.20) (20.50) –
F11-F19 Mental and behavioral disorders due to use of other psychoactive substances
981 409 643 670 665 485 559 4,412 3.2
-3.10;0.65 Stationary
(5.20) (2.10) (3.10) (3.20) (3.10) (2.20) (2.40) (3.04) –
F20-F29 Schizophrenia, schizotypal disorders and delusional disorders
9,757 6,947 7,470 7,303 6,905 6,787 6,471 51,640 36.9
-0.40;-0.06 Decreasing
(52.00) (35.70) (36.20) (35.20) (33.00) (30.70) (28.10) (35.84) –
F30-F39 Mood [affective] disorders
3,969 4,007 4,153 4,539 4,450 4,391 4,697 30,206 21.6
-4.21;2.54 Stationary
(21.10) (20.60) (20.10) (21.80) (21.30) (19.80) (20.40) (20.78) –
F40-F48 Neurotic, stress-related and somatoform disorders
186 184 220 221 253 152 167 1,383 1.0
-15.62;7.28 Stationary
(0.90) (0.90) (1.00) (1.00) (1.20) (0.60) (0.70) (0.90) –
F70-F79 Mental retardation
635 198 253 261 214 223 237 2,021 1.4
-3.87;0.59 Stationary
(3.30) (1.00) (1.20) (1.20) (1.00) (1.00) (1.00) (1.38) –
F04-F09 F50-F69 F80-F99
Other mental and behavioral disorders
1,873 1,460 1,480 1,538 1,398 1,380 1,468 10,597 7.6
-2.49;-0.41 Decreasing
(9.90) (7.50) (7.10) (7.40) (6.60) (6.20) (6.30) (7.28) –
Total
22,947 18,469 19,953 20,574 19,615 19,033 19,350 139,941 100.0
-0.25;-0.03 Decreasing
(122.30) (95.00) (96.90) (99.10) (93.90) (86.20) (84.10) (96.78) –
a) ICD-10: International Statistical Classification of Diseases and Related Health Problems - 10th Revision b) Hospitalization coefficient per 100 thousand inhabitants
Table 3 – Number, evolution of coefficient and trends of hospital mortality of elderly people due to mental and behavioral disorders according to sex, age group, skin color/ethnicity and macroregion, Brazil, 2008-2014
Variables
2008 2009 2010 2011 2012 2013 2014 Total Annual
average variation
(%)
95%CIb Trend
N
(Coef.)a (Coef.)N a (Coef.)N a (Coef.)N a (Coef.)N a (Coef.)N a (Coef.)N a (Coef.)N a
Sex
Male 223
(1.76) 218 (2.14)
254 (2.26)
239 (2.08)
253 (2.33)
238 (2.27)
266 (2.53)
1,691
(2.18) 7.63 2.15;13.11 Increasing
Female (1.70)175 (2.12)176 (1.95)170 (2.22)202 (2.11)185 (1.97)168 (2.21)195 (2.03)1,271 6.90 -4.08;17.90 Stationary
Age group (years)
60-69 192 174 174 203 193 175 189 1,300 20.67 -7.63;48.98 Stationary
(1.18) (1.29) (1.23) (1.36) (1.35) (1.27) (1.34) (1.29)
70-79 110 121 136 138 134 118 134 891 3.16 -1.27;7.61 Stationary
(2.14) (3.19) (3.14) (3.23) (3.37) (2.96) (3.40) (3.03)
≥80 96 99 114 100 111 113 138 771 1.35 0.37; 2.33 Increasing
(6.07) (8.24) (7.74) (7.18) (8.23) (9.00) (10.34) (8.04)
Skin color or ethnicity
White 196 189 222 227 231 213 238 1,516 5.95 0.75;11.16 Increasing
(1.8) (2.02) (2.38) (2.41) (2.63) (2.32) (2.51) (2.28)
Black 33 41 32 38 51 33 41 269 1.44 -1.53; 4.43 Stationary
(2.38) (4.01) (3.00) (3.35) (4.61) (3.31) (3.84) (3.46)
Brown 77 91 79 92 71 81 116 607 3.22 -1.94;8.38 Stationary
(1.66) (2.22) (1.76) (2.18) (1.76) (2.00) (2.79) (2.04)
Yellow c – 1 3 2 – 2 – 8 – – –
– (1.96) (5.08) (3.77) – (2.53) – (1.69)
Indigenous c – – 3 – – – – 3 – – –
– – (9.38) – – – – (3.23)
Not informed 92 72 85 82 85 77 66 559 -7.10 -22.11;7.90 Stationary
(1.55) (1.83) (1.71) (1.43) (1.51) (1.63) (1.45) (1.58)
Macroregion
North 2 4 6 4 2 2 6 26 1.30 -4.26;6;87 Stationary
(0.53) (1.05) (1.40) (0.94) (0.52) (0.61) (1.60) (0.96)
Northeast 74 61 48 50 44 42 46 365 -7.10 -16.43;2.22 Stationary
(1.89) (1.75) (1.40) (1.46) (1.35) (1.43) (1.55) (1.56)
Southeast 246 274 294 299 294 291 314 2,012 3.65 0.36; 6.95 Increasing
(1.89) (2.95) (2.95) (2.90) (3.03) (3.03) (3.39) (2.83)
South 67 41 65 78 89 67 87 494 2.52 -7.30;12.35
(1.63) (1.03) (1.40) (1.55) (1.79) (1.37) (1.57) (1.49) Stationary
Midwest 9 14 11 10 9 4 8 65 -4.58 -14.48;5.30
(0.59) (1.06) (0.74) (0.71) (0.68) (0.31) (0.66) (0.68) Stationary
Total 398 394 424 441 438 406 461 2,962 8.86 1.42;16.30 Increasing
(1.73) (2.13) (2.12) (2.14) (2.23) (2.13) (2.38) (2.12)
a) Hospital death coefficient per 100 thousand inhabitants b) 95%CI: 95% confidence interval
Epidemiol.
S
erv.
Sau
de
, B
rasília,
26(1),
J
an-Mar 2017
H
ospitalization and hospital mor
talit
y of elder
ly p
eople with mental and b
eha
vior
al disor
ders
Table 4 – Number, total percentage, evolution of coefficient and trends of hospitalization of elderly people due to mental and behavioral disorders according to diagnosis group, Brazil, 2008-2014
Code of
ICD-10 a Diagnosis
2008 2009 2010 2011 2012 2013 2014 Total
Total (%)
Annual Coefficient variation (%)
95%CIc Trend
N
(Coef.)b (Coef.)N b (Coef.)N b (Coef.)N b (Coef.)N b (Coef.)N b (Coef.)N b (Coef.)N b
F00-F03 Dementia
114 120 135 130 140 143 174 956 32.3
1.04 0.72;1.37 Increasing
(6.94) (8.39) (9.36) (9.46) (10.65) (10.82) (13.20) (9.71) –
F10 Mental and behavioral disorders due to use of alcohol
35 38 52 44 66 62 65 362 12.2
6.94 1.92;11.96 Increasing
(0.9) (0.99) (1.21) (0.94) (1.49) (1.44) (1.47) (1.21) –
F11-F19 Mental and behavioral disorders due to use of other psychoactive substances
39 8 23 24 14 18 19 45 4.9
0.07 -2.99;3.14 Stationary
(3.98) (1.96) (3.58) (3.58) (2.11) (3.71) (3.40) (3.29) –
F20-F29 Schizophrenia, schizotypal disorders and delusional disorders
134 145 128 148 139 109 118 921 31.1
1.68 -7.61;10.97 Stationary
(1.37) (2.09) (1.71) (2.03) (2.01) (1.61) (1.82) (1.78) –
F30-F39 Mood [affective] disorders
17 25 26 36 21 23 25 173 5.8
-0.68 -21.14;19.78 Stationary
(0.43) (0.62) (0.63) (0.79) (0.47) (0.52) (0.53) (0.55) –
F40-F48 d Neurotic, stress-related and somatoform disorders
4
–
2 5 1 – 3 15 0.5
– – –
(2.15) (0.91) (2.26) (0.40) – (1.80) (1.08) –
F70-F79 Mental retardation
21 15 15 13 10 17 14 105 3.5
0.45 -1.05;1.95 Stationary
(3.31) (7.58) (5.93) (4.98) (4.67) (7.62) (5.91) (5.20) –
F04-F09 F50-F69 F80-F99
Other mental and behavioral disorders
34 43 43 41 47 34 43 285 9.6
1.96 -2.60;6.53 Stationary
(1.82) (2.95) (2.91) (2.67) (3.36) (2.46) (2.93) (2.79) –
Total
398 394 424 441 438 406 461 2,962
100.0 8.86 1.42;16.30 Increasing
(1.73) (2.13) (2.12) (2.14) (2.23) (2.13) (2.38) (2.12)
a) ICD-10: International Statistical Classification of Diseases and Related Health Problems - 10th Revision
b) Hospital death coefficient per 100 thousand inhabitants c) 95%CI: 95% confidence interval
The highest coefficients of hospital mortality were observed in the male sex and in the age group of 80 years or over. Similar findings were observed in that same study carried out with hospitalized elderly in São Paulo-SP in 2011, revealing an increase in the mortality coefficients with age, and more elevated coefficients among males.7
The highest mortality coefficient was observed among dark-skinned individuals (black and brown skin colors). This evidence suggests the possibility that black elderly have more difficulties in the access to services of primary health care,15 to privileged places
for promoting mental health and preventing diseases and conditions originated from mental disorders in this age group.
In a study carried out in 2012 about primary health care accessibility by black families in Salvador-BA, part of the interviewed individuals pointed out the condition of being "black and poor" as an element that increases their difficulties regarding health services.16 Thus, there
are still several challenges to overcome so that SUS may be able to meet the current health care demands in all its variations and dimensions. This approach does not concern the care with assistance and disease treatment only, it also includes the dimensions of prevention and health promotion, which are essential for the general population, especially the black population.17
The Brazilian region presenting the highest mortality coefficient was the Southeast. This result may have been influenced by the deficit in Mental Health care for the elderly population, possibly aggravated by shortage of specific health policies and professional qualification towards the care of elderly people’s mental health.18
Hospitalizations due to schizophrenia, schizotypal disorders and delusional disorders were the most prevalent in this study. In 2001, according to WHO, schizophrenia was a worldwide leading cause among the main causes responsible for years lived with disability, outnumbering cancer and cardiovascular diseases.4 It can justify the
fact that the highest prevalence of hospitalizations by mental disorders are due to schizophrenia.
Dementia was the disorder that most contributed to the mortality rates, and was the fifth cause of hospitalization in a sequence of seven psychiatric morbidities, besides presenting the highest hospital mortality coefficient and the highest increase in the course of the studied years. Dementia syndromes are an important Public Health issue due to the elevated costs with medication and
hospitalization, and also because they bring emotional, physical, social and financial damage to patients, their relatives and caregivers. There are several implications of dementia in the life of elderly people, such as adverse events regarding pharmacotherapy of dementia syndromes, as drug interactions mediated by the use of hypotensive agents, keeping indirect relation with the level of dementia and, consequently, with the patients' clinical evolution.19
The high mortality coefficient related to hospitalizations due to dementia can be reduced through activities that may contribute for the promotion of elderly people’s mental health, as it was observed in a study carried out in Belo Horizonte-MG, in 2010. According to that study, regular practice of mental and physical activities was beneficial in hindering cognitive decline, thus reducing the risk of dementia.20
Furthermore, patients with dementia, in early or intermediate stage, showed significant cognitive improvement with the programs for neuropsychological rehabilitation of memory that work at the same time as therapy for elderly people affected by dementia, and as preventive alternative against cognitive decline and depression. Those patients also presented reduction in depression indicators and mood improvement.21
With regard to the occurrence of mental disorders in general, according to a study carried out in Brazil on the period from 2002 to 2011, the costs of hospitalization due to mental disorders are the highest, and this is the most expensive disease for the elderly population.22 Therefore,
new political and research agendas prioritizing elderly people are relevant, and they should invest in efficient and effective interventions for preventing the disease and promoting mental health in this population group.23
It is important to highlight that this study presents some limitations. One of them is the fact that the data source (SIH/SUS) registers exclusively the hospitalizations funded by SUS, with estimated coverage of 5.72% for the year of 2014.8
We could not calculate the hospitalization coefficient and its annual average variation, which could contribute to the results interpretation. Even though SIH/SUS presented data on skin color or ethnicity, this variable was incomplete in the system's source-file.
Epidemiol. Serv. Saude, Brasília, 26(1), Jan-Mar 2017
emergency room care. Besides, as this study focused mainly in hospitalizations and hospital mortality, its results should not be extended to the general population.
The findings of this study approached a topic which is still little explored in Brazil and for this reason they contribute for a bigger and better comprehension of the mental health demands of elderly people. Essentially, we highlight the need for more attention to mental health promotion during life course, as well as measures for preventing diseases and conditions originated from mental disorders in the elderly population.
Therefore, we suggest the expansion of access to extra-hospital mental health services in primary health care, such as those offered by the Family Health Strategy and Centers for Psychosocial Care (CAPS), and to essential
mental health equipment for monitoring elderly people with severe and persistent mental disorders, especially those suffering from schizophrenia, schizotypal disorders and delusional disorders.
Authors' contributions
Santos VC, Anjos KF, Boery RNSO, Moreira RM, Cruz DP and Boery EN contributed to the conception and design of the study, the analysis and interpretation of the results, drafting and relevant critical review of the intellectual content of the manuscript. All authors approved the manuscript’s final version and declared to be responsible for all aspects of the study, ensuring its accuracy and integrity.
References
1. United Nations. Department of Economic and Social Affairs. Population Division. World population prospects: the 2008 revision, highlights. New York: United Nations; 2009. (WorkingPapernº ESA/P/ WP.210)
2. Instituto Brasileiro de Geografia e Estatística. Primeiros resultados definitivos do Censo 2010[Internet]. Rio de Janeiro:Instituto Brasileiro de Geografia e Estatística; 2011 [citado 2016 jun 22]. Disponível em: http://www.ibge.gov.br/home/ estatistica/populacao/censo2010/
3. Fornari LHT, Garcia LP, Hilbig A, Fernandez LL.As diversas faces da síndrome demencial: como diagnosticar clinicamente? Sci Med. 2010 abr-jun;20(2):185-93.
4. World Health Organization. The world health report 2001: mentalhealth: new understanding, new hope [Internet]. Geneva: World Health Organization;2001. [cited 2016 Jun 22]. Available from: http://www.who. int/whr/2001/en/whr01_en.pdf?ua=1
5. World Health Organization. Mental health and older adults [Internet].Geneva: World Health Organization;20165 [cited 2016 Jun 22]. Available from:http://www.who.int/mediacentre/factsheets/ fs381/en/
6. Borim FSA, Barros MBA, Botega NJ. Transtorno mental comum na população idosa: pesquisa de base populacional no Município de Campinas, São Paulo, Brasil. Cad Saude Publica. 2013 jul;29(7):1415-26.
7. Alves IAL, Lira PO, Reppetto MA, Hupsel ZN. Idosos em um hospital universitário e em um hospital
geriátrico. Arq Med Hosp Fac Cienc Med Santa Casa São Paulo. 2011;56(1):7-11.
8. Brasil. Ministério da Saúde. Portaria n° 2.528 de 19 de outubro de 2006. Aprova a política nacional de saúde da pessoa idosa. Diário Oficial da República Federativa do Brasil, Brasília (DF), 2006 out 10; Seção 1:142.
9. Ministério da Saúde (BR). Departamento de Informática do SUS. Brasília: Ministério da Saúde; 2016 [citado 2016 jun 22]. Disponível em: http:// www2.datasus.gov.br/DATASUS/index.php
10. Ministério da Saúde (BR). Secretaria de Atenção à Saúde. Departamento de Ações Programáticas e Estratégicas. Área Técnica Saúde do Idoso. Atenção à saúde da pessoa idosa e envelhecimento. Brasília: Ministério da Saúde; 2010. (Série B. Textos Básicos de Saúde); (Série Pactos pela Saúde 2006, v. 12)
11. World Health Organization. Classificação estatística internacional de doenças e problemas relacionados à saúde. 10. rev. v. 1. São Paulo: Centro Colaborador da OMS para a Classificação de Doenças em Português; 1995.
12. Acioli Neto ML, Amarante PDC. O acompanhamento terapêutico como estratégia de cuidado na atenção psicossocial. Psicol Cienc Prof. 2013;33(4):964-75.
13. Gazignato ECS, Castro e Silva CR. Saúde mental na atenção básica: o trabalho em rede e o matriciamento em saúde mental na Estratégia de Saúde da Família. Saude Debate. 2014 abr-jun;38(101):296-304.
14. Wong LLR, Carvalho JA. O rápido processo de envelhecimento populacional do Brasil: sérios
desafios para as políticas públicas. Rev Bras Estud Popul.2006 jan-jun;23(1):5-26.
15. Santos VC, Boery EN, Boery RNSO, Anjos KF. Conditions of health and quality of life of the quilombola elderly black. J Nurs UFPE. 2014 Aug;8(8):2603-10.
16. Trad LAB, Castellanos MEP, Guimaraes MCS. Accessibility to primary health care by black families in a poor neighborhood of Salvador, Northeastern Brazil. Rev Saude Publica. 2012 Dec;46(6):1007-13.
17. Costa AN. Promoção da equidade em saúde para a população negra. BIS Bol Inst Saude. 2011out;13(2);100-6.
18. Vicente B, Kohn R, Saldivia S, Rioseco P, Torres S. Patrones de uso de servicios entre adultos com problemas de salud mental, en Chile. Rev Panam Salud Publica 2005 oct-nov;18(4-5):263-70.
19. Pinheiro J S, Carvalho MFC; Luppi G. Interação medicamentosa e a farmacoterapia de pacientes geriátricos com síndromes demenciais. Rev Bras Geriatr Gerontol. 2013;16(2):303-14.
20. Petroianu A, Capanema HXM, Silva MMQ , Braga NTP. Atividade física e mental no risco de demência em idosos. J Bras Psiquiatr. 2010;59(4):302-7.
21. Silva SL, Pereira DA, Veloso F, Satler CE, Arantes A, Guimarães RM. Programa de reabilitação neuropsicológica da memória aplicada à demência: um estudo não controlado intrasujeitos. Estud Psicol. 2011 abr-jun;28(2):229-40.
22. Silveira RE, Santos AS, Sousa MC, Monteiro TSA. Gastos relacionados a hospitalizações de idosos no Brasil: perspectivas de uma década. Einstein. 2013 out-dez;11(4):514-20.
23. Leandro-França C, Murta SG. Prevenção e promoção da saúde mental no envelhecimento: conceitos e intervenções. Psicol Cienc Prof. 2014 abr-jun;34(2):318-29
Received on 01/11/2015