Epidemiol. Serv. Saude, Brasília, 26(1), Jan-Mar 2017 ORIGINAL
ARTICLE
Assessment of the investigation of ill-defined causes of
death in Brazil in 2010
Correspondence:
Elisabeth França – Universidade Federal de Minas Gerais, Faculdade de Medicina, Av. Alfredo Balena, 190/731, Belo Horizonte-MG, Brasil. CEP: 30130-100
E-mail: [email protected]
Abstract
Objective: to assess the results of the investigation of ill-defined causes of death (IDCD) to improve the quality of cause-of-death data in Brazil. Methods: this is a descriptive study using data from the Mortality Information System; all IDCD which occurred in 2010 were selected; deaths were analyzed according to macroregions, states, state capitals and characteristics of how the investigations were carried out. Results: the proportion of IDCD was 8.6% in Brazil in 2010 and decreased to 7.0% after investigation and fell from 4.7% to 3.4% in state capitals after investigation; approximately 65% of the investigated cases were reclassified to a defined cause in states and state capitals. Conclusion: there was an improvement in data quality on cause of death resulting from these investigations which have led to an important decrease in the proportion of IDCD in the states and state capitals, although there are still some regional inequalities.
Key words: Causes of Death; Mortality Registries; Information Systems; Health Evaluation; Vital Statistics.
doi: 10.5123/S1679-49742017000100003
Carolina Cândida da Cunha1
Renato Teixeira1
Elisabeth França2
1Universidade Federal de Minas Gerais, Grupo de Pesquisas em Epidemiologia e Avaliação em Saúde-GPEAS, Belo Horizonte-MG, Brasil
Epidemiol. Serv. Saude, Brasília, 26(1), Jan-Mar 2017 Investigation of ill-defined causes of death in Brazil
Introduction
Mortality indicators are essential to understand the epidemiologic profile and assess the populations’ health situation, and for planning, monitoring and evaluating health services. In this sense, data on death causes are the most used.1 However, mortality analysis can be
compromised in cases where there is a high number of ill-defined causes of death (IDCD), especially in time series studies and in the distribution of causes by sex and age.2
According to the International Statistical Classification of Diseases and Related Health Problems 10th Revision
(ICD-10), underlying cause of death is
"(a) the disease or injury which initiated the train of morbid events leading directly to death or (b) the circumstances of the accident or violence which produced the fatal injury”.
IDCD are those whose underlying cause is classified in Chapter XVIII of the ICD-10 and contain only the description of symptoms and signs of diseases. The occurrence of these deaths indicates problems in the access to health services and reflects the quality of medical assistance offered to the population.1-3
In Brazil, despite the improvement and consolidation of the Mortality Information System (SIM) since the 2000's, the high number of IDCD is still a concern.4
In 2003, these deaths corresponded to 13.3% of the country's total deaths, presenting a great variety among municipalities, states and macroregions, with proportions varying from 25.9% in the Northeast region to 6.7% in the South region.3,4 In 2000, developed countries such
as Hungary, New Zealand, Finland, Cuba and Romania already presented IDCD proportion of less than 1%,5
which highlights Brazil's high proportion of IDCD. North and Northeast regions, which are responsible for the occurrence of most IDCDs, presented a sharp decrease in this proportion, resulting mostly from specific investment made by the Ministry of Health to improve essential information,6-7 especially in regulation of data
collection, flow and regularity for providing information on deaths,8 discontinuation of automatic and regular
transference of resources, in the case of problems in
providing this information,9 besides the release of data,
technical publications and human resources training, especially on codes of underlying cause of death.10 We
can also highlight the promotion and distribution of a new instructions manual in the filling in of Death Certificates (DC) since 2011, aiming to raise the healthcare professional's awareness on the importance of this document.4,11
Regarding the quality improvement of statistics on causes of death, the Ministry of Health established a proposal for investigation of IDCD, especially in the country's North and Northeast regions.6-7 In 2006, the
National Network of Death Verification Service (SVO) was created, highlighting the need for implementing the SVO in every state capital and in the Federal District, which will total up to 74 services distributed among the 27 Federation Unities (UF).12 In 2008, a pilot
project to introduce verbal autopsy (VA) as a method of investigation of IDCD home deaths was initiated, using World Health Organization's (WHO) standard forms for VA adapted to the most prevailing causes in Brazil. Supposedly, the VA analysis allows the physician to identify the sequence of events which led to death.2,13,14
Good results were described regarding the decrease of IDCD in the North and Northeast regions with the implementation of the program 'Percentage Reduction of Ill-Defined Causes of Death'.4,15
Considering the importance of IDCD and its investigation, together with the availability of mortality data from the national health information systems, the aim of this study was to describe the results of the investigation of ill-defined causes of death (IDCD) to improve the quality of cause-of-death data in Brazil.
Methods
This is a descriptive study about ill-defined causes of death and its investigation in Brazilian states, state capitals and macroregions.
In 2010, the country had a total population of approximately 200 million people, in the 26 states and the Federal District (DF), living in 5,540 municipalities distributed among five macroregions: North, Northeast, Midwest, Southeast and South. In economy, as well as in the population characteristics, there are significant differences among regions and states.16
We used data from SIM, available at the website of the IT Department of the Brazilian National Health System (Datasus): www.datasus.gov.br.
Epidemiol. Serv. Saude, Brasília, 26(1), Jan-Mar 2017
Carolina Cândida da Cunha et al.
We selected all deaths occurred in 2010 whose underlying cause of death was covered in Chapter XVIII of ICD-10 (categories: R00 to R99). The place of residence was considered here in order to stratify deaths by macroregions, UF and capitals.
In SIM's database, investigated IDCDs are informed in a variable field named 'TTPOS', and the underlying causes of death are presented in two ways: the original (variable field 'CAUSABAS_O'), referring to the underlying cause registered at the time of death, in the field 40/ Bloco V of the original DC; and the final underlying cause (variable field 'CAUSABAS'), referring to the cause determined after investigating the death. In case there is no investigation or it does not enable the clarification of the underlying cause, the original underlying cause will be the same as the final. In case there is a substitution of IDCD for an underlying cause not covered in Chapter XVIII of the ICD-10, that will be the final cause, and these deaths will be presented as reclassified.4
With regard to the database variables 'Place of Death Occurrence' (variable field "LOCOCOR") and 'Death Attested by a physician' (variable field " ATESTANTE "), these data come from the field 20/Bloco III and field 43/ Bloco VI of the DC, respectively. The first variable refers to the place where the death occurred, and the second refers to the condition of the attesting physician – responsible for confirming the death and filling in the DC.11
The following variables were analyzed: original IDCD (all deaths whose original underlying cause belonged to chapter XVIII of ICD-10); deaths investigated as IDCD (all deaths with original IDCD and declared as investigated at SIM the following way: yes, no, or blank); reclassified IDCD (deaths with original IDCD that had the underlying cause reclassified); investigated deaths with reclassification (deaths with original IDCD investigated that had the underlying cause reclassified); final IDCD (deaths investigated or not, which remained IDCD, that is, they had a final underlying cause included in chapter XVIII of ICD-10, presented in the format of code for cause of death with one letter and up to three digits); place of occurrence of investigated deaths (hospital and other health facilities, household, public road/other places or ignored); person responsible for attesting (signee) the underlying cause of deaths investigated (assistant physician, substitute physician, SVO physician, physician from the Institute of Forensic Medicine (IFM), other or ignored). According to procedures standardized by the Ministry of Health,13 the investigations of IDCD, that is, the
search for information about the terminal disease for clarification of the underlying cause of death can be performed at primary health care units (PHU), clinics and hospitals, at committees for prevention of infant or maternal death, or comparing with other databases. Information on the underlying cause of death can also be collected on the SVO, responsible for clarifying the causes of death by natural cause without diagnosis, and at the IFM, legally responsible for clarifying deaths by external causes. Deaths in which the information obtained in the investigation sources aforementioned do not allow for the clarification of the cause of death, must be investigated through household interviews, using the verbal autopsy (VA) form.
The following indexes were calculated: (i) IDCD percentage, in relation to the total of deaths; (ii) percentage of investigated IDCD, in relation to the total of deaths due to these causes; (iii) percentage of IDCD that were reclassified to defined cause after investigation, in relation to the total of IDCD; (iv) percentage of IDCD that were reclassified to defined cause after investigation, in relation to the total of investigated deaths; (v) percentage of deaths that remained IDCD after investigation (remaining IDCD), in relation to the total of deaths; and (vi) variation of IDCD in relation to the total of deaths, calculated as the difference between the number of deaths observed by original IDCD and the number of deaths by remaining IDCD, divided by the total number of deaths. The variation of IDCD will be considered negative when, after investigation of defined cause deaths, there was reclassification to chapter XVIII, i.e., there was an increase in the percentage of ill-defined causes. If the variation is considered positive, it mean that there was a decrease in the percentage of ill-defined causes.
Data were processed with the software Tabwin version 3.2 and Microsoft Office Excel 2013 (Microsoft Corporation, United State of America) to produce the spreadsheets.
The study project was developed according to the Resolution of the National Health Council (CNS) No. 466, dated December 12th, 2012. The study was dismissed
from appreciation by an ethics in research committee, for being based exclusively on secondary data from SIM, of public domain, without nominal identification.
Results
Epidemiol. Serv. Saude, Brasília, 26(1), Jan-Mar 2017 Investigation of ill-defined causes of death in Brazil
to an IDCD. This percentage ranged from 5.7% in the South region to 13.5% in the North region. Among the Federation Units (UF), the percentage of IDCD ranged from 1.5% in the Federal District (DF) to 19.9% in the state of Acre. In the South region, all states presented a similar percentage of approximately 5.7%. However, in the North region, most states presented a percentage of IDCD higher than 10%, except from Tocantins and Roraima. The low percentage of IDCD in the states of Roraima (4.0%), Rio Grande do Norte (3.3%), Espírito Santo (2.8%) and Mato Grosso do Sul (2.1%), and in DF (1.5%) stands out in this study (Table 1).
Among deaths by IDCD, 30.3% were registered at SIM as investigated, ranging from 22.4% in the North region to 43.0% in the Midwest region. The states that investigated the highest percentage of IDCD were Tocantins (83.2%), Sergipe (78.3%) and Espírito Santo (62.7%), whereas Amapá (0.3%), Amazonas (5.3%) and Roraima (6.2%) presented the lowest percentage of investigation (Table 1).
After the investigations were carried out, 19.8% of IDCD had the underlying cause of death reclassified. In 14 Federation Units, the percentage of investigated deaths with reclassification of IDCD was of at least 60%, reaching 85.6% in Tocantins and 82.8% in Espírito Santo. However, in the states of Amazonas, Amapá, and Maranhão, besides the low percentage of investigations, the percentage of reclassification among investigated deaths was lower than 20%. In turn, we observed a significant decrease in the percentage of original IDCD in relation to the total of deaths in Acre (6.3%), Tocantins (5.9%), Sergipe (10.1%) and Bahia (5.8%).
In the state capitals, 278,952 deaths were notified to SIM, of which 4.7% were by IDCD, ranging from 2.1% in South region capitals to 9.4% in North region capitals. The lowest percentage was found in Teresina-PI (0.6%) and the highest in Rio Branco-AC (17.9%), and only three capitals of the North region presented percentage of IDCD higher than 10% (Table 2).
In general, the percentage of investigated deaths was higher in the state capitals than in the states. For the total of state capitals, the percentage of investigation was of almost 50%, ranging from 81.3% in the South region to 14.2% in the North region. In Palmas-TO, more than 90% of IDCD were investigated. The percentage of reclassification was of 32.0% in the total of capitals. Palmas-TO, Rio Branco-AC, Goiânia-GO and Salvador-BA were the capitals that presented the highest percentage
of reclassification and reduction of IDCD in relation to the total number of deaths. In turn, some capitals in North and Northeast regions had the lowest percentage of reclassification (Table 2).
Figure 1 presents indexes related to IDCD in the Federation Units (UF) and capitals, grouped according to macroregions, and to the country as a whole. There was a lower percentage of original IDCD in the capitals when compared to the UF, especially in states from the South and Northeast regions (Figure 1A). In turn, we observed a higher percentage of investigation in capitals of the South and Midwest regions (Figure 1B). The North region stood out with the highest percentage of IDCD and the lowest percentage of investigations. With regard to the investigated IDCD, the Midwest region had the highest percentage, followed by the Northeast region (Figure 1C). This percentage presented important differences between states and capitals only in the South region (Figure 1D). The percentage of remaining IDCD after investigation was lower than 10% in almost every region, except for the North region (Figure 1E). The highest percentage decrease of IDCD in relation to the total of deaths was observed in the Midwest region, UF and capital, and in the UF of North and Northeast regions (Figure 1F).
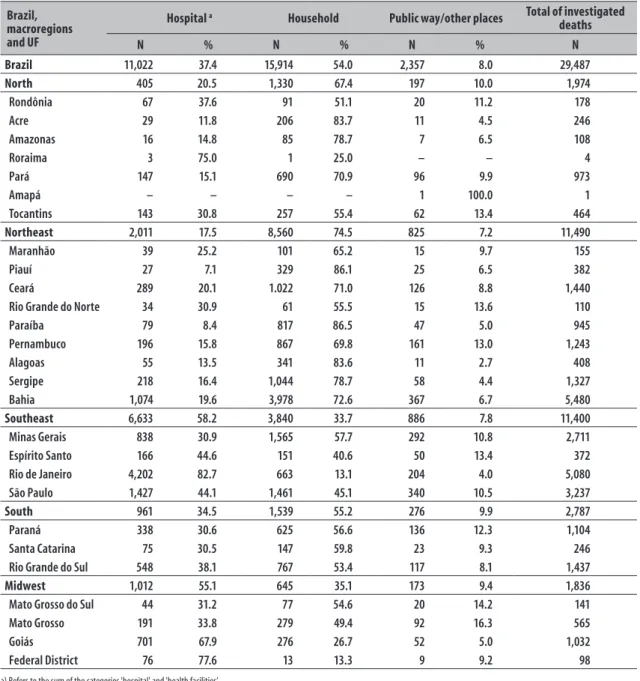
We observed that, from the total of investigated deaths, more than 50% occurred in households, with a highest percentage in the North (67.4%)and Northeast (74.5%) regions. In turn, in the states of Rio de Janeiro (82.7%) and Goiás (67,9%), and the Federal District (77.6%), most investigated IDCD occurred in hospitals. The percentage of investigated deaths which occurred in public ways/other places was of 8% in the country, and equal or lower than 10% in the macroregions (Table 3). It is important to highlight that in the North and Northeast regions approximately 70% of IDCD occurred in households, whereas in the Southeast and Midwest regions, this percentage was 45%, and in the South region, it was approximately 60% (data not presented).
Epidemiol.
S
erv.
Sau
de
, B
rasília,
26(1),
J
an-Mar 2017
C
ar
olina Cândida da C
unha et al.
Table 1 – Total of deaths and original, investigated and reclassified ill-defined causes of death, according to, macroregions and Federation Units (UF), Brazil, 2010
Brazil, macroregions and UF
Total of deaths by place of residence a
Original ill-defined
causes of death Investigated ill-defined causes of death Reclassified ill-defined causes of death
Investigated deaths with reclassified ill-defined
cause of death
Ill-defined causes of death as final classification
(remaining) b
Variation of ill-defined causes of death in relation
to the total of deaths
N N % N % N % % N % %
Brazil 1,136,947 97,314 8.6 29,487 30.3 19,303 19.8 65.5 79,622 7.0 1.6
North 65,425 8,813 13.5 1,974 22.4 1,156 13.1 58.6 7,732 11.8 1.7
Rondônia 7,225 719 10.0 178 24.8 65 9.0 36.5 666 9.2 0.7
Acre 3,009 599 19.9 246 41.1 191 31.9 77.6 409 13.6 6.3
Amazonas 13,300 2,047 15.4 108 5.3 20 1.0 18.5 2,030 15.3 0.1
Roraima 1,640 65 4.0 4 6.2 2 3.1 50.0 75 4.6 -0.6
Pará 31,600 4,536 14.4 973 21.5 481 10.6 49.4 4,084 12.9 1.4
Amapá 2,172 289 13.3 1 0.3 – – – 295 13.6 -0.3
Tocantins 6,479 558 8.6 464 83.2 397 71.1 85.6 173 2.7 5.9
Northeast 284,635 30,527 10.7 11,490 37.6 8,566 28.1 74.6 22,196 7.8 2.9
Maranhão 26,091 1,717 6.6 155 9.0 18 1.0 11.6 1,739 6.7 -0.1
Piauí 15,614 872 5.6 382 43.8 231 26.5 60.5 678 4.3 1.2
Ceará 43,847 3,060 7.0 1,440 47.1 866 28.3 60.1 2,232 5.1 1.9
Rio Grande do Norte 16,090 537 3.3 110 20.5 54 10.1 49.1 488 3.0 0.3
Paraíba 23,407 2,514 10.7 945 37.6 726 28.9 76.8 1,848 7.9 2.8
Pernambuco 54,570 3,700 6.8 1,243 33.6 748 20.2 60.2 2,968 5.4 1.3
Alagoas 17,737 1,861 10.5 408 21.9 346 18.6 84.8 1,523 8.6 1.9
Sergipe 10,942 1,695 15.5 1,327 78.3 1,114 65.7 83.9 595 5.4 10.1
Bahia 76,337 14,571 19.1 5,480 37.6 4,464 30.6 81.5 10,125 13.3 5.8
Southeast 534,495 43,524 8.1 11,400 26.2 6,538 15.0 57.4 38,047 7.1 1.0
Minas Gerais 120,803 12,779 10.6 2,711 21.2 1,520 11.9 56.1 11,939 9.9 0.7
Espírito Santo 21,205 593 2.8 372 62.7 308 51.9 82.8 291 1.4 1.4
Rio de Janeiro 127,536 12,284 9.6 5,080 41.4 2,870 23.4 56.5 9,430 7.4 2.2
São Paulo 264,951 17,868 6.7 3,237 18.1 1,840 10.3 56.8 16,387 6.2 0.6
South 179,428 10,178 5.7 2,787 27.4 1,610 15.8 57.8 8,743 4.9 0.8
Paraná 66,969 3,815 5.7 1,104 28.9 520 13.6 47.1 3,429 5.1 0.6
Santa Catarina 34,474 1,919 5.6 246 12.8 98 5.1 39.8 1,839 5.3 0.2
Rio Grande do Sul 77,985 4,444 5.7 1,437 32.3 992 22.3 69.0 3,475 4.5 1.2
Midwest 72,964 4,272 5.9 1,836 43.0 1,433 33.5 78.1 2,904 4.0 1.9
Mato Grosso do Sul 14,471 299 2.1 141 47.2 103 34.4 73.0 198 1.4 0.7
Mato Grosso 14,986 932 6.2 565 60.6 333 35.7 58.9 621 4.1 2.1
Goiás 32,656 2,874 8.8 1,032 35.9 933 32.5 90.4 1,981 6.1 2.7
Federal District 10,851 167 1.5 98 58.7 64 38.3 65.3 104 1.0 0.6
a) Includes ill-defined causes of death
Epidemiol.
S
erv.
Sau
de
, B
rasília,
26(1),
J
an-Mar 2017
In
vestigation of ill-defined c
auses of death in B
razil
Table 2 – Total of deaths and original, investigated and reclassified ill-defined causes of death, according to capitals of Federation Units (UF), Brazil, 2010
UF Capitals
Total of death by place of residence a
Original ill-defined
causes of death Investigated ill-defined causes of death Reclassified ill-defined causes of death
Investigated deaths with reclassified ill-defined
cause of death
Ill-defined causes of death as final classification
(remaining)
Variation of ill-defined causes of death in relation
to the total of deaths
N N % N % N % % N % %
Brazil 278,952 13,043 4.7 6,402 49.1 4,171 32.0 65.2 9,441 3.4 1.3
North 23,336 2,191 9.4 311 14.2 238 10.9 76.5 1,957 8.4 1.0
Porto Velho-RO 2,205 193 8.8 21 10.9 16 8.3 76.2 178 8.1 0.7
Rio Branco-AC 1,590 284 17.9 191 67.3 170 59.9 89.0 114 7.2 10.7
Manaus-AM 8,364 911 10.9 38 4.2 9 1.0 23.7 898 10.7 0.2
Boa Vista-RR 1,098 56 5.1 2 3.6 0 0.0 0.0 58 5.3 -0.2
Belém-PA 7,966 530 6.7 22 4.2 7 1.3 31.8 525 6.6 0.1
Macapá-AP 1,429 177 12.4 0 0.0 0 0.0 0.0 179 12.5 -0.1
Palmas-TO 684 40 5.8 37 92.5 36 90.0 97.3 5 0.7 5.1
Northeast 65,682 2,542 3.9 1,127 44.3 928 36.5 82.3 1,657 2.5 1.3
São Luís-MA 4,942 59 1.2 5 8.5 2 3.4 40.0 58 1.2 0.0
Teresina-PI 4,160 26 0.6 8 30.8 6 23.1 75.0 49 1.2 -0.6
Fortaleza-CE 12,680 694 5.5 70 10.1 27 3.9 38.6 679 5.4 0.1
Natal-RN 4,296 72 1.7 6 8.3 2 2.8 33.3 70 1.6 0.0
João Pessoa-PB 4,469 88 2.0 15 17.0 4 4.5 26.7 86 1.9 0.0
Recife-PE 10,599 115 1.1 38 33.0 23 20.0 60.5 93 0.9 0.2
Maceió-AL 5,894 114 1.9 10 8.8 5 4.4 50.0 108 1.8 0.1
Aracaju-SE 3,000 199 6.6 119 59.8 62 31.2 52.1 135 4.5 2.1
Salvador-BA 15,642 1,175 7.5 856 72.9 797 67.8 93.1 379 2.4 5.1
Southeast 140,528 6,764 4.8 3,798 56.2 2,135 31.6 56.2 5,137 3.7 1.2
Belo Horizonte-MG 14,677 513 3.5 251 48.9 129 25.1 51.4 843 5.7 -2.2
Vitória-ES 1,946 51 2.6 45 88.2 39 76.5 86.7 12 0.6 2.0
Rio de Janeiro-RJ 53,846 4,656 8.6 2,857 61.4 1,580 33.9 55.3 3,084 5.7 2.9
São Paulo-SP 70,059 1,544 2.2 645 41.8 387 25.1 60.0 1,198 1.7 0.5
South 23,140 476 2.1 387 81.3 170 35.7 43.9 316 1.4 0.7
Curitiba-PR 9,851 126 1.3 78 61.9 46 36.5 59.0 87 0.9 0.4
Florianópolis-SC 2,097 32 1.5 12 37.5 7 21.9 58.3 25 1.2 0.3
Porto Alegre-RS 11,192 318 2.8 297 93.4 117 36.8 39.4 204 1.8 1.0
Midwest 26,266 1,070 4.1 779 72.8 700 65.4 89.9 374 1.4 2.6
Campo Grande-MS 4,639 57 1.2 25 43.9 15 26.3 60.0 42 0.9 0.3
Cuiabá-MT 3,177 96 3.0 84 87.5 58 60.4 69.0 38 1.2 1.8
Goiânia-GO 7,599 750 9.9 572 76.3 563 75.1 98.4 192 2.5 7.3
Brasília-DF 10,851 167 1.5 98 58.7 64 38.3 65.3 102 0.9 0.6
a) Includes ill-defined causes of death
Epidemiol. Serv. Saude, Brasília, 26(1), Jan-Mar 2017
Carolina Cândida da Cunha et al.
0,0 0,5 1,0 1,5 2,0 2,5 3,0 3,5
BRASIL NORTE NORDESTE SUDESTE SUL CENTRO‐OESTE 0,0 2,0 4,0 6,0 8,0 10,0 12,0 14,0 16,0
BRASIL NORTE NORDESTE SUDESTE SUL CENTRO‐OESTE 0,0 10,0 20,0 30,0 40,0 50,0 60,0 70,0 80,0 90,0
BRASIL NORTE NORDESTE SUDESTE SUL CENTRO‐OESTE
0,0 10,0 20,0 30,0 40,0 50,0 60,0 70,0
BRASIL NORTE NORDESTE SUDESTE SUL CENTRO‐OESTE 0,0 10,0 20,0 30,0 40,0 50,0 60,0 70,0 80,0 90,0 100,0
BRASIL NORTE NORDESTE SUDESTE SUL CENTRO‐OESTE
0,0 2,0 4,0 6,0 8,0 10,0 12,0 14,0
BRASIL NORTE NORDESTE SUDESTE SUL CENTRO‐OESTE 16 14 12 10 8 6 4 2 0
Figure 1A - Percentage of original ill-defined causes of death from Federation Units and capitals, grouped according to macroregions, and in Brazil, 2010
Brazil North Northeast Southeast South Midwest 8,6 4,7 13,5 9,4 10,7 3,9 8,1 4,8 5,7 2,1 5,9 4,1
Brazil and macroregions
Per
centage of Dea
ths 90 80 70 60 50 40 30 20 10 0
Figure 1B - Percentage of investigated ill-defined causes of death from Federation Units and capitals, grouped according to macro regions, and in Brazil, 2010
Brazil North Northeast Southeast South Midwest 30,3 49,1 22,4 14,2 37,6 44,3 26,2 56,2 27,4 81,3 43,0 72,8
Brazil and macroregions
Per
centage of Dea
ths
Figure 1C - Percentage of reclassified ill-defined causes of death, in Federation Units and
capitals, grouped according to macroregions, in Brazil, 2010 Figure 1D - Percentage of investigated and reclassified deaths, in Federation Units and capitals, grouped according to macroregions, in Brazil, 2010
Figure 1E - Percentage of ill-defined causes of death as final classification (remaining), in
Federation Units and capitals, grouped according to macroregions and in Brazil, 2010 Figure 1F - Decrease of ill-defined causes of death in relation to the total of deaths in Federation Units and capitals, grouped according to macroregions, in Brazil, 2010 Brazil and macroregions
Brazil and macroregions
Brazil and macroregions
Brazil and macroregions
Per
centage of Dea
ths
Per
centage of Dea
ths
Per
centage of Dea
ths
Per
centage of Dea
ths
Brazil North Northeast Southeast South Midwest 70 60 50 40 30 20 10 0 19,8 32,0 13,1 10,9 28,1 36,5 15,0 31,6 15,8 35,7 33,5 65,4
Brazil North Northeast Southeast South Midwest 65,5 65,2
58,6
76,5 74,682,3
57,4 56,2 57,8 43,9
78,1 89,9
Brazil North Northeast Southeast South Midwest 14 12 10 8 6 4 2 0 7,0 3,4 11,8 8,4 7,8 2,5 3,7 7,1 4,9 1,4 4,0 1,4 3,5 3,0 2,5 2,0 1,5 1,0 0,5 0,0
Brazil North Northeast Southeast South Midwest 1,6 1,3 1,7 1,0 2,9 1,3 1,01,2 0,8 0,7 1,9 2,6 3,5 3,0 2,5 2,0 1,5 1,0 0,5 0,0
Federation units Capitals
Figure 1 – Indicators related to original, investigated and reclassified ill-defined causes of death, in Federation Units and capitals, grouped according to macroregions, and in Brazil, 2010
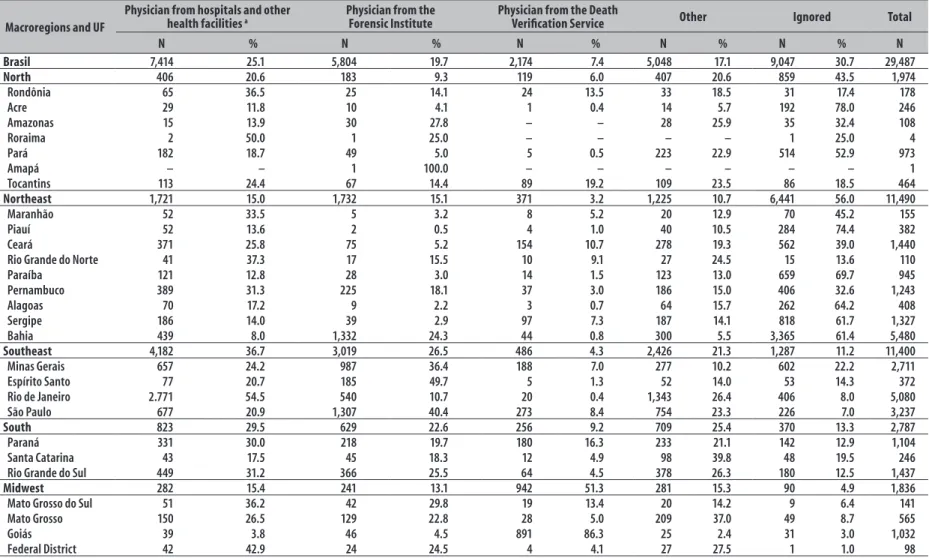
in the state of Goiás (86.3%). However, about a third of the investigated deaths (30.7%) did not inform the death signee, especially the Northeast region, where more than half of deaths (56.0%) did not mention this information (Table 4).
Discussion
In this study, we observed an improvement in the quality cause-of-death data registered at SIM due to investigative activities, with a decrease in the percentage of IDCD in country's states and state capitals. After investigation, the percentage of reclassification was approximately 65% for states and capitals, which resulted in a 20% decrease of IDCD in official statistics. However, regional differences remained: North and Northeast regions still presented a percentage of IDCD above the target established by the Ministry of Health – which must be inferior to 10% of the total of notified deaths.13,17
An analytic study of IDCD spatial pattern in Brazil and its relation with death register, when comparing 1980-1991 and 2000-2010 periods, concluded that there has been an improvement in mortality data in Brazil, with a decrease of 53% in IDCD from the total of the country; in the North and Northeast regions, the percentage of IDCD decreased from 72% in 1991 to about 25% in 2010.18 This reduction was a result
of several initiatives of the Ministry of Health, whose efforts were concentrated in these regions’ states.18,19
Epidemiol. Serv. Saude, Brasília, 26(1), Jan-Mar 2017 Investigation of ill-defined causes of death in Brazil
Table 3 – Place of occurrence of the investigated ill-defined causes of death according to macroregions and Federation Units (UF), Brazil, 2010
Brazil, macroregions and UF
Hospital a Household Public way/other places Total of investigated
deaths
N % N % N % N
Brazil 11,022 37.4 15,914 54.0 2,357 8.0 29,487
North 405 20.5 1,330 67.4 197 10.0 1,974
Rondônia 67 37.6 91 51.1 20 11.2 178
Acre 29 11.8 206 83.7 11 4.5 246
Amazonas 16 14.8 85 78.7 7 6.5 108
Roraima 3 75.0 1 25.0 – – 4
Pará 147 15.1 690 70.9 96 9.9 973
Amapá – – – – 1 100.0 1
Tocantins 143 30.8 257 55.4 62 13.4 464
Northeast 2,011 17.5 8,560 74.5 825 7.2 11,490
Maranhão 39 25.2 101 65.2 15 9.7 155
Piauí 27 7.1 329 86.1 25 6.5 382
Ceará 289 20.1 1.022 71.0 126 8.8 1,440
Rio Grande do Norte 34 30.9 61 55.5 15 13.6 110
Paraíba 79 8.4 817 86.5 47 5.0 945
Pernambuco 196 15.8 867 69.8 161 13.0 1,243
Alagoas 55 13.5 341 83.6 11 2.7 408
Sergipe 218 16.4 1,044 78.7 58 4.4 1,327
Bahia 1,074 19.6 3,978 72.6 367 6.7 5,480
Southeast 6,633 58.2 3,840 33.7 886 7.8 11,400
Minas Gerais 838 30.9 1,565 57.7 292 10.8 2,711
Espírito Santo 166 44.6 151 40.6 50 13.4 372
Rio de Janeiro 4,202 82.7 663 13.1 204 4.0 5,080
São Paulo 1,427 44.1 1,461 45.1 340 10.5 3,237
South 961 34.5 1,539 55.2 276 9.9 2,787
Paraná 338 30.6 625 56.6 136 12.3 1,104
Santa Catarina 75 30.5 147 59.8 23 9.3 246
Rio Grande do Sul 548 38.1 767 53.4 117 8.1 1,437
Midwest 1,012 55.1 645 35.1 173 9.4 1,836
Mato Grosso do Sul 44 31.2 77 54.6 20 14.2 141
Mato Grosso 191 33.8 279 49.4 92 16.3 565
Goiás 701 67.9 276 26.7 52 5.0 1,032
Federal District 76 77.6 13 13.3 9 9.2 98
a) Refers to the sum of the categories 'hospital' and 'health facilities’ Note:
Deaths which the place of occurrence was registered in the Death Certificate as ignored were not significant. For Brazil, they summed up 0.7% of the total, ranging from 0.3% to 0.8% among the macroregions.
in order to create more trustworthy data related to the number of IDCD in the states.18 For instance, the low
percentage of original IDCD in states such as Tocantins, Roraima, Rio Grande do Norte, Espírito Santo and Mato Grosso do Sul, observed in this paper, points to potential issues of under-registration of deaths, mainly in the North and Northeast regions, where the coverage of deaths in states is 85.4% and 88.9%, respectively.20
Epidemiol.
S
erv.
Sau
de
, B
rasília,
26(1),
J
an-Mar 2017
C
ar
olina Cândida da C
unha et al.
Table 4 – Signee of the investigated ill-defined causes of death, according to macroregions and Federation Units (UF), Brazil, 2010
Macroregions and UF
Physician from hospitals and other
health facilities a Physician from the Forensic Institute Physician from the Death Verification Service Other Ignored Total
N % N % N % N % N % N
Brasil 7,414 25.1 5,804 19.7 2,174 7.4 5,048 17.1 9,047 30.7 29,487
North 406 20.6 183 9.3 119 6.0 407 20.6 859 43.5 1,974
Rondônia 65 36.5 25 14.1 24 13.5 33 18.5 31 17.4 178
Acre 29 11.8 10 4.1 1 0.4 14 5.7 192 78.0 246
Amazonas 15 13.9 30 27.8 – – 28 25.9 35 32.4 108
Roraima 2 50.0 1 25.0 – – – – 1 25.0 4
Pará 182 18.7 49 5.0 5 0.5 223 22.9 514 52.9 973
Amapá – – 1 100.0 – – – – – – 1
Tocantins 113 24.4 67 14.4 89 19.2 109 23.5 86 18.5 464
Northeast 1,721 15.0 1,732 15.1 371 3.2 1,225 10.7 6,441 56.0 11,490
Maranhão 52 33.5 5 3.2 8 5.2 20 12.9 70 45.2 155
Piauí 52 13.6 2 0.5 4 1.0 40 10.5 284 74.4 382
Ceará 371 25.8 75 5.2 154 10.7 278 19.3 562 39.0 1,440
Rio Grande do Norte 41 37.3 17 15.5 10 9.1 27 24.5 15 13.6 110
Paraíba 121 12.8 28 3.0 14 1.5 123 13.0 659 69.7 945
Pernambuco 389 31.3 225 18.1 37 3.0 186 15.0 406 32.6 1,243
Alagoas 70 17.2 9 2.2 3 0.7 64 15.7 262 64.2 408
Sergipe 186 14.0 39 2.9 97 7.3 187 14.1 818 61.7 1,327
Bahia 439 8.0 1,332 24.3 44 0.8 300 5.5 3,365 61.4 5,480
Southeast 4,182 36.7 3,019 26.5 486 4.3 2,426 21.3 1,287 11.2 11,400
Minas Gerais 657 24.2 987 36.4 188 7.0 277 10.2 602 22.2 2,711
Espírito Santo 77 20.7 185 49.7 5 1.3 52 14.0 53 14.3 372
Rio de Janeiro 2.771 54.5 540 10.7 20 0.4 1,343 26.4 406 8.0 5,080
São Paulo 677 20.9 1,307 40.4 273 8.4 754 23.3 226 7.0 3,237
South 823 29.5 629 22.6 256 9.2 709 25.4 370 13.3 2,787
Paraná 331 30.0 218 19.7 180 16.3 233 21.1 142 12.9 1,104
Santa Catarina 43 17.5 45 18.3 12 4.9 98 39.8 48 19.5 246
Rio Grande do Sul 449 31.2 366 25.5 64 4.5 378 26.3 180 12.5 1,437
Midwest 282 15.4 241 13.1 942 51.3 281 15.3 90 4.9 1,836
Mato Grosso do Sul 51 36.2 42 29.8 19 13.4 20 14.2 9 6.4 141
Mato Grosso 150 26.5 129 22.8 28 5.0 209 37.0 49 8.7 565
Goiás 39 3.8 46 4.5 891 86.3 25 2.4 31 3.0 1,032
Federal District 42 42.9 24 24.5 4 4.1 27 27.5 1 1.0 98
Epidemiol. Serv. Saude, Brasília, 26(1), Jan-Mar 2017 Investigation of ill-defined causes of death in Brazil
and, consequently, a decrease of IDCD.21 In Rio de Janeiro-RJ, a study on the evolution of registers of deaths due to violence, based on the period from 2000 to 2009, showed that the rise in undetermined causes corresponded mostly to unrecognized homicides, which brought to light issues on the quality of data.22
Moreover, in this study, we observed that, in the state capitals, the percentage of investigations conducted was higher than in the states as a whole. However, it was exactly outside of the capitals where there were the highest percentages of IDCD and, therefore, a greater need for investigation.
The result of investigations can be verified when analyzing the percentage of investigated deaths which were reclassified in their underlying cause: higher than 80% of deaths in five states and higher than 50% in fifteen states. Studies showed that the use of the verbal autopsy form for investigating IDCD enabled the clarification of underlying cause in approximately 80% of the investigated deaths.2,23
The investigation of IDCD with subsequent reclassification of underlying cause in states of the North and Northeast regions, with a significant decrease in the percentage of IDCD, reassures the importance of these investigations.13
However, in some states from the North region, such as Roraima and Amapá, there was an unexpected rise in this percentage, which suggests the existence of issues on the quality of data registered at SIM.
With regard to the place of occurrence of death, there was a higher percentage of investigated IDCD that occurred in households (54%); in the North and Northeast regions, this information was compatible with the high occurrence of household IDCD in these regions. On the other hand, the fact that more than 50% of investigated IDCD in the Southeast and Midwest regions have occurred in hospitals or health establishments is worrisome. In these places, patients are expected to have access to medical care and, therefore, have a lower percentage of IDCD in death certificates. These data can indicate issues on stating the cause of death in these institutions. Studies conducted in Brazilian municipalities showed that the IDCD certificate could be avoided in many deaths if physicians sought complementary information in medical records, indicating that available information was not completely used to clarify the death causes.3,24 Therefore, it
is extremely important for the physician to raise awareness on the relevance of the death certificate, through actions of continued training which allow a complete and correct filling in of the document, in a way that these professionals
are able to specify in the DC the conditions and causes that led to death, placing the underlying cause and its complications in the correct fields.3,11
A possible explanation for the high percentage of IDCD attested in the IFM and SVO can be found in flowcharts and procedures to issue the DC and notification of underlying cause in these services. In some places, it is possible that the issuing of the DC and the underlying cause were determined through necropsy exams. Therefore, the underlying cause of death registered in the DC will be the IDCD. Later, when the underlying cause is clarified after results of examination, this new underlying cause should be uploaded at SIM as the result of investigation, and then the underlying cause will be changed in the system, which may not happen every time. This way, it is essential that the health departments search for results of necropsies for improving data on causes of death. These findings reinforce the importance of establishing flows and procedures related to information on deaths declared by these services.
The fact that roughly one third of investigated deaths did not have the information regarding the section signee filled in in the DC and, consequently, not informed at SIM, shows one more possible contribution of IDCD investigation. If there was death investigation and a later reclassification of the underlying cause by a physician, it is important that the new signee is registered in the system, as it is already done for the underlying cause of death.
Epidemiol. Serv. Saude, Brasília, 26(1), Jan-Mar 2017
Carolina Cândida da Cunha et al.
Authors’ contributions
Cunha CC and França E contributed to the conception and design of the study, organization of database, analyses and interpretation of results and manuscript drafting.
Teixeira R contributed to the conception of the study, organization of database, analyses and interpretation of results. All authors have approved the final version of the manuscript and declared to be responsible for all aspects of the study, ensuring its accuracy and integrity.
1. Teixeira CLS, Klein CH, Bloch KV, Coeli CM. Reclassificação dos grupos de causas prováveis dos óbitos de causa mal definida, com base nas Autorizações de Internação Hospitalar no Sistema Único de Saúde, Estado do Rio de Janeiro, Brasil. Cad Saude Publica. 2006 jun;22(6):1315-24.
2. Campos D, França E, Loschi RH, Souza MFM. Uso da autópsia verbal na investigação de óbitos com causa mal definida em Minas Gerais, Brasil. Cad Saude Publica. 2010 jun; 26(6):1221-33.
3. Jorge MHPM, Laurenti R, Gotlieb SLD. O Sistema de Informações sobre Mortalidade - SIM: concepção, implantação e avaliação. In.: Ministério da Saúde; Organização Pan-Americana de Saúde; Fundação Oswaldo Cruz. A experiência brasileira em sistemas de informação em saúde. Brasília: Ministério da Saúde; 2009. (Série B. Textos Básicos de Saúde). v. 1. p. 71-107.
4. França E, Teixeira R, Ishitani L, Duncan BB, Cortez-Escalante JJ, Morais Neto OL, et al. Ill-defined causes of death in Brazil: a redistribution method based on the investigation of such causes. Rev Saude Publica. 2014 Aug; 48(4):671-81.
5. Mathers CD, Vos T, Lopez AD, Salomon J, Ezzati M, editors. National burden of disease studies: a practical guide. Geneva: World Health Organization; 2001. [cited 2016 Aug 04 ]. Avaliable from: http://www.who. int/healthinfo/nationalburdenofdiseasemanual.pdf 6. Ministério da Saúde (BR). Sistemas de Informações
sobre Mortalidade (SIM) e Nascidos Vivos (SINASC) para os profissionais do Programa de Saúde da Família. 2. ed. rev. atual. Brasília: Ministério da Saúde; 2004. (Série F. Comunicação e Educação em Saúde). 7. Ministério da Saúde (BR). Monitoramento da acurácia dos sistemas de informações sobre mortalidade e nascidos vivos. In: Anais da 3ª Expoepi: Mostra Nacional de Experiências Bem-sucedidas em Epidemiologia, Prevenção e Controle de Doenças [Internet]; 2003 nov 18-21; Salvador. Brasília: Ministério da Saúde, 2004 [citado 2016 ago 04]. 216 p. (Série D. Reuniões e Conferências).
2004. Disponível em: http://bvsms.saude.gov.br/bvs/ publicacoes/anais_3expoepi.pdf
8. Brasil. Ministério da Saúde. Portaria nº 116, de 11 de fevereiro de 2009. Regulamenta a coleta de dados, fluxo e periodicidade de envio das informações sobre óbitos e nascidos vivos para os Sistemas de Informações em Saúde sob gestão da Secretaria de Vigilância em Saúde. Diário Oficial da República Federativa do Brasil, Brasília (DF), 2009 fev 12;Seção 1:37.
9. Brasil. Ministério da Saúde. Portaria nº 3252, de 22 de dezembro de 2009. Aprova as diretrizes para execução e financiamento das ações de Vigilância em Saúde pela União, Estados, Distrito Federal e Municípios e dá outras providências. Diário Oficial da República Federativa do Brasil, Brasília (DF), 2009 dez 23;Seção 1:65. 10. Frias PG, Pereira PMH, Andrade CLT, Lira PIC,
Szwarcwald CL. Avaliação da adequação das informações de mortalidade e nascidos vivos no Estado de Pernambuco, Brasil. Cad Saude Publica. 2010 abr;26(4):671-81.
11. Ministério da Saúde (BR). Secretaria de Vigilância em Saúde. Departamento de Análise de Situação de Saúde. Manual de instruções para o preenchimento da declaração de óbito. Brasília: Ministério da Saúde; 2011.(Série A. Normas e Manuais Técnicos). 12. Brasil. Ministério da Saúde. Portaria nº 1.405 de 29 de
junho de 2006. Institui a Rede Nacional de Serviços de Verificação de Óbito e Esclarecimento da Causa Mortis (SVO). Diário Oficial da República Federativa do Brasil, Brasília (DF), 2006 jun 30;Seção 1:242.
13. Ministério da Saúde (BR). Secretaria de Vigilância em Saúde. Departamento de Análise de Situação de Saúde. Manual para investigação do óbito com causa mal definida. Brasília: Ministério da Saúde; 2009. 48 p. (Série A. Normas e Manuais Técnicos).
14. World Health Organization. Verbal autopsy standards: ascertaining and attributing cause of death. Geneva: World Health Organization; 2007 [cited 2016 Aug 4]. Available from: http://apps.who.int/iris/ bitstream/10665/43764/1/9789241547215_eng.pdf
Epidemiol. Serv. Saude, Brasília, 26(1), Jan-Mar 2017 Investigation of ill-defined causes of death in Brazil
15. Souza MFM, Barea V, Williams D. Improving the mortality information in poor areas: the Brazilian experience. Proceedings of the WHO Family of International Classifications – WHO-FIC; 2007 Oct 28- Nov 3; Trieste, Italy.
16. Instituto Brasileiro de Geografia e Estatística. Censo demográfico 2010 [Internet]. Rio de Janeiro: Instituto Brasileiro de Geografia e Estatística; 2011 [citado 2016 ago 04]. Disponível em: http://www.ibge.gov.br/ home/estatistica/populacao/censo2010/default.shtm 17. Ministério da Saúde (BR). Secretaria de Gestão
Estratégica e Participativa. Departamento de Articulação Interfederativa. Caderno de diretrizes, objetivos, metas e indicadores: 2013 – 2015. 2. ed. 156 p.: il. – (Série Articulação Interfederativa; v. 1) 18. Lima EEC, Queiroz BL. Evolution of the deaths registry
system in Brazil: associations with changes in the mortality profile, under-registration of death counts, and ill-defined causes of death. Cad Saude Publica. 2014 ago;30(8):1721-30.
19. Ministério da Saúde (BR). Secretaria de Vigilância em Saúde. Departamento de Análise de Situação de Saúde. Saúde Brasil 2011: uma análise da situação de saúde e a vigilância da saúde da mulher. Brasília: Ministério da Saúde; 2012. 444 p.: il.
20. Szwarcwald CL, Frias PG, Souza Júnior PRB, Almeida WS, Morais Neto OL. Correction of vital statistics based on a proactive search of deaths and live births: evidence from a study of the North and Northeast regions of Brazil. Population Health Metrics. 2014 Jun;12:16.
21. Abreu DMX, Sakurai E, Campos LN. A evolução da mortalidade por causas mal definidas na população idosa em quatro capitais brasileiras, 1996-2007. Rev Bras Estud Popul. 2010 jan-jun;27(1):75-88. 22. Cerqueira D. Mortes violentas não esclarecidas e
impunidade no Rio de Janeiro. Econ Apl. 2012 abr-jun;16(2):201-35.
23. França EB, Cunha CC, Vasconcelos AMN, Escalante JJC, Abreu DX, Lima RB, et al. Avaliação da implantação do programa "Redução do percentual de óbitos por causas mal definidas" em um estado do Nordeste do Brasil. Rev Bras Epidemiol. 2014 jan-mar;17(1):119-34.
24. Jorge MHPM, Gotlieb SLD, Laurenti R. O sistema de informações sobre mortalidade: problemas e propostas para o seu enfrentamento I: mortes por causas naturais. Rev Bras Epidemiol. 2002 ago;5(2):197-211.
Received on 13/07/2015