Signaling
Matthias Jeschke, Stephan Baumga¨rtner, Stefan Legewie*
Institute of Molecular Biology (IMB), Mainz, Germany
Abstract
Cells reliably sense environmental changes despite internal and external fluctuations, but the mechanisms underlying robustness remain unclear. We analyzed how fluctuations in signaling protein concentrations give rise to cell-to-cell variability in protein kinase signaling using analytical theory and numerical simulations. We characterized the dose-response behavior of signaling cascades by calculating the stimulus level at which a pathway responds (‘pathway sensitivity’) and the maximal activation level upon strong stimulation. Minimal kinase cascades with gradual dose-response behavior show strong variability, because the pathway sensitivity and the maximal activation level cannot be simultaneously invariant. Negative feedback regulation resolves this trade-off and coordinately reduces fluctuations in the pathway sensitivity and maximal activation. Feedbacks acting at different levels in the cascade control different aspects of the dose-response curve, thereby synergistically reducing the variability. We also investigated more complex, ultrasensitive signaling cascades capable of switch-like decision making, and found that these can be inherently robust to protein concentration fluctuations. We describe how the cell-to-cell variability of ultrasensitive signaling systems can be actively regulated, e.g., by altering the expression of phosphatase(s) or by feedback/feedforward loops. Our calculations reveal that slow transcriptional negative feedback loops allow for variability suppression while maintaining switch-like decision making. Taken together, we describe design principles of signaling cascades that promote robustness. Our results may explain why certain signaling cascades like the yeast pheromone pathway show switch-like decision making with little cell-to-cell variability.
Citation:Jeschke M, Baumga¨rtner S, Legewie S (2013) Determinants of Cell-to-Cell Variability in Protein Kinase Signaling. PLoS Comput Biol 9(12): e1003357. doi:10.1371/journal.pcbi.1003357
Editor:Jason M. Haugh, North Carolina State University, United States of America
ReceivedMay 13, 2013;AcceptedOctober 6, 2013;PublishedDecember 5, 2013
Copyright:ß2013 Jeschke et al. This is an open-access article distributed under the terms of the Creative Commons Attribution License, which permits unrestricted use, distribution, and reproduction in any medium, provided the original author and source are credited.
Funding:This work is supported by the BMBF (Virtual Liver Network; e:bio junior group program). The funders had no role in study design, data collection and analysis, decision to publish, or preparation of the manuscript.
Competing Interests:The authors have declared that no competing interests exist.
* E-mail: [email protected]
Introduction
External stimuli typically induce cellular responses by binding to cell surface receptors. Intracellular signaling networks transduce the signal, ultimately triggering gene expression responses in the nucleus. The basic building blocks of eukaryotic signaling networks are protein kinase cascades (Figure 1A): The signaling proteins in the cascade act as enzymes (‘‘kinases’’) that catalyze the activation of downstream kinases by phosphorylation. Information is thus transmitted along the cascade by consecutive phosphorylation reactions (Figure 1A). The proto-typical example for such a signaling cascade is the conserved mitogen-activated protein kinase (MAPK) pathway which consists of three kinases (Raf, Mek, Erk) [1].
Signaling cascades can transduce information in different ways [2,3]. The activity of the terminal kinase may quantitatively reflect the concentration of the extracellular stimulus, and the cascade is termed to behave gradually (or analog) in this case. Alternatively, the cascade may act as an ultrasensitive switch that responds in a digital (‘‘all-or-none’’) manner: low background signals are strongly dampened and rejected, while amplification and cellular commitment occur once a threshold stimulus is reached. Ultrasensitive signaling cascades therefore act as cellular decision making devices. Theoretical studies revealed that minimal models of multi-step protein kinase cascades show gradual dose-response behavior at steady state [4]. Ultrasensitive decision making
requires additional regulation mechanisms which increase the steepness of the dose-response curve, e.g., strong enzyme saturation in the (de)phosphorylation reactions (‘‘zero-order ultrasensitivity’’), multisite phosphorylation, competitive inhibi-tion, or positive feedback [3,5].
The dose-response curve of a signaling pathway relates the signaling activity to the amount of extracellular stimulus applied. The dose-response curve of signaling pathways is typically sigmoidal in shape and can be quantitatively described by the so-called Hill equation (y(S)~ymaxSn=(SnzKn
m), withy(S)as the
response to the stimulus S). The half-maximal stimulus (Km)
characterizes the stimulus concentration where the signal reaches 50% of its maximal activation level, and is thus a measure of the pathway sensitivity towards extracellular stimulation. The maxi-mal activation level (ymax) describes how strongly the terminal
kinase can be activated upon very strong stimulation, thereby reflecting amplification or dampening potential of the cascade. The Hill coefficient n determines how steeply the pathway responds to external stimulation: the signaling cascade shows gradual behavior forn&1, while ultrasensitive decision making is observed forn&1. In the limit of very highnthe dose-response approaches a step-function and the pathway acts as a digital switch with the threshold stimulusS~Km.
population [6,7]. Biological mechanisms underlying signaling variability include cell density effects [8] and cell-to-cell variability in signaling protein expression [6,7,9]. In the latter case, the stochasticity of protein biosynthesis indirectly hampers the precision of intracellular information transmission. An alternative source of variability may be the stochastic dynamics of signaling pathways operating at low molecule numbers [10]. Stochastic signaling fluctuations are typically fast compared to subsequent gene expression responses, and therefore should not impinge significantly on cellular decision-making. The variability of most signaling systems can therefore be understood by considering them as deterministic system with fluctuating initial signaling protein concentrations [6,7,9]. Single-cell measurements reveal that the level of each signaling protein differs by a factor of three among the cells of a clonal population [11,12]. Thus, multi-component signaling systems may show strong variability, suggesting that regulation mechanisms exist which allow for variability suppression.
Cell-to-cell variability in the intracellular signaling pathway activity may be beneficial or deleterious depending on the biological system. Certain cellular responses such as apoptosis or differentiation should only be triggered in a subset of the cell population to maintain tissue homeostasis and to establish different cell lineages, respectively. The apoptosis and differentiation thresholds should thus be very different between individual cells and the system should exhibit strong variability [6,13]. In cancer therapy, such strong heterogeneity may adversely affect the population responsiveness to drugs, thereby leading to incomplete killing of tumor cells [14–16]. Invariance of signaling thresholds is expected to be important in embryonic development: according to the so-called ‘‘French-flag model’’, patterning is established by a single morphogen gradient that specifies multiple cell fates, each cell type requiring a different threshold morphogen concentration [17]. For sharp spatial boundaries to be established, signaling pathways that read of morphogen gradients should exhibit robust and invariant thresholds at which they respond. Similarly, a
cell-to-cell invariant signaling threshold has been reported for yeast cells that sense positioning in an extracellular pheromone gradient [18,19]. Low variability is also required for gradual signaling pathways which transduce information quantitatively. Taken together, the question arises how cellular systems are able to tune the variability of protein kinase signaling to ensure an appropriate response of the cell population.
In this work, we systematically characterize the cell-to-cell variability of protein kinase cascades. We focus on the dose-response behavior of signaling to investigate how synchronously a cell population responds to a change in a hormonal stimulus. We discuss how the variability can be actively modulated by parameter tuning, gene expression noise regulation or additional signaling mechanisms such as feedforward and feedback loops.
Results
1 Rationale
This work focuses on the cell-to-cell variability of protein kinase cascades. We study the general features of eukaryotic signaling pathways, but also try to specifically answer the question why the yeast pheromone pathway shows switch-like decision making with little cell-to-cell variability [18,19]. The pheromone pathway initiates the mating of two haploid yeast cells by triggering various cellular responses, one of which is the so-called shmoo, a cellular projection in the direction of the mating partner that primes for cell fusion [18,20]. Dose-response experiments with exogenously added pheromones revealed that shmooing occurs at a similar pheromone concentration for all cells in the population, implying that the signaling pathway shows little cell-to-cell variability [18,19,21]: The transition from no shmooing to complete shmooing of the whole cell population occurred within a 2-fold range of pheromone concentrations in one study [18], while others reported that the required pheromone increase is 4-fold [19] or 5-fold [21]. In this paper, we analyze the dose-response curves of signaling pathways to understand how a coordinated response of the whole cell population at a particular stimulus concentration can be realized. We study simplified models of signaling cascades with five levels to reflect the main steps of pheromone signaling, i.e., pheromone binding to a transmembrane receptor, receptor-mediated G protein activation and signal transduction through a three-tiered MAPK cascade [22].
We characterize the dose-response behavior at steady state. Steady state simulations imply that we focus on sustained signaling upon long-term stimulation and neglect the temporal features of the signal such as duration or area-under-curve. Steady state simulations likely provide physiologically relevant insights, because many cell fate decisions require ongoing signaling pathway activity over several hours [23]. Fast signaling events such as phosphor-ylation and dephosphorphosphor-ylation typically occur on a time-scale of minutes, and are thus expected to reach a (quasi-)steady state shortly after external stimulation.
Signaling dose-response curves may increase gradually and reflect the concentration of the extracellular stimulus, or the signaling pathway may act as an ultrasensitive switch that responds in a digital (‘‘all-or-none’’) manner (see Introduction). The shmooing of yeast cells is an all-or-none response [18]. Contra-dictory evidence exist in whether or not digital decision making already occurs at the level of MAPK signaling [18,21,24], but the pathway likely exhibits a certain degree of ultrasensitivity [20]. In this paper, we employ a bottom-up approach and initially study minimal signaling models with gradual dose-response curves, before turning to more complex systems capable of ultrasensitive signal transduction.
Author Summary
Cell-to-cell variability is introduced into the models by assuming fluctuations in initial signaling protein expression levels. In contrast to previous studies on variability [25], we neglect the intrinsic stochasticity of signaling cascades (cf. Introduction), and analyze deterministic models of kinase signaling using the framework of ordinary differential equations (ODEs). Experimen-tal studies suggest that all signaling protein concentrations vary simultaneously due to noise in protein biosynthesis rates [6,7,9]. Extrinsic noise sources, in particular signaling protein concentra-tion fluctuaconcentra-tions, are thought to be the main source of non-genetic
variability in yeast pheromone signaling [26] and in mammalian signaling pathways [6,7,27–29]. We applied two complementary strategies to understand how signaling protein expression noise gives rise to signaling heterogeneity. First, explicit cell-to-cell variability simulations were performed. All signaling protein concentrations were sampled from uncorrelated log-normal distributions, and the ODE system was solved for each set of sampled concentrations, yielding distributions in signaling path-way activity. Secondly, one-dimensional sensitivity analyses revealed the impact of individual signaling protein concentrations:
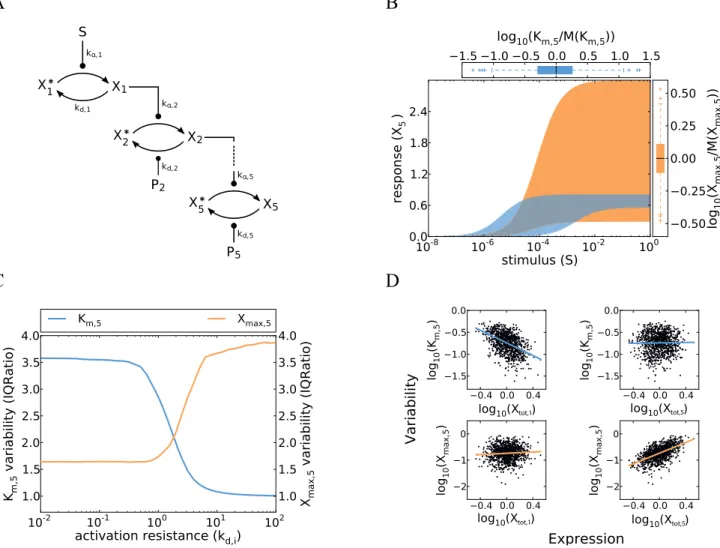
Figure 1. Cell-to-cell variability in a minimal model of a gradual kinase cascade. ASchematic representation of a five-step kinase cascade (S…extracellular stimulus; Xi and Xi…active and inactive kinases, respectively; Pi…phosphatases; ka,i and kd,i…phosphorylation and
dephosphorylation rate constants, respectively).BCell-to-cell variability simulations confirm strong heterogeneity in the gradual kinase cascade. Nine signaling protein concentrations (5 kinases, 4 phosphatases) were sampled from log-normal distributions (mXX^,i~mPP^,i~1; coefficient of
variation =s=m~0:35), and the dose-response curve was simulated using Eqs. 3 and 4 for a set of 1000 sampled protein concentrations. Low phosphatase activities were chosen to model a low activation resistance:ka,i~1,i~1,2. . .5,kd,1~1,kd,i~0:1,i~2,3,4,5(Supplemental Table S1). The blue and orange areas are enclosed by the dose-response curves which yielded the minimal/maximalKm,5andXmax,5, respectively. Box plots at
the top and right side represent the distributions ofKm,5andXmax,5, respectively (normalized by the population medians). These box plots indicate
the median (middle of box), the first and third quartile (box edges), the data points that lie within a distance of 1.5 interquartile ranges from the lower and higher quartiles (whiskers) and extreme outliers (crosses).CThe variabilities ofKm,5andXmax,5respond inversely to changes in kinetic parameter
values. Cell-to-cell variability simulations (similar to panelB) were repeated for various activation resistances in the cascade which were tuned by simultaneously changing the phosphatase rate constantskd,i,i~2,3,4(x-axis). The variabilities ofKm,5andXmax,5were analyzed for each parameter
configuration (y-axis) and expressed as inter-quartile ratios (IQRatio =Q3=Q1= ratio of the third quartile and the first quartile; related to the width of
the box plots shown inB). High inter-quartile ratios imply high cell-to-cell variability while an IQRatio of 1 corresponds to no variability. Similar results are obtained when using the coefficient of variation as a measure of variability (Figure S1).DUpstream signaling protein fluctuations determine the pathway sensitivity (Km,5) while downstream fluctuations control the maximal pathway activation (Xmax,5).Km,5andXmax,5were calculated for each
simulation run in panelBand related to the concentrations of the first and the terminal kinase in the same simulation. Each dot represents a simulation of a single cell, and the solid lines are linear fits to all points.
The ODE system was solved for varying levels of each signaling protein (keeping all other components constant). Signaling protein concentrations that had a strong impact on signaling pathway activity could be identified as major determinants of cell-to-cell variability.
Our results show that generic five-step protein kinase cascades exhibit much stronger cell-to-cell variability than the yeast pheromone pathway, unless certain robustness requirements are fulfilled.
2 Cell-to-cell variability of gradual protein kinase cascades
2.1 Gradual protein kinase cascades show strong cell-to-cell variability. Multi-step signaling cascades show a gradual dose-response behavior if the response of each individual cascade level is gradual as well [3,30]. A minimal model of a gradual signaling cascade can be implemented by assuming that enzyme saturation in the phosphorylation and dephosphorylation reactions at each level are negligible [4].
The following ordinary differential equation describes the temporal evolution of the active kinaseXi:
dXi
dt ~va,i{vd,i~ka,iXi{1(|fflfflfflfflfflfflffl{zfflfflfflfflfflfflffl}Xtot,i{Xi) Xi
{kd,iPtot,iXi ð1Þ
Each phosphorylation step is described as a reaction between the phosphorylated form Xi{1 of kinase i{1 and the non-phosphorylated form X
i of a downstream kinasei(Figure 1A).
The corresponding phosphorylation rate is given by the term va,i~ka,iXi{1Xiwhereka,iis the second-order rate rate constant
for phosphorylation of the i-th kinase. Similarly, the dephos-phorylation of the active form Xi is described by the rate
vd,i~kd,iPtot,iXi, with the dephosphorylation rate constant and
total phosphatase concentration designated as kd,i and Ptot,i,
respectively [4]. Equation 1 takes into account that the total kinase concentration at each level is constant, i.e., Xtot,i~
X izXi.
The steady state activity of each cascade level describing the activity upon long-term stimulation can be calculated by assuming that the kinase concentrations do not change over time (dXi=dt~0).
Xi~Xtot,i
Xi{1 Xi{1zKK~i
,KK~i~
kd,iPtot,i
ka,i
ð2Þ
This expression relates the activity of thei-th kinase to that of its upstream activator Xi{1, and therefore characterizes the local dose-response behavior of the cascade. It has the form of a Michaelis-Menten equation: Each cascade level may saturate if the kinase pool is fully phosphorylated (Xi~Xtot,i) and half-maximal
activation occurs when the kinase and phosphatase activities are equal(Xi{1~KK~i).
The cellular response to stimulation is determined by the global dose-response curve which relates the activity of the terminal cascade level to the concentration of the extracellular stimulusS.
By iteratively applying Eq. 2 and setting the stimulus to S~X0~const, one derives for the global dose-response curve of a five-step cascade (i~1,2,. . .5)
X5~Xmax,5 S SzKm,5
: ð3Þ
This Michaelis-Menten-like equation increases gradually for increasing concentrations of the stimulus S, confirming that the minimal cascade model shows gradual dose-response behavior. The parameterXmax,5 describes the maximal activation level of the pathway upon strong stimulation. Km,5 equals the stimulus concentration leading to half-maximal signaling, and thus reflects the pathway sensitivity to stimulation.Xmax,5andKm,5are lumped parameters that can be defined as
Xmax,5~
Xtot,5
1zK5zK5K4zK5K4K3zK5K4K3K2 ð4Þ
Km,5~K1
K5K4K3K2
1zK5zK5K4zK5K4K3zK5K4K3K2
K1~kd,1=ka,1 is the dissociation constant of receptor-ligand binding, and the remainingKiare proportional to the kinase and
phosphatase concentrations in the cascade,
Ki~ ~
K Ki
Xtot,i{1
~ kd,iPtot,i
ka,iXtot,i{1
,i~2,. . .,5, ð5Þ
To understand the cell-to-cell variability, we need to know how Xmax,5 and Km,5 depend on the total kinase and phosphatase concentrations. We initially analyze cell-to-cell variability for the case of weak stimulation (S%Km,5) where the pathway dose-response curve in Eq. 3 can be approximated by the following linear equation:
X5&Xmax,5
Km,5
S~ Xtot,5
K5K4K3K2K1
S: ð6Þ
The signaling activity upon weak stimulation is thus determined by the product of five kinase concentrations (Xtot,1,. . .,Xtot,5) divided by the product of four phosphatase concentrations (Ptot,2,. . .,Ptot,5). This implies that a weakly stimulated cascade exhibits strong cell-to-cell variability, because the product of fluctuating species shows much greater variability than either species alone. The total variance in the signaling output upon weak stimulation (s2X,5) equals the sum over all signaling protein
concentration variances (s2Xtot
,i for kinases ands 2
Ptot,i for
phospha-tases) (Supplemental Text S1).
s2X,5~(
X5
i~1
s2Xtot,izX
5
i~2
s2Ptot,i) ð7Þ
difference of cells with high and low signaling activities by dividing the third and first quartiles of the distribution (see Methods). Assuming realistic protein concentration fluctuations in Eq. 6, the IQ ratio only drops from 4.1 to 3.8 if the noise of 1 out of 9 signaling protein concentrations is eliminated, implying that the cell-to-cell variability remains essentially unchanged. (ii) the variability does not depend on the choice of the kinetic parameter values (Ki). Thus, the weakly stimulated gradual signaling
pathway always shows strong variability. Consistent with the expectation, we find that lesser variability may be observed upon strong stimulation(S&Km,5)whereX5&Xmax,5(see below).
The variability principles derived from the analytical model (Eq. 1–7) were confirmed by explicit cell-to-cell variability simulations. To this end, each of the nine protein concentrations in the cascade was sampled from a log-normal distribution with a coefficient of variation that matches the experimentally observed variability of eukaryotic protein expression [12]. Dose-response simulations were performed for each set of sampled protein concentrations, yielding cohorts of dose-response curves representing the cell population. Such a simulation is shown in Figure 1B, and cells with the highest and lowestXmax,5orKm,5are highlighted by the shaded areas. These cell-to-cell variability simulations confirm that the minimal gradual protein kinase cascade generally shows pronounced variability, especially at low-level stimulation.
2.2 A trade-off in controlling the variability of maximal pathway activation and pathway sensitivity. We investigat-ed how the variabilities of the maximal pathway activation (Xmax,5) and the pathway sensitivity (Km,5) depend on the kinetic parameters in the cascade. Xmax,5 and Km,5 are fully described by the lumped parameters Ki (Eq. 4). Each Ki equals the
phosphatase activity at a cascade level divided by the maximally possible kinase activity (Eq. 5). Thus,Kiquantifies the tendency of
a cascade level to be fully activated upon strong stimulation and can be considered as an activation resistance. A strong stimulus fully activates the pathway kinases only if all resistances are low (Ki%1).
We tuned the activation resistances (Ki) by simultaneously
changing all phosphatase activities, and performed cell-to-cell variability simulations (Figure 1C). For low phosphatase activity at each level (Ki%1), we observe little variance in the maximal
pathway activation, because only the concentration of the terminal kinase matters (Xmax,5&Xtot,5). At the same time, the pathway sensitivity is determined by the product of multiple protein concentrations (Km,5&K5K4K3K2K1), and therefore differs strong-ly between individual cells. In the opposite regime of high phosphatase activity at each level (Ki&1), we find that the pathway sensitivity is completely invariant between cells. This is because the receptor level saturates before the subsequent cascade steps, implying that the dose-response curve of the terminal kinase is aligned to the half-maximal saturation point of receptor-ligand binding (Km,5&K1). In this regime, the maximal activation level is, however, determined by all protein concentrations in the cascade and thus highly variable (Xmax,5&Xtot,5=K5K4K3K2). These simulations reveal that the variabilities of Km,5 and Xmax,5 are inversely related. The drop in the variability of Km,5 precisely matches the parameter range where the variability of Xmax,5 increases (Figure 1C). We show more generally in Supplemental Text S1 that Km,5 and Xmax,5 are inversely related for any parameter change in the signaling cascade. Thus, a trade-off exists in a simple gradual protein kinase cascade: either the pathway sensitivity or the maximal pathway activation can be made invariant by changing the kinetic parameter values. However, it is not possible to makeKm,5 andXmax,5 invariant at the same time.
The signaling variability could be reduced by lowering the expression noise of individual signaling proteins. We therefore investigated whether fluctuations in certain signaling protein concen-trations have particularly strong impact on the variabilities of the maximal pathway activation (Xmax,5) and the pathway sensitivity (Km,5). To this end, Xmax,5 and Km,5 were related to the signaling protein expression levels in single cells (Figure 1D). Cells with a high expression level of the terminal kinase (Xtot,5) tend to have a higher maximal pathway outputXmax,5than cells harboring low levels of the terminal kinase. No such correlation is observed for the kinase concentration at the first cascade level (Xtot,1). Thus, the downstream species tend to exert a stronger control on the maximal pathway output than the upstream species (see also Supplemental Text S1). In contrast, the pathway sensitivity is primarily determined by upstream species in the cascade: Cells tend to respond at lower ligand concentrations the higher the expression level of the first kinase (Xtot,1) is, and the concentrations of the downstream species play a lesser role in this respect (Figure 1D, top row; Supplemental Text S1). Taken together, we find that the maximal outputXmax,5 and the pathway sensitivity Km,5are controlled in a very different way. We show in Supplemental Text S1 that signaling protein concentrations with strongly control over Xmax,5 generally have lesser impact onKm,5 (and vice versa). Thus, while eitherXmax,5 orKm,5 can be made invariant by reducing the expression noise of certain signaling proteins, it is not possible to achieve invariance for both features at the same time.
The trade-off in the regulation ofKm,5andXmax,5has important ramifications for the control of intracellular signaling: Intracellular signaling regulators or pharmacological inhibitors acting upstream in the cascade primarily regulate the pathway sensitivity, whereas downstream regulators predominantly affect the maximal pathway activation. The strong and parameter-independent dose-response variability suggests that the simple gradual model is unable reflect the invariant dose-response behavior of the yeast pheromone pathway (see Rationale): all cells of the population respond upon strong stimulation if the activation resistances are low (Kiv1), but then the pathway sensitivity fluctuations are high, and the most sensitive cells respond at a,100-fold lower stimulus concentration than the least sensitive cells (Figure 1B).
2.3 Negative feedback regulation allows for the simultaneous invariance of maximal pathway activation and pathway sensitivity. Negative feedback regulation reduces the variability of biological systems [31–33]. In the following, we show that negative feedback resolves the above-mentioned robustness trade-off by simultaneously promoting the invariance of maximal pathway activation (Xmax,5) or pathway sensitivity (Km,5).
In the yeast pheromone pathway, the terminal kinase promotes the deactivation of the pathway by negatively regulating the G protein level [22,34], and this negative feedback loop has been reported to control the pathway sensitivity to stimulation [34]. We implemented negative feedback in a gradual five-step protein kinase cascade by assuming that the final kinase (X5) enhances the activity of the phosphatase at the second level (Figure 2A, solid red line). Most of the differential equations remain unchanged when compared to the basic model (Eq. 1), but the ODE for the second pathway level now reads:
dX2
dt ~ka,2X1(Xtot,2{X2){(1zkfbX n
5)kd,2Ptot,2X2 ð8Þ
cooperativity of negative feedback regulation (nw1: feedback with positive cooperativity). For pronounced feedback regulation, i.e., kfb&1, the steady state dose-response curve can be approximated
by (Supplemental Text S1):
X5&
ffiffiffiffiffiffiffiffiffiffiffiffiffiffiffiffiffiffiffiffiffiffiffiffiffiffiffiffiffi 1
kfb
Xtot,5 K5K4K3K2 (nz1)
s
|fflfflfflfflfflfflfflfflfflfflfflfflfflfflfflffl{zfflfflfflfflfflfflfflfflfflfflfflfflfflfflfflffl} Xmax,5
ffiffiffiffiffiffiffiffiffiffiffiffiffiffi S SzK1 (nz1)r
ð9Þ
In line with previous studies, we find that the kinase cascade with negative feedback regulation exhibits a shallower dose-response curve than the feedback-less system, because the stimulus S enters as the (nz1)-th root only [32,33,35]. The non-cooperative feedback system requires a ,420-fold increase in the stimulus level to switch from 10% to 90% of the maximal activation level, while an 81-fold increase is sufficient in the corresponding feedback-less cascade (Eq. 3). Negative feedback therefore extends the gradual mode of quantitative information
Figure 2. Cell-to-cell variability of kinase cascades with negative feedback. ASchematic representation of the five-step cascade with negative feedback acting upstream (red, solid) or downstream (red, dashed).X5either activates the phosphatase of the second or the fifth level.B
Cell-to-cell variability simulations confirm that negative feedback eliminates the variability of the pathway sensitivity (concepts similar to Figure 1B). Strong feedback was assumed and simulations were performed using Eq. 9 (parameters same as in Figure 1B; Supplemental Table S1). Colored box plots represent theKm,5 andXmax,5 distribution of the feedback model, while gray box plots show the behavior of the reference feedback-less
cascade (cf. Figure 1B). The inset shows that increasing the feedback cooperativity parametern(Eq. 8) decreasesXmax,5 variability, measured as
IQRatio (cf. Figure 1C).C–DNegative feedback abrogates the trade-off inKm,5andXmax,5invariance. Cell-to-cell variability simulations (similar to
panelB) were repeated for various parameter configurations for models with upstream feedback (C) or downstream feedback (D): activation resistances in the cascade were tuned by simultaneously changing the phosphatase rate constantskd,i,i~2,3,4(x-axis). The variabilities ofKm,5and Xmax,5were analyzed using the IQRatio as in Figure 1C, and similar results are obtained using the coefficient of variation (Figure S2).Km,5was defined
as the stimulus for a half-maximal pathway activation. The behavior of a feedback model with limited feedback strength (kfb~103; thick, solid lines) is compared to a feedback-less model (kfb~0; thin, dashed lines) and to a model with very strong feedback(kfb~1015; thin, solid lines). Simulations for moderate feedback strength (thick lines) were performed by numerically integrating the ODE systems (Eqs. 8 and 12), while the strong feedback calculations (thin solid lines) were done using analytical approximations (Eqs. 9 and 13).
transmission to a large stimulus concentration range, and the effect is more pronounced for cooperative feedback regulation(nw1).
Strong negative feedback reduces the cell-to-cell variability of the dose-response curve: The half-maximal stimulus of the cascade is proportional to the half-saturation point of receptor-ligand binding (K1), and completely independent of fluctuations in the signaling protein concentrations (cf. Figure 2B)
Km,5~ 1
2nz1{1K1 ð10Þ
This protein concentration insensitivity can be explained as follows: strong negative feedback shifts the speciesX2toX5to very low activation levels, implying that the downstream part of the cascade does not saturate. The dose-response curve of the cascade thus follows the receptor-ligand binding isotherm, though with a more gradual shape. Such pathway alignment to the receptor dose-response curve due to negative feedback has been observed experimentally in the yeast pheromone signaling cascade [34].
The effects of strong negative feedback on the maximal pathway activation variability are less pronounced. Assuming log-normally distributed gene expression noise, the variance ofXmax,5 can be derived from Eq. 9 and represented as a function of the signaling protein concentration variances (Supplemental Text S1)
s2max,5~ 1
(nz1)2(
X5
i~1
s2Xtot
,iz
X5
i~2
s2Ptot
,i) ð11Þ
TheXmax,5 variability is determined by the sum of all protein concentration variances, but is reduced by the feedback term (nz1)2. This result confirms previous observations showing that cooperative feedback(nw1)suppresses noise more efficiently than linear feedback [36].
The Xmax,5 and Km,5 variabilities of the feedback system are independent of the activation resistances in the cascade and low compared to a feedback-less cascade (thin solid and thin dashed lines in Figure 2C). Thus, negative feedback allows for the simultaneous invariance of the maximal pathway activation and the pathway sensitivity, thereby resolving the robustness trade-off of the feedback-less cascade. Moreover, the negative feedback system shows the same signaling variability for low and high stimulus levels (Eq. 9), implying that quantitative information transmission is possible over a very broad stimulus concentration range. These conclusions continue to hold for an equivalent negative feedback system, where the terminal kinaseX5 inhibits the activity ofX1, thereby controlling the phosphorylation reaction ofX2. This can be seen in the steady state conditiondX2=dt~0 (Eq. 8) which can be converted to the kinase inhibition case by division with the feedback term(1zkfbX5n).
We confirmed our findings concerning negative feedback regulation for more realistic feedback cascades with limited feedback strength kfb. Figure 2C shows that the moderate
feedback system shows a simultaneous invariance of maximal pathway activation (Xmax,5) and the pathway sensitivity (Km,5) over a finite range of activation resistances in the cascade (thick solid lines), and the variability tends to be lower than that of a feedback-less cascade (dashed lines). The strength of the feedback regulation kfb primarily affects the width of the compromise range where
Xmax,5 and Km,5 are simultaneously invariant: Limited feedback cannot perform any regulatory function for high activation resistances (Ki&1), becauseX5is barely activated in this regime.
Likewise, moderate feedback cannot efficiently counteract the strong signaling activity of a cascade with too low activation resistance (Ki%1).
2.4 Negative feedback loops acting upstream and downstream in the cascade control different aspects of the dose-response curve. Signaling cascades are often equipped with multiple negative feedback loops, some acting close to the receptor level, while others modulate the terminal cascade levels [23]. We investigated how the length of a negative feedback emanating fromX5 affects the dose-response behavior of the cascade. Consider a cascade with a short, downstream feedback, where X5 activates its own phosphatase (Figure 2A, dashed red line). Such downstream feedback regulation occurs in the yeast pheromone pathway, as Msg5, the phosphatase acting at the terminal cascade level, is transcriptionally induced upon stimulation [22,37]. Again, most of the ODEs remain unchanged when compared to the basic cascade model (Eq. 1), but the fifth pathway level reads:
dX5
dt ~ka,5X4(Xtot,5{X5){(1zkfbX
n
5)kd,5Ptot,5X5 ð12Þ
The steady state condition of the upstream feedback (dX5=dt~0) also describes an equivalent negative feedback system, where the terminal kinaseX5 inhibits the activity of its own activatorX4. This can be seen by dividing the steady state condition with the feedback term(1zkfbX5n). We again approx-imate the steady state for strong feedback (kfb&1) and obtain (Supplemental Text S1)
X5&
ffiffiffiffiffiffiffiffiffiffiffiffiffiffiffiffiffiffiffiffiffiffiffiffiffiffiffiffiffiffiffiffiffiffiffiffiffiffiffiffiffiffiffiffiffiffiffiffiffiffiffiffiffiffiffiffiffiffiffiffiffiffiffiffiffi 1
kfb
Xtot,5
K5(1zK4zK4K3zK4K3K2) (nz1)
s
|fflfflfflfflfflfflfflfflfflfflfflfflfflfflfflfflfflfflfflfflfflfflfflfflfflfflfflfflfflfflfflfflfflfflffl{zfflfflfflfflfflfflfflfflfflfflfflfflfflfflfflfflfflfflfflfflfflfflfflfflfflfflfflfflfflfflfflfflfflfflffl} Xmax,5
ffiffiffiffiffiffiffiffiffiffiffiffiffiffiffiffiffi S SzKm,4 (nz1)
s
ð13Þ
The steady state of X5 is proportional to the root of the Michaelis-Menten equation, and the dose-response curve is thus as shallow as that of the system with upstream feedback (Eq. 9). In similarity to Eq. 10, the half-saturation point of Eq. 13 is proportional to the half-maximal stimulus of X4 (i.e., Km,4). Downstream feedback thus eliminates the impact of the terminal level on the pathway sensitivity, but any variability arising between X1 and X4 is transmitted. Downstream feedback suppresses the variability of the maximal pathway activation, especially for high feedback cooperativity n (Eq. 13), and achieves the same or stronger Xmax,5 invariance when compared to the upstream feedback system (thin orange lines in Figure 2C and Figure 2D): this is because the upstream signaling protein concentrations (parametersK2,K3andK4) have a lower impact in Eq. 13 than in Eq. 9 if the phosphatase activities in the cascade are low(Ki%1).
We conclude that only upstream feedback efficiently suppresses Km,5 fluctuations, while downstream feedback has the stronger impact on the Xmax,5 variability. For both systems, increasing feedback cooperativitynselectively suppresses the Xmax,5 fluctu-ations.
We analyzed the downstream feedback model with limited feedback strength kfb (thick lines in Figure 2D). Moderate
Km,5 invariance at intermediate activation resistances. Moderate downstream feedback reducesKm,5 fluctuations to a much lesser extent than upstream feedback, while having a slightly more pronounced effect on the Xmax,5 variability (Figure 2C and Figure 2D). Taken together, upstream and downstream feedback loops differentially control the dose-response behavior also at moderate feedback strengths, although the differences are less pronounced compared to the case of strong feedback (Figure 2C and Figure 2D).
Our models predict that upstream negative feedback in the pheromone pathway may contribute to the invariant shmooing threshold, while downstream negative feedbacks may primarily ensure that all cells exhibit a similar maximal activation upon strong stimulation. One limitation of the negative feedback models is their shallow dose-response behavior which is inconsistent with the reported ultrasensitivity of the pheromone pathway [18,20,21]. We turn to ultrasensitive signaling cascades in the following to study more realistic models of yeast pheromone sensing.
3 Cell-to-cell variability of ultrasensitive signaling cascades
The term ultrasensitivity describes signaling cascades with steep, sigmoidal dose-response curves that allow for all-or-none decision making. Ultrasensitive behavior has been reported for the yeast pheromone pathway, although the steepness of the dose-response curve differs between literature reports [18,20,21]. Various molecular mechanisms establish ultrasensitivity in signaling cascades, e.g., double phosphorylation or competitive inhibition [3,38]. In this work, we neglect the mechanistic details underlying ultrasensitive regulation, and represent ultrasensitivity at one or more cascade levels by the Hill equation (see below). This modeling approach allows us to study the propagation of variability in ultrasensitive signaling cascades.
Two strategies exist to establish a very steep overall dose-response curve in a signaling cascade: Firstly, the all-or-none behavior may be primarily established at a single level, while the rest of the cascade shows gradual behavior (in isolation). Localized switching at the terminal cascade level has been reported for the yeast mating pathway [18]. Secondly, switching may be distrib-uted over multiple steps, i.e., each cascade level exhibits mild ultrasensitivity in isolation and cascade amplification effects ensure that the overall dose-response curve is very steep. Such behavior has been observed for the MAPK cascade in Xenopus oocytes [39], and is likely to be relevant for other MAPK cascades like the yeast pheromone pathway. The following discussion of cell-to-cell variability will initially focus on the second mode of distributed ultrasensitive decision making, before turning to the case of focused switching at a single level.
3.1 Ultrasensitive cascades with distributed switching can be inherently invariant. Multi-step signaling cascades are capable of strong ultrasensitivity amplification, implying that a combination of multiple weak switches establishes a very steep overall dose-response curve. To simplify the mathematical analysis, we initially analyze a two-step signaling cascade with ultrasensitivity at each level
X1~Xtot,1 Sn
SnzKK~n 1
ð14Þ
X2~Xtot,2 Xn
1 Xn
1zKK~2n :
The steady state of each cascade level is represented by the Hill equation, which has a structure analogous to the local dose-response behavior of a gradual signaling cascade (Eq. 2). The maximal activation of each cascade level equals the total concentration of the respective kinase (Xtot,i), and the half-saturation point is determined by
the parametersKK~1andKK~2.KK~iequals the equivalence point of kinase
and phosphatase activities in ultrasensitive (de)phosphorylation systems, and is thus determined by the concentration of a phosphatase [5]. Ultrasensitive, sigmoidal dose-response behavior can be observed for Hill coefficientsnw1.
We analyzed the overall dose-response curve relating the signaling output X2 to the stimulus S, and found that the ultrasensitive behavior is amplified along the cascade (Supple-mental Text S1). Assuming a low phosphatase activity at the second level (KK~2%Xtot,1), the threshold where the system switches from low to high activation is given by
Km,2~KK~1 ffiffiffiffiffiffiffiffiffiffiffi
~
K K2 Xtot,1 n s
~K1 ffiffiffiffiffiffi K2 n p
: ð15Þ
The activation resistancesK1andK2are defined in Eq. 5. The threshold depends in a less-than linear manner on the kinase and phosphatase concentrations controlling the second level (K2), thus showing little variability. At the same time, the maximal activation level depends the concentration of the terminal kinase only (Xmax,2~Xtot,2) and shows partial invariance as well. The ultrasensitive system thus shows a less pronounced robustness trade-off when compared to the gradual system, and can simultaneously show little variability ofXmax,2andKm,2.
Numerical simulations were performed for a five-step signaling cascade, where each level was modeled using a Hill equation with n = 2 (similar to Eq. 14). The five-step signaling cascade exhibits very strong ultrasensitivity if low phosphatase activities are assumed for all cascade levels (Figure 3A; Ki%1). The system shows little cell-to-cell variability, as all cells respond in a switch-like manner within a,3-fold range of stimulus concentrations. As with the two-step cascade, the threshold in these cell-to-cell variability simulations is almost exclusively determined by the upstream signaling species:Km,5 correlates well with the concen-tration of the first kinase(Xtot,1), but not with signaling protein concentrations controlling subsequent cascade steps (Figure 3B).
The inherent invariance of the ultrasensitive system can be understood intuitively by considering an extreme case scenario, where each cascade level is a very steep switch (n&1): In this case,
all downstream cascade levels simultaneously respond as soon as the first level is switched on. The system thus behaves like a chain of dominos, and the threshold of the first level sets the threshold of the whole cascade. The phenomenon is less pronounced for the case of moderate switching at each step, so that the downstream protein concentrations still matter to some extent (Eq. 15).
We conclude that the coordinated switching of the whole yeast cell population within a,3-fold range of pheromone concentra-tions could be explained based on the ultrasensitive model with distributed switching (Figure 3A). The prediction of local ultrasensitivity which is then amplified along the cascade could be tested experimentally by measuring and relating the dose-response curves of several kinases in the cascade.
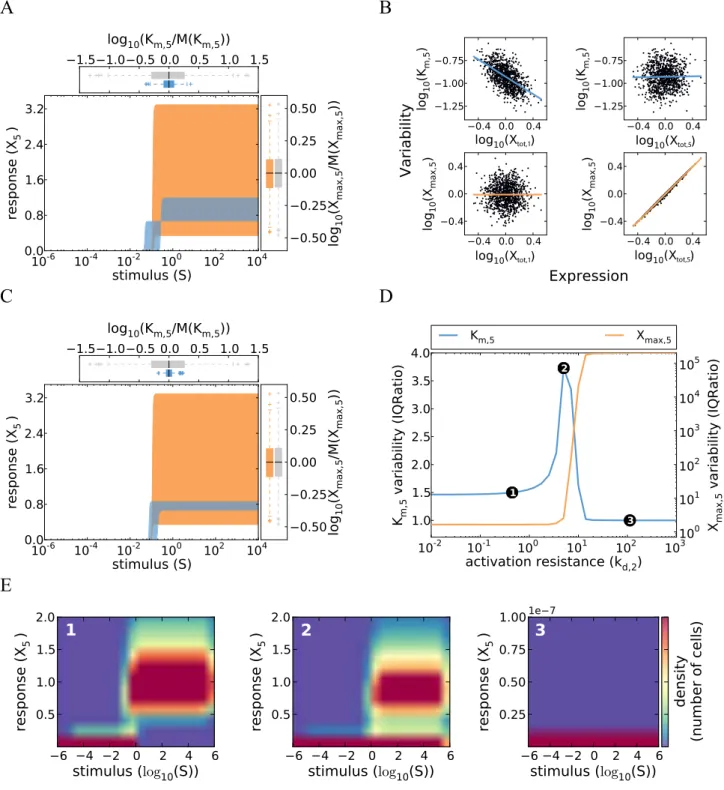
Figure 3. Cell-to-cell variability of kinase cascades with distributed ultrasensitive switching. ASimulations of a cascade with distributed ultrasensitive switching and low activation resistance shows a steep response with little variability inKm,5(defined as the stimulus for a half-maximal
pathway activation). The simulations of the five-step cascade were performed by iteratively applying the Hill equation describing the steady state of each level (similar to Eq. 14). The concepts and parameter values correspond to Figure 1B, with a Hill coefficientni~2,i~1,2,. . .5(Supplemental Table S1). Colored box plots represent theKm,5andXmax,5distribution of the ultrasensitive model, while gray box plots show the behavior of the
reference gradual cascade (cf. Figure 1B).BKm,5 is strongly controlled by the first kinase concentration, whereasXmax,5 primarily responds to
fluctuations in the terminal kinase (concept similar to Figure 1D).CSimulations of a cascade with distributed ultrasensitive switching show that the threshold variability can be reduced by coregulating the first level kinase (Xtot,1) and second level phosphatase (Ptot,2) concentrations. Correlation was
modeled by introducing a proportional relationship between both concentrations.D–EThe variabilities ofKm,5andXmax,5were analyzed using the
IQRatio as in Figure 1C, but plotted against changes in the kinetic parameter value for only the second level phosphatase (kd,2). Similar results are
obtained using the coefficient of variation as a measure of variability (Figure S3). The markers 1–3 correspond to the respective dose-response density plots shown inE. A high density (red) corresponds to a high number of cells showing a particular stimulus-response relationship. Three modes of variability are visible inE: 1) for low resistance values, the variability inKm,5is low and all cells are able to respond to stimulation; 2) the variability
increases at intermediate resistance levels, because only a fraction of the cells respond while the remaining cells do not even for high stimulus values; 3) in case of a high activation resistance no cell is able to respond.
could be reduced by correlating the fluctuations of the respective kinase and phosphatase concentrations. Such correlated fluctua-tions may be realized in the yeast pheromone pathway, because the pheromone receptor Ste2 and the antagonizing G protein deactivator Sst2 are transcriptionally co-regulated by the tran-scription factor Ste12 [22,37]. In Figure 3C, we simulated the five-step signaling cascade with moderate switching at each level, and introduced correlated fluctuations between the first kinase concentration (Xtot,1) and the antagonizing second phosphatase concentration (Ptot,2). We find that this system exhibits less variability when compared to the uncorrelated case, as all cells respond in a switch-like manner within a,2-fold range of stimulus concentrations (compare Figure 3A and Figure 3C). Experimental work supports that correlated fluctuations in upstream kinase and phosphatase concentrations reduce the variability of mammalian MAPK signaling [7]. We propose to simultaneously measure the expression levels of fluorescently labeled Ste2 and Sst2 in single-cells to confirm that a similar mechanism promotes the invariance of yeast shmooing.
Correlated fluctuations in a single kinase-phosphatase pair would also promote invariance in gradual signaling cascades, but only to a minor extent, because the remaining seven protein concentration variabilities still enter the signaling activity upon weak stimulation in an additive manner (Eqs. 6 and 7): The cell-to-cell variability of a gradual cascade with realistic protein concentration fluctuations, quantified as the inter-quartile ratio (see Methods), only drops from 4.1 to 3.5 if a perfect correlation is introduced for a single kinase-phosphatase pair. This suggests that correlations in upstream signaling protein concentrations specif-ically promote the robustness of ultrasensitive systems.
A way to increase the variability of the ultrasensitive cascade relative to Figure 3A is kinetic parameter tuning, e.g., by increasing the activity of certain phosphatases. Figure 3D shows the variabilities of maximal pathway activation (Xmax,5) and the pathway sensitivity (Km,5) for varying phosphatase expression at the second level. Both variabilities clearly increase for increasing phosphatase expression, and the variance of Km,5 peaks at intermediate levels. Increasing phosphatase expression introduces heterogeneity because a fraction of the cell population becomes completely insensitive to stimulation. This can be seen in Figure 3E, where the dose-response curve distributions of the cell population are indicated by density plots for different phosphatase levels. For instance, at intermediate phosphatase levels, half of the cells do not respond at all to stimulation, while the remainder shows essentially complete activation ofX5(Figure 3E, panel 2). Thus, increasing phosphatase expression introduces heterogeneity, because the system switches from a strong and synchronous response of the whole population to a strong response in only a fraction of cells. The Km,5 variability peaks at intermediate phosphatase activities, because the stimulus level required for half-maximal activation is different in responding and non-responding cells (not shown). At very high phosphatase levels, the population only consists of non-responders, thus again showing less variability (Figure 3E, panel 3).
3.3 Ultrasensitive signaling cascades with switching at a single step show strong variability. Switch-like decision making may also be established if a single cascade level shows a very steep dose-response curve. Such a localized switch has been reported for the yeast mating pathway [18]: The scaffold protein Ste5 co-localizes members of the MAPK cascade, and its activity is regulated by a multisite dephosphorylation mechanism, thereby promoting the switch-like phosphorylation of the terminal MAPK cascade member Fus3. We mimic this scenario by assuming that the terminal cascade levelX
5 is phosphorylated byX4 in a
switch-like manner, whereas the upstream part of the pathway (X1{X4)shows gradual behavior. In similarity to Eq. 3 the steady state ofX4can be written as
X4~Xmax,4 S SzKm,4
ð16Þ
The switch-like dose-response at the terminal level (X5) may be represented by the Hill equation :
X5&Xtot,5 Xn
4 Xn
4zKK~5n
: ð17Þ
The thresholdKK~5 determines the equivalence point of kinase and phosphatase activities at the fifth level, and is proportional to the concentration of the phosphataseP5. We performed cell-to-cell variability simulations of this system assuming a high Hill coefficient n (Figure 4A), and investigated how the variabilities of maximal pathway activation and threshold stimulus depend on the kinetic parameter values (Figure 4B). Increasing phosphatase expression shifts the system from complete switching of the whole cell population to incomplete switching of only a fraction of cells, reminiscent of the cascade with distributed switching (Figure 3E). Cells only respond to stimulation if the maximal activation level of X4 is larger than the Hill equation threshold(Xmax,4wKK~5). The single-switch system shows strong variability even for low phosphatase activities in the cascade, because seven signaling protein concentrations jointly determine the signaling threshold (Supplemental Text S1). The simulated signaling thresholds vary over three orders of magnitude as long as all cells of the population respond strongly to stimulation (Figure 4A), implying that the single switch system cannot explain the experimentally observed invariance of the shmooing threshold (see Rationale). We show in the following that invariance can be realized if the single-switch model is extended by feedback or feedforward loops.
3.4 Suppression of signaling threshold variability by basal transcriptional feedback. Negative feedback diminish-es the variability of signaling cascaddiminish-es, though at the cost of a reduced steepness of the dose-response curve (Eq. 9). In this Section, we demonstrate that switching and invariance can be combined if the time window of variability suppression by negative feedback can be separated from the time window of switch-like decision making.
Feedback loops in mammalian signaling commonly involve transcriptional regulation, and the signaling cascades typically induce the expression of their own inhibitors [23]. In the yeast mating pathway phosphatases negative regulators like the G protein deactivator Sst2 and the phosphatase Msg5 are transcrip-tionally induced upon stimulation [22,37]. Transcriptional feed-back requiresde novoprotein biosynthesis, thereby affecting signal
that this memorization of the pre-stimulation state efficiently suppresses variability upon acute stimulation.
We model basal transcriptional feedback by implementing a negative feedback loop in the single-switch cascade. The phosphatase at the second level is transcriptionally induced by the active terminal kinaseX5(Figure 5A) and also transcribed with a basal rate(vsyn,const). Additionally,P2is subject to degradation (kdeg), giving rise to the following differential equation
dP2
dt ~vsyn,constzksyn,indX5{kdegP2 ð18Þ
Basal signaling was implemented by assuming a low chronic level of the stimulusS, and ligand-induced signaling was simulated by further increasingS. Time scale separation was introduced by neglecting the induction of P2 by transcriptional feedback early after stimulation. The concentration ofP2is thus fixed to the basal level throughout the time window of acute stimulation, i.e.,
dP2
dt ~0: ð19Þ
We performed cell-to-cell variability simulations of this system assuming a high Hill coefficient n (Figure 5B). The basal transcriptional feedback model shows a strongly reduced threshold variability when compared to a feedback-less cascade with the same kinetic parameters (compare Figure 4A and Figure 5B). The simulated signaling thresholds lie within a ,3-fold range of stimulus concentrations (Figure 5B), which is consistent with the experimentally observed invariance of the shmooing threshold (see Rationale). Strong variability suppression is possible, because the basal signaling activity and the pathway threshold are controlled by the same combination of parameters (Supplemental Text S1):
Transcriptional feedbacks correcting for fluctuations in basal signaling thereby indirectly correct the threshold variability as well. The threshold invariance of the basal feedback system is more pronounced if the dose-response curve of the signaling pathway is highly switch-like, because cooperativity promotes robustness in negative feedback circuits.
The invariance due to basal feedback is restricted to a certain range of activation resistances in the cascade, because increasing the expression of several phosphatases in the cascade shifts the system from complete switching of the whole cell population to heterogeneous switching of only a fraction of cells (Figure 5C). In Figure 5B and Figure 5C, we assumed that heterogeneity inP2 expression solely arises from fluctuations in the upstream signaling cascade. However, basal transcriptional feedback can exert a similar variability suppression if theP2synthesis rate is also noisy and sampled from a log-normal distribution (not shown).
Recent experimental evidence supports that Msg5, a basal transcriptional feedback regulator of the yeast mating pathway, suppresses the signaling variability upon pheromone stimulation [26]. We propose to eliminate basal transcriptional feedback by exchanging the endogenous promoter of the Msg5 gene by a promoter that is not regulated by the pheromone, and predict a strong increase in the signaling threshold variability.
3.5 Variability suppression by coherent feedforward regulation. Signaling networks commonly involve coherent feedforward loops where an upstream kinase controls a down-stream target by two parallel pathways. Fus3, the yeast MAPK that mediates the shmooing response, is controlled by two pheromone-dependent pathways, both of which are required for full activation [18]: Fus3 is phosphorylated by the upstream MAP kinase kinase Ste7, and additionally needs to be released from an inhibitory site in the scaffold protein Ste5 for activation. The latter step involves Ste5 multisite dephosphorylation by the phosphatase Ptc1. It will be shown below that coherent feedforward regulation of Fus3 may contribute to the invariance of shmooing.
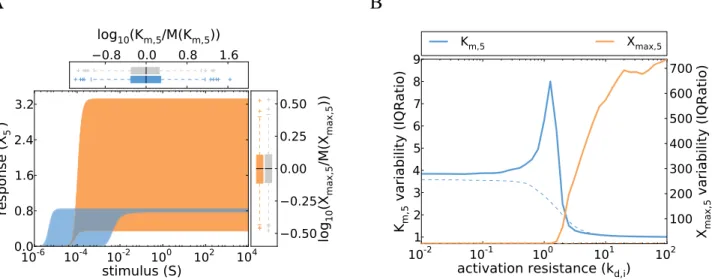
Figure 4. Cell-to-cell variability of cascades with a localized switch at the terminal level. ASimulations show that pronounced variability for bothKm,5(defined as the stimulus for a half-maximal pathway activation) andXmax,5. The concepts and parameter values correspond to Figure 1B,
and the simulations were performed by iteratively applying Eqs. 16 and 17 with a Hill coefficientn~5(Supplemental Table S1). Colored box plots represent theKm,5andXmax,5distribution of the ultrasensitive model, while gray box plots show the behavior of the reference gradual cascade (cf.
Figure 1B).BThe variabilities of a cascade with a localized switch at the terminal level were analyzed using the IQRatio, and the activation resistance was tuned by varying several phosphatase rate constants (kd,2–kd,4, thick, solid lines), and compared to a gradual model (thin, dashed lines). In
contrast to a cascade with distributed ultrasensitivity (Figure 3D), homogeneous switching of all cells at a defined stimulus value is not possible even for low activation resistances. Similar results are obtained using the coefficient of variation as a measure of variability (Figure S4).
We model coherent feedforward regulation by extending the model of the five-step signaling cascade with a switch at the terminal level (Eqs. 16 and 17). The downstream signaling species X4 and X5 represent the MAPKK Ste7 and its target Fus3, respectively. Ptc1 is regulated by pheromone pathway intermedi-ates upstream of Fus3 [18], but the precise molecular mechanism is not known. We assume in the model that the Ptc1 activity is directly activated by the pheromone receptor (X1). and that the Ptc1 pathway enhances X4–mediated phosphorylation of X5 (Figure 6A). The effective kinase concentration is thus enhanced by the feedforward term (1zkFFLX1) and the modified steady
state equation forX5reads
X5~Xtot,5 Xn
4(1zkFFL:X1)n Xn
4(1zkFFL:X1)nzKK~5n
ð20Þ
The thresholdKK~5 is proportional to the concentration of the phosphataseP5, and thus subject to fluctuations. The parameter kFFL determines how strongly the phosphorylation of X5 is enhanced by feedforward regulation. We assume strong crosstalk
Figure 5. Cell-to-cell variability of cascades with a localized switch at the terminal level and basal transcriptional feedback. A
Schematic representation of the five-step cascade with an ultrasensitive terminal step and basal transcriptional feedback. Assuming fast pathway dynamics and slow expression dynamics (time-scale separation), the system can be considered to exist in two states: at basal levels of stimulus,X5
induces the expression of the second level phosphataseP2(Eq. 18). Upon acute stimulation the pathway responds rapidly but the expression kinetics
of the phosphatase are too slow to establish a significant feedback regulation (Eq. 19).BSimulations of a cascade with a localized switch at the terminal level and basal transcriptional feedback show a reduced variability when compared to the ultrasensitive model without basal transcriptional feedback shown in Figure 4A. The concepts and parameter values correspond to Figure 1B, and the simulations were performed numerically integrating the ODE system given by Eqs. 16–19, with a Hill coefficientn~5, a basal stimulus of10{5, a basal synthesis ratev
syn,const~10{2, anX5
-induced synthesis rate constantksyn,ind~103, and a degradation ratekdeg~1(Supplemental Table S1). Colored box plots represent theKm,5and Xmax,5 distribution of the basal transcriptional feedback model, while gray box plots show the behavior of the reference gradual cascade (cf.
Figure 1B).CVariabilities ofKm,5(defined as the stimulus for a half-maximal pathway activation) andXmax,5were analyzed using the IQRatio, and the
activation resistance was tuned by varying several phosphatase rate constants (kd,2–kd,4, thick, solid lines). The variability of the gradual model is
shown for comparison (thin, dashed lines). The variant with basal transcriptional feedback is able to strongly reduce the variability inKm,5for low
activation resistance values when compared to the single-switch model without feedback (cf. Figure 4B). Similar results are obtained using the coefficient of variation as a measure of variability (Figure S5).
(large kFFL) and neglect saturation in the upstream part of the
cascade (i.e.,X1~Xtot,1=K1:SandX4~Xmax,4=Km,4:S) to ensure that both feedforward branches jointly regulateX5in a stimulus-dependent manner. The latter assumption is justified if the activation resistances in the cascade are large (Kiw1,i~2,3,4).
Then, steady state modifies to
X5~Xtot,5
S2n
S2nz KK~5 kFFL
K1 Xtot,1
Km,4 Xmax,4
n ð21Þ
In line with previous reports, we find that coherent feedforward regulation increases the ultrasensitivity of the dose-response curve, as the stimulus now enters with the exponent 2n [41]. The
switching threshold
Km,5~
ffiffiffiffiffiffiffiffiffiffiffiffiffiffiffiffiffiffiffiffiffiffiffiffiffiffiffiffiffiffiffiffiffiffi ~
K K5 kFFL
K1 Xtot,1
Km,4 Xmax,4 s
ð22Þ
contains the variabilities of X1 and X4 (determined by the ratios K1=Xtot,1 andKm,4=Xmax,4, respectively). The total variability of the feedforward system is determined by the product of the individual branch variabilities, but each branch variability enters as a root only. Feedforward regulation thus reduces the threshold variability com-pared to the simple cascade if the feedforward branch is a shortcut and regulated by only a few signaling protein concentrations.
Explicit cell-to-cell variability simulations using Eq. 20 confirm that the threshold variability of the feedforward pathway
Figure 6. Cell-to-cell variability of cascades with coherent feedforward regulation. ASchematic representation of the five-step cascade with a coherent feedforward loop: theX4-mediated phosphorylation ofX5is positively regulated by the kinaseX1(see main text).BSimulations of a cascade
with a coherent feedforward loop show reduced variability when compared to the single-switch model without feedforward regulation (Figure 4A). The concepts and parameter values correspond to Figure 1B, and the simulations were performed by iteratively applying Eqs. 16 and 20, with a Hill coefficientn~5
andkFFL~105(see Supplemental Table S1). Colored box plots represent theKm,5andXmax,5distribution of the feedforward model, while gray box plots show
the behavior of the reference gradual cascade (cf. Figure 1B).CThe variabilities ofKm,5(defined as the stimulus for a half-maximal pathway activation) and Xmax,5were analyzed as a function of the activation resistance by varying several phosphatase rate constants (kd,2–kd,4, thick, solid lines), and compared to a
gradual model (thin dashed lines). Feedforward regulation plays no role at low activation resistances (point 1), but reduces the variability at intermediate activation resistances (point 2; see main text). High variability arises at high resistances, because not all cells reach the threshold for fullX5activation (point 3).
(Figure 6B) is less than that of a simple ultrasensitive cascade with the same kinetic parameters (Figure 4A). Feedforward regulation robustly reduces the cell-to-cell variability, because partial invariance is observed over a broad range of activation resistances K2–K4in the upstream cascade (point 2 in Figure 6C). The cell-to-cell variability increases for low activation resistances (point 1 in Figure 6C), becauseX4is activated at much lower stimulus levels thanX1, which prevents efficient feedforward regulation. For too high activation resistances, the maximal activation levels ofX1and X4are too low to reliably activateX5, and the system shows high variability due to bimodal splitting into responding and non-responding cells (point 3 in Figure 6C).
We conclude that joint regulation of Fus3 by Ste7 and Ptc1 may reduce the cell-to-cell variability of pheromone signaling. Howev-er, the simulated signaling thresholds still span a,50-fold range of stimulus concentrations (Figure 6B), implying that feedforward regulation requires cooperation with other variability suppression mechanisms to bring about full robustness. The yeast pheromone pathway comprises feedforward loops other than the one comprising Ptc1, as G proteins employ several parallel pathways to activate the MAPK cascade [22]; it is possible that these multiple feedforward loops synergize to establish an invariant shmooing response.
Discussion
A key question in biology is how cellular systems function robustly in face of internal and external fluctuations. We comprehensively characterized the determinants of cell-to-cell variability in protein kinase signaling cascades, and summarized our main findings in Table 1. Our work extends previous studies on cell-to-cell variability [6,42,43] and on variability reduction by negative feedback [9,33,44], bifunctional enzymes [45–47] or correlated protein concentration fluctuations [7,9,28,48]. We analyzed the steady state dose-response behavior of signaling systems, and showed that protein kinase cascades can be highly variable or inherently invariant, depending on the properties of individual reaction steps and their kinetic parameters. Our results may explain why the yeast pheromone pathway shows switch-like decision making with very little cell-to-cell variability.
In this paper, we made a central simplifying assumption to study the behavior of protein kinase cascades: it was assumed that the individual levels of a protein kinase cascade function as isolated modules. Based on this assumption, we described the local dose-response behavior of each cascade level by Michaelis-Menten or
Hill equations (Eqs. 3 and 14), and studied their behavior in tandem to gain insights into the global dose-response behavior of the five-step cascade. Depending on the protein concentrations and kinetic parameters in the cascade, the modularity assumption may be violated, and explicit simulations of all enzyme-substrate binding and dissociation events in the cascade may be necessary: strong sequestration of upstream kinases by highly abundant downstream substrates affects the phosphorylation state of the upstream kinase, thereby leading to retroactivity in the cascade [49–51]. Retroactivity results in positive or negative feedback regulation [49–51], and may therefore increase or decrease the cell-to-cell variability of protein kinase signaling. Sequestration effects and retroactivity can give rise to complex dynamic phenomena such as bistability and oscillations in computational models of MAPK signaling without explicit feedback regulation [52–55]. The cell-to-cell variability of such complex protein kinase signaling systems cannot be understood by analytical approaches, and thus needs to be analyzed numerically using extensive parameter sampling strategies [54]. Throughout this paper, we assumed that the signaling activity at each cascade level scales with the total kinase concentration (Eqs. 2, 14 and 17). However, a nonlinear relationship between signaling activity and total protein concentration is possible for (de)phosphorylation cycles with tight enzyme-substrate binding and sequestration effects [56,57], implying that the cell-to-cell variability would be increased or decreased.
Negative feedback is known to suppress the variability of biological systems and to reduce the steepness of signaling dose-response curves [32,33]. Here, we define more precisely the role of negative feedback in the modulation of signal transduction variability. Negative feedback simultaneously reduces the variabil-ity of the maximal pathway activation and the signaling threshold, thereby resolving the robustness trade-off which we observed in non-feedback cascades. The topological organization of the feedback loop determines which dose-response features are primarily affected by negative feedback: A feedback that acts upstream in the cascade primarily promotes invariance of the pathway threshold, while a feedback acting downstream controls the variability of the maximal pathway activation. We further find that the time scale of negative feedback regulation may determine its functional role: Variability suppression in fast, post-translational loops comes at the cost of a very shallow dose-response curve, implying that switch-like decision making is not possible. This trade-off can be circumvented in slow transcriptional feedback
Table 1.Determinants of cell-to-cell variability in gradual and ultrasensitive signal transduction.
Model
Dose-response behavior
Cell-to-cell variability Note
Gradual Eq. 1 gradual high variability most pronounced for weak stimulation
Feedback (upstream) Eq. 8 very gradual low feedback primarily reduces pathway sensitivity (Km,5)
fluctuations
Feedback (downstream) Eq. 12 very gradual low feedback primarily reduces maximal pathway activation (Xmax,5) fluctuations
Distributed ultrasensitivity Eq. 14 switch low-high variability can be regulated by phosphatase expression
Single-step ultrasensitivity Eqs. 16, 17 switch high pathway threshold always highly variable
Single-step ultrasensitivity+basal transcriptional feedback
Eqs. 16–19 switch low switch-like decision making only for slow feedback possible
Single-step ultrasensitivity+coherent feedforward loop
Eqs. 16, 20 switch medium total variability is the combination of the individual branch variabilities