73
COMPARATIVE PERFORMANCE OF DIFFERENT VERSIONS OF LOW
HEAT REJECTION DIESEL ENGINES WITH MOHR OIL BASED
BIO-DIESEL
T. Ratna Reddy1, M.V.S. Murali Krishna2, Ch. Kesava Reddy3 & P.V.K.Murthy4* 1,3
Research Scholar, Mechanical Engineering, Rayalaseema University, Karnool- 518 502 Andhra Pradesh, India
2,
Mechanical Engineering Department, Chaitanya Bharathi Institute of Technology, Gandipet, Hyderabad-500 075, Andhra Pradesh, India, E-mail: [email protected],
Mobile: 09885517936 4
Vivekananda Institute of Science and Information Technology, Shadnagar, Mahabubnagar-509216, Andhra Pradesh, India
*E-mail: [email protected], Mobile: 099490116544
ABSTRACT
Experiments were carried out to evaluate the performance of a low heat rejection (LHR) diesel engine consisting of different versions such as ceramic coated cylinder head engine-LHR-1; Air gap insulated piston and air gap insulated liner-LHR-2; and Ceramic coated cylinder head, air gap insulated piston and air gap insulated liner – LHR-3 with normal temperature condition of mohr oil based biodiesel (MOBD) with varied injection pressure. Performance parameters and emission levels were determined at various magnitudes of brake mean effective pressure (BMEP). Combustion characteristics of the engine were measured at the peak load operation with TDC (top dead centre) encoder, pressure transducer, console and special pressure-crank angle software package. Conventional engine (CE) showed compatible performance and LHR engines showed improved performance at recommended injection timing of 27obTDC and recommend injection pressure of 190 bar with MOBD operation, when compared with CE with pure diesel operation. Peak brake thermal efficiency increased relatively by 7%, brake specific energy consumption decreased relatively by 3.5%, smoke levels decreased relatively by 11% and NOx levels increased relatively by 58% with LHR-3 engine with MOBD at an injection pressure of 190 bar when compared with pure diesel operation on CE at an injection pressure of 190 bar.
Key words:Mohr oil, Esterification, LHR engine, Performance, Emissions, Combustion characteristics.
1. INTRODUCTION
74
conductivity materials like superni, cast iron and mild steel etc. Ceramic coatings provided adequate insulation and improved brake specific fuel consumption (BSFC) which was reported by various researchers. However previous studies9-13revealed that the thermal efficiency variation of LHR engine not only depended on the heat recovery system, but also depended on the engine configuration, operating condition and physical properties of the insulation material. Air gap was created14 in the nimonic piston crown and experiments were conducted with pure diesel and reported that BSFC increased by 7% with varied injection timings. Investigations were carried15 with air gap insulated piston with superni crown and air gap insulated liner with superni insert with varied injection pressures and injection timings with alternate fuels of alcohols and vegetable oils and reported LHR engine improved efficiency and decreased pollution levels. Investigations were carried16 out to evaluate the performance of LHR engine consisted of air gap insulated piston, air gap insulated liner and ceramic coated cylinder head with jatropha oil and pongamia oil based biodiesels with varied injection timing and injection pressure and reported that LHR engine improved the performance of the engine at advanced injection timing and higher injection pressure when compared with pure diesel operation on CE.
Little literature was available in evaluating the performance of different versions of the LHR engines with varied injection pressure. The present paper attempted to evaluate the performance of different versions of the LHR engine, with mohr oil based bio-diesel with varied injection pressure and compared with pure diesel operation on CE.
2. EXPERIMENTAL PROGRAMME
The term esterification means conversion of one ester into the other. In the present case glycerol was replaced with methyl alcohol, the fatty acids remaining the same. The chemical conversion reduced viscosity four fold. As it is evident glycerol was the byproduct of the reaction and a valuable commercial commodity. The process15 of converting the oil into methyl esters was carried out by heating the oil with the methanol in the presence of the catalyst (Sodium hydroxide). In the present case, vegetable oil (Mohr oil) was stirred with methanol at around 60-70oC with 0.5% of NaOH based on weight of the oil, for about 3 hours. At the end of the reaction, excess methanol is removed by distillation and glycerol, which separates out was removed. The methyl esters were treated with dilute acid to neutralize the alkali and then washed to get free of acid, dried and distilled to get pure vegetable oil esters. The esters were used in present study. The properties of biodiesel were given in Table-1 along with diesel fuel. Different versions of the LHR engine used in the experimentation were LHR-1, LHR-2 and LHR-3 engines. LHR-1 Engine- Engine with ceramic coated cylinder head, LHR-2–Engine-Air gap insulated piston with superni (an alloy of nickel) crown and air gap insulated liner, LHR-3- Engine- Air gap insulated piston with superni crown, air gap insulated liner with superni insert and ceramic coated cylinder head. Fig.1gave the details of insulated piston, insulated liner and ceramic coated cylinder head employed in the experimentation. The LHR diesel engine contained a two-part piston - the top crown made of low thermal conductivity material, superni-90 was screwed to aluminum body of the piston, providing a 3-mm-air gap in between the crown and the body of the piston. The optimum thickness of air gap in the air gap piston was found14 to be 3-mm for better performance of the engine with superni inserts with diesel as fuel. A superni-90 insert was screwed to the top portion of the liner in such a manner that an air gap of 3-mm was maintained between the insert and the liner body. Partially stabilized zirconium (PSZ) of thickness 500 microns was coated on inside portion of cylinder head.
Table.1 Properties of Test Fuels
Test Fuel Viscosity at
25 o C (Centi-poise)
Density at 25 o C
Cetane number Calorific value (kJ/kg)
Diesel 12.5 0.84 55 42000
Mohr oil (esterified) (MOBD)
75
1. Crown 7 Insert 2. Gasket 8. Air gap 3. Air gap 9. Liner 4. Body
5. Ceramic coating
6. Cylinder head
Insulated piston Insulated liner Ceramic coated cylinder head
Figure 1. Assembly details of insulated piston, insulated liner and ceramic coated cylinder head
Experimental setup used for the investigations of LHR diesel engine with MOBD was shown in Fig.2. CE had an aluminum alloy piston with a bore of 80-mm and a stroke of 110-mm. The rated output of the engine was 3.68 kW at a speed of 1500 rpm. The compression ratio was 16:1 and manufacturer’s recommended injection timing and injection pressures were 27obTDC and 190 bar respectively. The fuel injector had 3-holes of size 0.25-mm. The combustion chamber consisted of a direct injection type with no special arrangement for swirling motion of air. The engine was connected to electric dynamometer for measuring its brake power. Burette method was used for finding fuel consumption of the engine. Air-consumption of the engine was measured by air-box method.
1.Engine, 2.Electical Dynamo meter, 3.Load Box, 4.Orifice meter, 5.U-tube water manometer, 6.Air box, 7.Fuel tank, 8, Three-way valve, 9.Burette, 10. Exhaust gas temperature indicator, 11.AVL Smoke meter, 12.Netel Chromatograph NOx Analyzer, 13.Outlet jacket water temperature indicator, 14. Outlet-jacket water flow meter, 15.Piezo-electric pressure transducer, 16.Console, 17.TDC encoder, 18.Pentium Personal Computer and 19. Printer.
76
The naturally aspirated engine was provided with water-cooling system in which inlet temperature of water was maintained at 60oC by adjusting the water flow rate. Engine oil was provided with a pressure feed system. No temperature control was incorporated, for measuring the lube oil temperature. Injection pressure was changed from 190 bar to 270 bar (in steps of 40 bar) using nozzle testing device. The maximum injection pressure was restricted to 270 bar due to practical difficulties involved. Exhaust gas temperature (EGT) was measured with thermocouples made of iron and iron-Constantan. Emission levels of smoke and NOx were recorded by AVL smoke meter and Netel Chromatograph NOx analyzer respectively at different magnitudes of BMEP. Piezo electric transducer, fitted on the cylinder head to measure pressure in the combustion chamber was connected to a console, which in turn was connected to Pentium personal computer. TDC encoder provided at the extended shaft of the dynamometer was connected to the console to measure the crank angle of the engine. A special P- software package evaluated the combustion characteristics such as peak pressure (PP), time of occurrence of peak pressure (TOPP), maximum rate of pressure rise (MRPR) and time of occurrence of maximum rate of pressure rise (TOMRPR) from the signals of pressure and crank angle at the peak load operation of the engine. Pressure-crank angle diagram was obtained on the screen of the personal computer.
3. RESULTS AND DISCUSSION 3.1. Performance Parameters
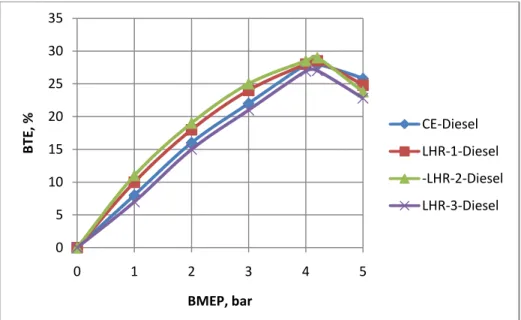
Here onwards, the engine with ceramic coated cylinder head was termed as LHR-1 engine; the insulated engine with air gap insulated piston and air gap insulated liner was termed as LHR-2 engine while insulated engine with air gap insulated piston, air gap insulated liner and ceramic coated cylinder head was termed as LHR-3 engine. Fig.3 showed the variation of BTE with BMEP with pure diesel operation with LHR versions of the engine at an injection pressure of 190 bar. From Fig.3, it could be observed that BTE increased up to 80% of the peak load in the LHR-1 engine and LHR-2 engine at the recommended injection timing and beyond this load, it decreased over and above that of the CE. As the combustion chamber was insulated to greater extent, it was expected that high combustion temperatures would be prevalent in LHR engine. It tended to decrease the ignition delay thereby reducing pre-mixed combustion as a result of which, less time was available for proper mixing of air and fuel in the combustion chamber leading to incomplete combustion, with which BTE decreased beyond 80% of the full load. More over at this load, friction and increased diffusion combustion resulted from reduced ignition delay. Increased radiation losses might have also contributed to the deterioration. BTE decreased at all loads for LHR-3 engine in comparison with CE because of decreased ignition delay.
Figure 3. Variation of brake thermal efficiency (BTE) with brake mean effective pressure (BMEP) in different versions of the engine with pure diesel operation at an injection pressure of 190 bar.
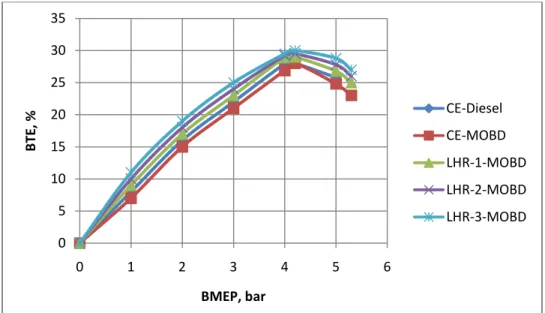
At peak load operation, BTE was marginally higher with LHR-1 engine when compared with LHR-2 engine. The reduction of ignition delay was higher with LHR-2 engine leading to deteriorate in the performance of the engine. Fig.4 showed the variation of BTE with BMEP with MOBD operation on different versions of the engine at an
0 5 10 15 20 25 30 35
0 1 2 3 4 5
B
TE
, %
BMEP, bar
CE-Diesel
LHR-1-Diesel
-LHR-2-Diesel
77
injection pressure of 190 bar. From Fig.4, it could be noticed that the trend exhibited by the CE with MOBD was similar to that of the CE with pure diesel fuel. However, CE with MOBD showed the compatible performance for entire load range when compared with pure diesel operation.
Figure 4. Variation of BTE with BMEP in different versions of the engine with test fuels operation at an injection pressure of 190 bar.
Although carbon accumulations on the nozzle tip might play a partial role for the general trends observed, the difference of viscosity between the diesel and MOBD provided a possible explanation for the compatible performance of the engine with MOBD operation. The result of lower jet exit Reynolds numbers with MOBD adversely affected the atomization. The amount of air entrained by the fuel spray was reduced, since the fuel spray plume angle was reduced, resulting in slower fuel- air mixing. In addition, less air entrainment by the fuel spay suggested that the fuel spray penetration might increase and resulted in more fuel reaching the combustion chamber walls. Furthermore droplet mean diameters (expressed as Sauter mean) were larger for MOBD leading to higher droplet evaporation thus slowing the preparation of the MOBD and reducing the rate of heat release as compared to diesel fuel operation. According to the qualitative image of the combustion under the MOBD operation with CE, the lower BTE was attributed to the relatively retarded and lower heat release rate. BTE increased in LHR versions of the engine in comparison with CE with MOBD operation. High cylinder temperatures helped in better evaporation and faster combustion of the fuel injected into the combustion chamber. Reduction of ignition delay of the biodiesel in the hot environment of the LHR-3 engine improved heat release rates and efficient energy utilization. LHR-3 engine showed improved performance when compared with LHR-1 and LHR-2 versions of the engine. This was due to hot environment provided by LHR-3 engine which caused efficient burning of high viscous fuel.
Higher fuel injection pressures increased the degree of atomization. The fineness of atomization reduced the ignition lag, due to higher surface volume ratio. Smaller droplet size would have a low depth of penetration, due to less momentum of the droplet and less velocity relative to air, from where it had to find oxygen after evaporation. Because of this, air utilization would be reduced due to fuel spray being shorter. Also with smaller droplets, aggregate area of inflammation would increase after ignition, resulting high-pressure rise during second stage of combustion. Thus lower injection pressure giving larger droplet size might give lower pressure rise during the second stage of combustion and probably smoother running. However, poor performance at lower injector opening pressures indicated slow mixing probably because of insufficient spray penetration with consequent slow mixing during diffusion burning. Hence an optimum mean diameter of the droplet should be attempted as a compromise. The variation of injection opening pressure was done with nozzle-testing device. Performance of the engine was evaluated with varying injection pressure from 190 to 270 bars for CE and LHR engine.
Table-2 shows the data of peak BTE which varied with injection pressure in different versions of the engine with test fuels. From Table.2 it could be observed that peak brake thermal efficiency increased with increase of injection pressure with MOBD operation in different versions of the engine. Performance improved with LHR versions of the engine and LHR-3 engine registered higher value of peak BTE with MOBD operation.
0 5 10 15 20 25 30 35
0 1 2 3 4 5 6
B
TE
, %
BMEP, bar
CE-Diesel
CE-MOBD
LHR-1-MOBD
LHR-2-MOBD
78
Table. 2 Data of Peak BTE Peak Brake Thermal Efficiency (%) Engine
Version
Pure Diesel operation MOBD operation
Injection Pressure (bar) Injection Pressure (bar)
190 230 270 190 230 270
CE 28 29 30 28 29 30
LHR-1 28.5 29 29.5 29 29.5 30
LHR-2 29 30 30.5 29.5 30 30.5
LHR-3 27 27.5 28 30 31 32
Table-3 showed the data of peak brake specific energy consumption (BSEC) which varied with injection pressure in different versions of the engine with test fuels. From Table.3, it could be noticed BSEC at peak load operation decreased with increase of injection pressure in different versions of the engine with different test fuels. BSEC was higher in CE with MOBD operation in comparison with pure diesel operation at peak load. However, BSEC decreased in LHR engines with MOBD operation. LHR-3 gave lower BSEC when compared with other versions of LHR engines because of provision of higher degree of insulation and energy was effectively utilized in converting heat into work.
Table.3 Data of Peak BSEC at peak load operation Brake Specific Energy Consumption (kW/kW) Engine
Version
Pure Diesel operation MOBD operation
Injection Pressure (bar) Injection Pressure (bar)
190 230 270 190 230 270
CE 4.0 3.92 3.84 5.0 4.8 4.7
LHR-1 4.12 4.04 3.96 3.94 3.90 3.86
LHR-2 4.16 4.08 4.00 3.90 3.86 3.82
LHR-3 4.3 4.1 4.05 3.86 3.82 3.78
Table-4 showed the data of peak brake specific fuel consumption (BSFC) which varied with injection pressure in different versions of the engine with test fuels From Table.4, it could be noticed that brake specific fuel consumption (BSFC) increased with LHR versions of the engine with pure diesel operation when compared with CE with pure diesel operation. This was due to increase of ignition delay. BSFC at peak load operation was observed to be less with LHR versions of the engine when compared with CE with MOBD operation. This was due to efficient combustion of MOBD in the hot environment of LHR engines, as components were insulated leading to decrease in BSFC or increase of BTE. BSFC decreased with increase of injection pressure in all versions of the engine due to improved spray characteristics.
Table.4 Data of BSFC at peak load operation
Brake Specific Fuel Consumption (BSFC) at peak load operation (kg/kW-h) Engine
Version
Pure Diesel operation MOBD operation
Injection Pressure (bar) Injection Pressure (bar)
190 230 270 190 230 270
CE 0.343 0.336 0.329 0.48 0.46 0.451
LHR-1 0.353 0.346 0.339 0.378 0.374 0.37
LHR-2 0.356 0.349 0.343 0.374 0.37 0.366
LHR-3 0.368 0.359 0.347 0.37 0.366 0.362
79
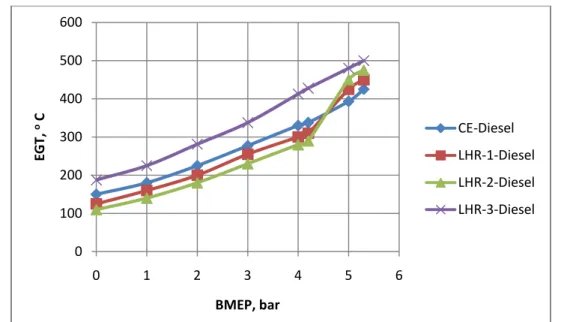
Figure 5. Variation of EGT with BMEP in different versions of the engine with pure diesel operation at an injection pressure of 190 bar.
Fig.6 showed the variation of EGT with BMEP with MOBD operation on different versions of the engine at an injection pressure of 190 bar. From Fig.6, it could be seen that CE with MOBD operation at the recommended injection timing recorded higher EGT at all loads when compared with CE with pure diesel operation. Lower heat release rates and retarded heat release associated with high specific energy consumption caused increase in EGT in CE. Ignition delay in CE with different operating conditions of biodiesel increased the duration of the burning phase. LHR versions of engine recorded lower value of EGT when compared with CE with MOBD operation. This was due to reduction of ignition delay in the hot environment with the provision of the insulation in the LHR engine, which caused the gases expand in the cylinder giving higher work output and lower heat rejection. This showed that the performance improved with LHR engine over CE with MOBD operation. LHR-3 engine recorded lower magnitude of EGT when compared with other versions of the engine.
Figure 6. Variation of EGT with BMEP in different versions of the engine with MOBD operation at an injection pressure of 190 bar.
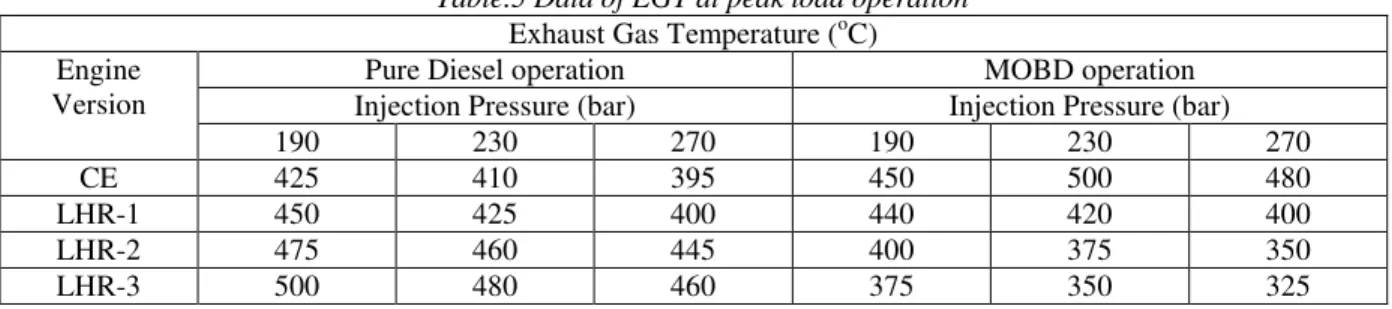
Table-5 showed the data of EGT at peak load operation, which varied with injection pressure in different versions of the engine with test fuels. From Table-5, it could be seen that EGT decreased with increase in injection pressure in different versions of the engine. LHR-3 engine recorded higher value of EGT when compared with other versions of
0 100 200 300 400 500 600
0 1 2 3 4 5 6
E
GT,
oC
BMEP, bar
CE-Diesel
LHR-1-Diesel
LHR-2-Diesel
LHR-3-Diesel
0 50 100 150 200 250 300 350 400 450 500
0 1 2 3 4 5 6
E
GT,
oC
BMEP,bar
CE-Diesel
CE-MOBD
LHR-1-MOBD
LHR-2-MOBD
80
the engine with pure diesel operation. Since for LHR-3 engine, all the components are insulated and combustion is maintained at higher temperature leading to increase of EGT with pure diesel operation.
Table.5 Data of EGT at peak load operation Exhaust Gas Temperature (oC)
Engine Version
Pure Diesel operation MOBD operation
Injection Pressure (bar) Injection Pressure (bar)
190 230 270 190 230 270
CE 425 410 395 450 500 480
LHR-1 450 425 400 440 420 400
LHR-2 475 460 445 400 375 350
LHR-3 500 480 460 375 350 325
The magnitude of EGT at peak load decreased with increase of injection pressure in different versions of the engine with M OBD operation. This was due to improved atomization characteristics of the fuel and improved air-fuel ratios.
Fig.7 showed the variation of Coolant load (CL) with BMEP with pure diesel operation with LHR versions of the engine at an injection pressure of 190 bar. From Fig.7, it could be seen that CL increased with the increase of load in CE and LHR engines with pure diesel operation. LHR-1 engine and LHR-2 engine gave lesser CL up to 80% of the peak load, when compared with CE. Air being a bad conductor offers thermal resistance for heat flow through the piston and liner. It was therefore evident that thermal barrier provided in the piston and liner resulted in reduction of CL up to 80% of the full load. Beyond 80% of the full load, CL in LHR engine increased over and above that o f the CE, with which efficiency is deteriorated at peak load of LHR engine, when compared with CE. This was because in cylinder, the heat rejection at full load is primarily due to un-burnt fuel concentration near the combustion chamber walls. The air-fuel ratio got reduced to a reasonably low value at this load confirming the above trend. However, when heat rejection calculations of coolant load were made, the heat lost to lubricant should also be considered. As in the present investigations the lubricant heat loss was not considered, this aspect was not depicted in CL calculations. Heat could also escape through un-insulated cylinder head for LHR-2 version of the engine. However, LHR-3 engine gave lower coolant load when compared to other versions of the engine as it was insulated fully.
Figure 7. Variation of coolant load with BMEP in different versions of the engine with pure diesel operation at an injection pressure of 190 bar.
Fig.8 showed the variation of CL with BMEP with MOBD operation on different versions of the engine at an injection pressure of 190 bar. From the Fig.8, it could be seen that coolant load reduced with LHR versions of the engine with MOBD operation when compared with CE with pure diesel operation. Heat output was properly utilized and hence efficiency increased and heat loss to coolant decreased with effective thermal insulation with LHR
0 0.5 1 1.5 2 2.5 3 3.5 4 4.5 5
0 2 4 6
CL,
k
W
BMEP, bar
CE-Diesel
LHR-1-Diesel
LHR-2-Diesel
81
engines. As it is obvious, LHR-3 version of the engine registered lower value of coolant loss, as it was provided with high degree of insulation.
Figure 8. Variation of coolant load with BMEP in different versions of the engine with MOBD operation at an injection pressure of 190 bar.
Table-6 showed the data of CL at peak load operation, which varied with injection pressure in different versions of the engine with test fuels. From Table.6, it could be observed that CL decreased with increase of injection pressures in different versions of the engine. Decrease of gas temperatures with the increase of injection pressure any way decreased CL and exhaust gas temperatures. This was due to the fact with increase of injection pressure with CE, increased nominal fuel spray velocity resulting in better fuel-air mixing with which gas temperatures decreased and air fuel ratio improved. The reduction of CL in LHR engine was not only due to the provision of the insulation but also it was also due to better fuel spray characteristics and increase of air-fuel ratios causing decrease of gas temperatures and hence the CL. The magnitude of coolant load at peak load decreased with increase of injection pressure in all versions of the engine. This was due to decrease of gas temperatures with effective utilization of air in all versions of the engine.
Table 6. Data of coolant load at peak load operation Coolant Load ( kW)
Engine Version
Pure Diesel operation MOBD operation
Injection Pressure (bar) Injection Pressure (bar)
190 230 270 190 230 270
CE 4.0 3.9 3.8 4.4 4.3 4.2
LHR-1 4.1 3.6 3.1 3.6 3.4 3.2
LHR-2 4.5 4.0 3.40 3.5 3.3 3.1
LHR-3 3.8 3.7 3.2 3.3 3.1 3.0
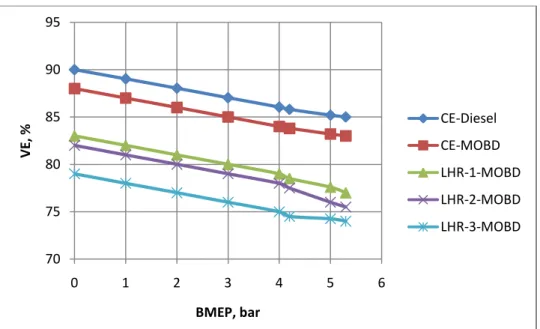
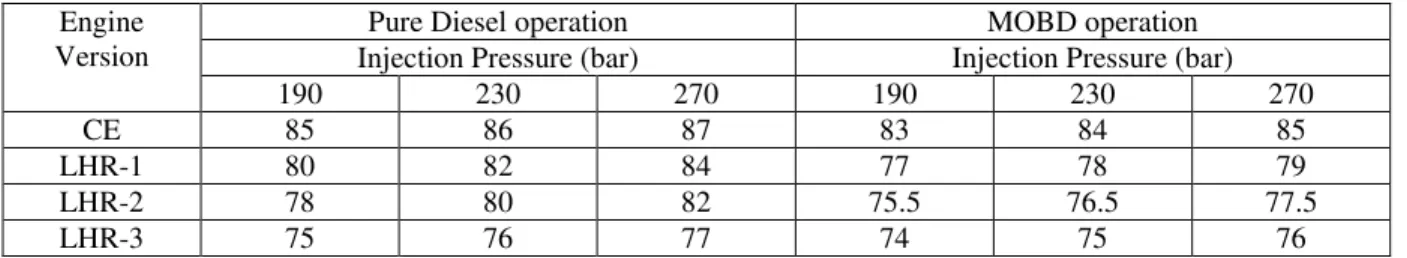
Fig.9 showed the variation of volumetric efficiency (VE) with BMEP with pure diesel operation with LHR versions of the engine at an injection pressure of 190 bar. From Fig.9, it could be seen that Volumetric efficiency (VE) decreased in LHR versions of the engine at all loads in comparison with other versions of the engine with pure diesel operation. Air got heated with insulated components of engine less amount of air was inducted in insulated engine and hence its mass flow rate decreased. VE decreased by 12% relatively with LHR-3 version of the engine when compared with CE with pure diesel operation.
0 0.5 1 1.5 2 2.5 3 3.5 4 4.5 5
0 1 2 3 4 5 6
CL,
k
W
BMEP, bar
CE-Diesel
CE-MOBD
LHR-1-MOBD
LHR-2-MOBD
82
Figure 9. Variation of volumetric efficiency (VE) with BMEP in different versions of the engine with pure diesel operation at an injection pressure of 190 bar.
Fig.10 showed the variation of VE with BMEP with MOBD operation on different versions of the engine at an injection pressure of 190 bar. From Fig.10, it could be observed that VE decreased with MOBD operation when compared with CE with pure diesel operation. This was due to increase of deposits. VE decreased in LHR versions of the engine further with biodiesel operation. This was due to hot environment provided by LHR versions of the engine. LHR-3 engine showed lower volumetric efficiency when compared with other versions of the engine. VE decreased by 13% relatively with LHR-3 version of the engine with MOBD when compared with pure diesel operation on CE. This was due to high degree of insulation provided with LHR-3 engine.
Figure 10. Variation of volumetric efficiency (VE) with BMEP in different versions of the engine with MOBD operation at an injection pressure of 190 bar.
Table-7 showed the data of VE at peak load operation, which varied with injection pressure in different versions of the engine with test fuels.
Table 7. Data of volumetric efficiency at peak load Volumetric Efficiency (%)
74 76 78 80 82 84 86 88 90 92
0 1 2 3 4 5 6
VE
, %
BMEP, bar
CE-Diesel
LHR-1-Diesel
LHR-2-Diesel
LHR-3-Diesel
70 75 80 85 90 95
0 1 2 3 4 5 6
VE
, %
BMEP, bar
CE-Diesel
CE-MOBD
LHR-1-MOBD
LHR-2-MOBD
83 Engine
Version
Pure Diesel operation MOBD operation
Injection Pressure (bar) Injection Pressure (bar)
190 230 270 190 230 270
CE 85 86 87 83 84 85
LHR-1 80 82 84 77 78 79
LHR-2 78 80 82 75.5 76.5 77.5
LHR-3 75 76 77 74 75 76
From Table.7, it could be seen that VE increased marginally with increase of injection pressure in both versions of the engine with different test fuels. This was because of reduction of deposits and improved air fuel ratios with increase of injection pressure in different configurations of the engine. This was also due to fuel air ratios improved with increase of injection pressures leading to increase of VE in both versions of the engine. CE recorded higher volumetric efficiency in comparison with LHR versions of the engine as air got heated with hot components of insulated engine leading to reduce mass flow rate of air into LHR engine.
3.2. Emission Levels with Test Fuels
Fig.11 shows the variation of smoke levels with BMEP with pure diesel operation with LHR versions of the engine at an injection pressure of 190 bar. From Fig.11, it could be seen that smoke levels increased with as increase of BMEP in all versions of the engine with pure diesel operation. Smoke levels were higher al all loads in LHR-3 engine when compared with other versions of the engine. This was due to fuel cracking at higher temperatures in LHR-3 engine. At recommended injection timing and pressure, increase of smoke intensity was observed in LHR-3 engine, when compared with CE. This was due to the decreased oxidation rate of soot in relation to soot formation. Higher surface temperatures of LHR-3 engine aided this process. LHR-3 engine shorten the delay period, which increases thermal cracking, responsible for soot formation. Higher temperature of LHR-3 engine produced increased rates of both soot formation and burn up. The reduction in VE and air-fuel ratios were responsible factors for increasing smoke levels in LHR-3 engine near peak load operation of the engine. As expected, smoke increased in LHR-2 engine because of higher temperatures and improper utilization of the fuel consequent upon predominant diffusion combustion. LHR-1 engine registered marginally higher value of smoke intensity when compared with CE. It followed the same trend as followed by LHR-2 engine.
Figure 11.Variation of smoke levels with BMEP in different versions of the engine with pure diesel operation at an injection pressure of 190 bar.
Fig.12 showed the variation of smoke levels with BMEP with MOBD operation on different versions of the engine at an injection pressure of 190 bar. From the Fig, it could be seen that smoke levels were observed to be higher with CE at all loads with biodiesel operation when compared with pure diesel operation on CE. This is due to the higher
0 10 20 30 40 50 60 70
0 1 2 3 4 5 6
S
m
o
ke
Level
s,
H
S
U
BMEP, bar
CE-Diesel
LHR-1-Diesel
LHR-2-Diesel
84
magnitude of the ratio of C/H of MOBD (0.83) when compared to pure diesel (0.45). The increase of smoke levels was also due to decrease of air-fuel ratios and volumetric efficiency with MOBD compared to pure diesel operation. Smoke levels are proportional to the density of the fuel. Since biodiesel have higher density compared to diesel fuels, smoke levels are higher with biodiesel. However, LHR engines decreased smoke levels due to efficient combustion and less amount of fuel accumulation on the hot combustion chamber walls of the LHR engine with MOBD compared with CE. LHR-3 engine registered lower value of smoke levels in comparison with other versions of LHR engine due to efficient combustion in LHR-3 engine.
Figure 12. Variation of smoke levels with BMEP in different versions of the engine with MOBD operation at an injection pressure of 190 bar.
Table-8 showed the data of smoke levels at peak load operation, which varied with injection pressure in different versions of the engine with test fuels. From Table-8, it could be observed Smoke levels decreased with increase of injection pressure, in both versions of the engine, with biodiesel operation. This was due to improvement in the fuel spray characteristics at higher injection pressures causing lower smoke levels.
Table 8. Data of smoke levels at peak load Smoke Levels (HSU)
Engine Version
Pure Diesel operation MOBD operation
Injection Pressure (bar) Injection Pressure (bar)
190 230 270 190 230 270
CE 48 38 34 60 55 50
LHR-1 52 45 40 53 48 43
LHR-2 55 50 45 45 40 35
LHR-3 60 55 50 43 38 33
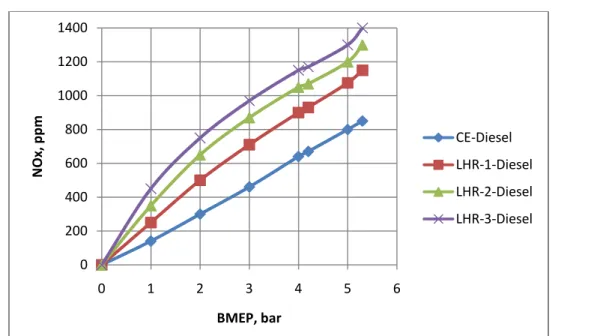
Fig.13 showed the variation of NOx levels with BMEP with pure diesel operation with LHR versions of the engine at an injection pressure of 190 bar. From Fig.13, it could be observed for all versions of the engine, NOx concentrations raised steadily as the fuel/air ratio increased with increasing BMEP, at constant injection timing with pure diesel operation. LHR-3 engine recorded higher NOx at all loads when compared with other versions of the engine. It was due to the reduction of fuel-air equivalence ratio with LHR engine, which was approaching to the stoichiometric ratio, causing more NOx concentrations.
0 10 20 30 40 50 60 70
0 1 2 3 4 5 6
S
m
o
ke
Level
s,
H
S
U
BMEP, bar
CE-Diesel
CE-MOBD
-LHR-1-MOBD
LHR-2-MOBD
85
Figure 13.Variation of NOx levels with BMEP with pure diesel operation in different versions of the engine at an injection pressure of 190 bar.
Fig.14 showed the variation of NOx levels with BMEP with MOBD operation on different versions of the engine at injection pressure of 190 bar. From Fig.14, it could be seen that NOx levels were lower in CE while they are higher in LHR engines with MOBD operation, when compared with diesel operation. This was due to lower heat release rate because of high duration of combustion causing lower gas temperatures with the biodiesel operation on CE, which reduced NOx levels. Increase of combustion temperatures with the faster combustion and improved heat release rates in LHR engine caused higher NOx levels. NOx levels were higher with LHR-3 engine when compared with other versions of the engine. This was due to high degree of insulation provided with LHR-3 version of the engine.
Figure 14.Variation of NOx levels with BMEP with test fuels in different versions of the engine at an injection pressure of 190 bar.
Table-9 showed the data of NOx levels at peak load operation, which varied with injection pressure in different versions of the engine with test fuels. From the Table-9, it can be observed that increase of injection pressure decreased NOx emissions in both versions of the engine.
Table 9. Data of NOx emissions at peak load 0
200 400 600 800 1000 1200 1400
0 1 2 3 4 5 6
N
Ox,
p
p
m
BMEP, bar
CE-Diesel
LHR-1-Diesel
LHR-2-Diesel
LHR-3-Diesel
0 200 400 600 800 1000 1200 1400
0 1 2 3 4 5 6
N
o
x,
p
p
m
BMEP, bar
CE-Diesel
CE-MOBD
-LHR-1-MOBD
LHR-2-MOBD
86 NOx Levels (ppm) Engine
Version
Pure Diesel operation Crude pongamia oil operation
Injection Pressure (bar) Injection Pressure (bar)
190 230 270 190 230 270
CE 850 800 750 800 750 700
LHR-1 1150 1100 1050 1080 1030 980
LHR-2 1300 1280 1260 1300 1250 1200
LHR-3 1400 1380 1360 1350 1300 1250
This was because of decrease of gas temperatures with the increase of injection pressure. With the increase of injection pressure, fuel droplets penetrate and find oxygen counterpart easily. Turbulence of the fuel spray increased the spread of the droplets thus leading to decrease in NOx levels. In case of LHR engine, decrease of NOx levels was due to decrease of combustion temperatures with increase of injection pressure.
3.3. Combustion Characteristics
Table-10 and Table-11 showed the data of PP and MRPR at peak load operation, which varied with injection pressure in different versions of the engine with test fuels respectively. From Table-10, it could be seen that peak pressures were lower in LHR engine with pure diesel operation in comparison with CE. This was because the LHR engine exhibited higher temperatures of combustion chamber walls leading to continuation of combustion, giving peak pressures away from TDC. The magnitude of PP increased with the increase of injection pressures, in both versions of the engine. With MOBD operation, PP were lower in CE while they were higher in the LHR engines at the recommended injection timing and pressure, when compared to pure diesel operation on CE. This was due to increase of ignition delay, as MOBD require large duration of combustion, mean while the piston started making downward motion thus increasing volume when the combustion takes place in CE. LHR engines increased the mass-burning rate of the fuel in the hot environment leading to produce higher peak pressures. The advantage of using LHR engine for MOBD was obvious as it could burn high viscous fuels. PP increased with the increase of injection pressure in all versions of the engine, with the MOBD operation. Higher injection pressure produced smaller fuel particles with low surface to volume ratio, giving rise to higher PP. The trend followed by MRPR was similar to PP in both versions of the engine as shown in Table-11
.
Table 10. ata of Peak Pressure at peak load operation PP (bar)
Engine Version
Pure Diesel operation MOBD operation
Injection Pressure (bar) Injection Pressure (bar)
190 230 270 190 230 270
CE 50.4 51.7 53.5 46.5 48.9 49.9
LHR-1 49.4 52.2 54.3 57.5 60.6 60.6
LHR-2 48.1 51.1 53.0 60.7 62.7 64.7
LHR-3 46.1 48.4 51.1 63.8 65.5 67.9
Table 11. Data of Maximum Rate of Pressure Rise (MRPR) at peak load operation MRPR (bar/deg)
Engine Version
Pure Diesel operation MOBD operation
Injection Pressure (bar) Injection Pressure (bar)
190 230 270 190 230 270
CE 3.1 3.3 3.4 2.6 2.8 3.1
LHR-1 3.0 3.3 3.4 3.3 3.4 3.6
LHR-2 2.9 3.2 3.3 3.4 3.5 3.6
LHR-3 2.7 2.8 2.9 3.5 3.6 3.7
This trend of increase of MRPR indicated better and faster energy substitution and utilization by MOBD, which could replace 100% diesel fuel. However, these combustion characters were within the limits hence MOBD could be effectively substituted for diesel fuel
87
increase of injection pressure in different versions of the engine, with MOBD operation. From the Table, it can be noticed that the magnitude of TOPP decreased (shifted towards TDC) with the increasing of injection pressure in all versions of the engine. This was confirmed that both versions of the engine showed improvement in performance, when the injection pressures increased. TOPP was more with MOBD in CE when compared to pure diesel operation on the CE.
Table 12. Data of Time of occurrence of Peak Pressure (TOPP) at peak load operation TOPP (bar/deg)
Engine Version
Pure Diesel operation MOBD operation
Injection Pressure (bar) Injection Pressure (bar)
190 230 270 190 230 270
CE 9 9 8 11 11 11
LHR-1 9 9 9 10 10 10
LHR-2 10 10 9 9 9 9
LHR-3 11 10 9 9 9 9
.
This was due to higher ignition delay with the MOBD when compared to pure diesel fuel. This once again established the fact by observing lower peak pressures and higher TOPP, that CE with MOBD operation showed the deterioration in the performance when compared to pure diesel operation on CE.
4. CONCLUSIONS
LHR versions of the engine were suitable for biodiesel operation. Performance improved with MOBD operation on LHR versions of the engine, particularly LHR-3 version of the engine. However, performance deteriorated with pure diesel at peak load operation with LHR versions of the engine at peak load operation.
5. ACKNOWLEDGMENTS
Authors thank authorities of Chaitanya Bharathi Institute of Technology, Hyderabad for providing facilities for carrying out research work. Financial assistance provided by All India Council for Technical Education (AICTE), New Delhi, was greatly acknowledged.
6. REFERENCES
[1]. Pramanik, K.,Properties and use of jatropha curcas oil and diesel fuel blends in compression ignition engine”, Journal of Renewable Energy, 28(2), 239- 48, (2003).
[2]. Pugazhvadivu, M. and Jayachandran, K., Investigations on the performance and exhaust emissions of a diesel engine using preheated waste frying oil as fuel, Renewable energy, 30(14), 2189-2202, (2005).
[3]. Agarwal, D. and Agarwal, A.K, Performance and emissions characteristics of jatropha oil (preheated and blends) in a direct injection compression ignition engine, Int.J. Applied Thermal Engineering, 27, 2314-23, (2007).
[4]. Misra, R.D., Murthy, M.S. Straight vegetable oils usage in a compression ignition engine—A review, Renewable and Sustainable Energy Reviews, 14, 3005–3013, (2010).
[5]. Jiwak Suryawanshi, (Performance and emission characteristics of CI engine fueled by coconut oil methyl ester, SAE Paper No. 2006-32-0077, (2006)..
[6]. Murugesan, A., Umarani, C., Subramanian,R. and Nedunchezhian, N., Bio-diesel as an alternate fuel for diesel engines, Renewable and Sustainable Energy Reviews, 13(3), 653-662, (2009).
[7]. Sahoo, P.K., Das, L.M.,Babu, M.K.G., Arora, P., Singh, V.P., Kumar, N,R. and Varyani, T.S., Comparative evaluation of performance and emission characteristics of jatropha, curanja and polanga based biodiesel as fuel in tractor engine, Fuel, 88(9), 1698-170, (2009). [8]. Jindal, S., Nandwana, B.P., Rathore, N.S. and Vashistha,V., Experimental investigation of the effect of compression ratio and injection
pressure in a direct injection diesel engine running on Jatropha methyl ester, Applied Thermal Engineering, 30,442–448, (2010). [9]. Ekrem, B. Tahsin, E. and Muhammet, C, Effects of thermal barrier coating on gas emissions and performance of a LHR engine with
different injection timings and valve adjustments. Journal of Energy Conversion and Management, 47, 1298-1310, (2006).
[10]. Ciniviz, M., Hasimoglu, C., Sahin, F. and Salman, M. S., Impact of thermal barrier coating application on the performance and emissions of a turbocharged diesel engine, Proceedings of The Institution of Mechanical Engineers Part D-Journal Of Automobile Engineering, 222 (D12), 2447–2455, (2008).
[11]. Hanbey Hazar, Effects of bio-diesel on a low heat loss diesel engine, Renewable Energy, 34, 1533–1537, (2009).
[12]. Modi, A.J. and Gosai, D.C., Experimental study on thermal barrier coated diesel engine performance with blends of diesel and palm bio-diesel, SAE International Journal of Fuels and Lubricants, 3 (2), 246-259, (2010).
[13]. Rajendra Prasath, B., Tamilporai, P. and Mohd. Shabir, FAnalysis of combustion, performance and emission characteristics of low heat rejection engine using biodiesel” International Journal of Thermal Sciences , 49, 2483-2490, (2010).
[14]. Rama Mohan, K., Vara Prasad, C.M. and Murali Krishna, M.V.S., (Performance of a low heat rejection diesel engine with air gap insulated piston,ASME Journal of Engineering for Gas Turbines and Power,121(3),530-54, 1999).
[15]. Murali Krishna, M.V.S., Performance evaluation of low heat rejection diesel engine with alternate fuels, PhD Thesis, J. N. T. University, Hyderabad, (2004).