Characterizing the Epidemiological Transition
in Mexico: National and Subnational
Burden of Diseases, Injuries, and Risk Factors
Gretchen Stevens1,2,3*, Rodrigo H. Dias2, Kevin J. A. Thomas4, Juan A. Rivera5, Natalie Carvalho2, Simo´n Barquera5, Kenneth Hill2, Majid Ezzati1,2
1Harvard School of Public Health, Boston, Massachusetts, United States of America,2Harvard Initiative for Global Health, Cambridge, Massachusetts, United States of America,3World Health Organization, Geneva, Switzerland,4Pennsylvania State University, University Park, Pennsylvania, United States of America,5Instituto Nacional de Salud Pu´blica, Cuernavaca, Mexico
Funding:This project was funded by the Secretarı´a de Salud (Mexico). The sponsor of this study had no role in study design, data collection, data analysis, data interpretation, writing of the report, or the decision to publish.
Competing Interests:The authors have declared that no competing interests exist.
Academic Editor:Martin Tobias, New Zealand Ministry of Health, New Zealand
Citation:Stevens G, Dias RH, Thomas KJA, Rivera JA, Carvalho N, et al. (2008) Characterizing the epidemiological transition in Mexico: National and subnational burden of diseases, injuries, and risk factors. PLoS Med 5(6): e125. doi:10.1371/ journal.pmed.0050125
Received:December 17, 2007 Accepted:May 1, 2008 Published:June 17, 2008 Copyright:Ó2008 Stevens et al. This is an open-access article distributed under the terms of the Creative Commons Attribution License, which permits unrestricted use, distribution, and reproduction in any medium, provided the original author and source are credited.
Abbreviations:BMI, body mass index; DALY, disability-adjusted life year; GBD, Global Burden of Disease; MCMA, Mexico City Metropolitan Area; PAF, population attributable fraction; YLD, years lived with disability; YLL, years of life lost to premature death
* To whom correspondence should be addressed. E-mail: stevensg@ who.int
A B S T R A C T
Background
Rates of diseases and injuries and the effects of their risk factors can have substantial subnational heterogeneity, especially in middle-income countries like Mexico. Subnational analysis of the burden of diseases, injuries, and risk factors can improve characterization of the epidemiological transition and identify policy priorities.
Methods and Findings
We estimated deaths and loss of healthy life years (measured in disability-adjusted life years [DALYs]) in 2004 from a comprehensive list of diseases and injuries, and 16 major risk factors, by sex and age for Mexico and its states. Data sources included the vital statistics, national censuses, health examination surveys, and published epidemiological studies. Mortality statistics were adjusted for underreporting, misreporting of age at death, and for misclassification and incomparability of cause-of-death assignment. Nationally, noncommuni-cable diseases caused 75% of total deaths and 68% of total DALYs, with another 14% of deaths and 18% of DALYs caused by undernutrition and communicable, maternal, and perinatal diseases. The leading causes of death were ischemic heart disease, diabetes mellitus, cerebrovascular disease, liver cirrhosis, and road traffic injuries. High body mass index, high blood glucose, and alcohol use were the leading risk factors for disease burden, causing 5.1%, 5.0%, and 7.3% of total burden of disease, respectively. Mexico City had the lowest mortality rates (4.2 per 1,000) and the Southern region the highest (5.0 per 1,000); under-five mortality in the Southern region was nearly twice that of Mexico City. In the Southern region undernutrition and communicable, maternal, and perinatal diseases caused 23% of DALYs; in Chiapas, they caused 29% of DALYs. At the same time, the absolute rates of noncommunicable disease and injury burdens were highest in the Southern region (105 DALYs per 1,000 population versus 97 nationally for noncommunicable diseases; 22 versus 19 for injuries).
Conclusions
Mexico is at an advanced stage in the epidemiologic transition, with the majority of the disease and injury burden from noncommunicable diseases. A unique characteristic of the epidemiological transition in Mexico is that overweight and obesity, high blood glucose, and alcohol use are responsible for larger burden of disease than other noncommunicable disease risks such as tobacco smoking. The Southern region is least advanced in the epidemiological transition and suffers from the largest burden of ill health in all disease and injury groups.
Introduction
Knowledge about the relative contributions of diseases, injuries, and their risk factors to the loss of healthy life is needed for priority setting and for evaluation of health programs. Most previous analyses of disease, injury, and risk factor burden have been at the national or global scale [1–6]. In many countries, health policies and programs are implemented and evaluated at the subnational level (e.g., at the state level). Therefore, subnational analyses and evidence are essential for debate, discourse, and cooperation among different levels of government on health policies and allocation of resources to health programs, as well as for understanding disparities in health across regions. There have been few subnational analyses of the burden of disease [7]; more subnational analyses of mortality are available [8,9]. Mexico has experienced several decades of rapid epide-miological and demographic change, making a combined national and subnational analysis of the burden of diseases, injuries, and their risk factors timely. Nationally, such an analysis can reveal the extent, and the nutritional and environmental determinants, of the epidemiological transi-tion. In the epidemiological transition, the profile of population health evolves from one characterized by high mortality and infectious diseases (typical of poor countries) to one in which mortality rates are low and noncommuni-cable diseases cause the majority of deaths (typical of wealthy countries) [10–12]. A national analysis can contribute to the very limited systematic analysis of specific disease and risk factor drivers of the epidemiological transition. Extending the analysis to the subnational level can reveal epidemio-logical similarities, heterogeneities, and disparities, and their implications for targeting policies and programs. In Mexico, a subnational analysis can indicate whether regions are at different stages of the epidemiological transition (as pre-viously observed [13,14]), and whether the transition has the same disease, injury, and risk factor drivers across regions. Such evidence is especially relevant because states are an important unit for resource allocation under Mexico’s recent health system reform [15].
We estimated deaths and loss of healthy life years (measured in disability-adjusted life years [DALYs]) from a comprehensive list of diseases and injuries and from 16 risk factors in Mexico and its states for 2004. The findings enhance our understanding of the epidemiological transition because we incorporate specific diseases, injuries, and risk factors into the transition framework. In addition to the utility of our findings for Mexico, this analysis can provide a model, and illustrate data and information needs, for epidemiological assessments in other countries.
Methods
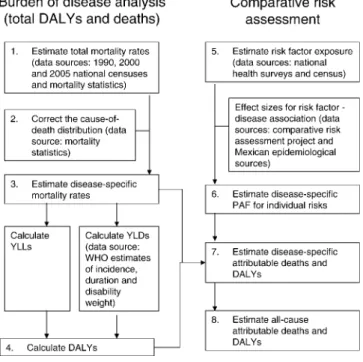
We calculated mortality and burden of disease from a comprehensive set of diseases and injuries and from selected risk factors in 2004 using the methods and data sources described below (Figure 1 provides a schematic overview of the analysis steps). All analyses were performed at the state level, by sex and age. For presentation, we grouped the 32 Mexican states into six geographic regions on the basis of per-capita income, total mortality, and a composite deprivation index (Figure S1, Table S1). The Northern and the Pacific
Central regions are the most socially and economically developed and have relatively close cultural and economic links to the United States. The Southern region is the least developed and has significantly higher poverty and indige-nous population than other regions. Mexico City is a highly urbanized, wealthy region with excellent infrastructure but with immigration from poor areas in the Central, Gulf, and Southern regions. Regional and national results were ob-tained by aggregating state-level results.
Mortality and Causes of Death
Total mortality rates.Although the great majority of deaths are recorded in Mexico, mortality underreporting is suspected in specific regions and among specific age groups. Misreport-ing of age at death, migration, or incomplete census coverage may also bias mortality rates calculated using vital registration data. To address these potential sources of bias, we adjusted total mortality by age, sex, and state. We applied the Trussell version of the Brass method [16] to the 1990, 2000, and 2005 census data on children-ever-born and children-dead to calculate the probability of dying before 5 y of age in each state. We calculated adjusted adult death rates using the General Growth Balance method [17,18]. We then interpolated age- and sex-specific mortality rates between mortality levels of the‘‘West family’’of Coale-Demeny life-tables [19].
Causes of death. In Mexico, all recorded deaths are medically certified and coded according to the International Classification of Disease (ICD) system (10th revision). The medical information available at the time of death and certification practices vary by region, leading to incompara-ble recorded cause of death data. We adjusted the observed cause-of-death distribution for assignment to ill-defined codes and for incomparability of cause-of-death assignment across states as follows (see Table S2 and Text S1 for details): Figure 1.Steps of the Analysis
All calculations were carried out by age group, sex, and state. National and regional estimates of deaths, DALYs, and attributable disease burden were calculated as the sum of state estimates.
doi:10.1371/journal.pmed.0050125.g001
(i) we redistributed deaths assigned to ill-defined ICD codes and to cancers with unknown sites following the Global Burden of Disease (GBD) study algorithms [20]. (ii) Cardio-vascular deaths assigned to ill-defined cardioCardio-vascular codes versus ischemic heart disease were redistributed using individual-level records and variables that affect compara-bility of certification [21]. (iii) Deaths assigned to diabetes mellitus versus cardiovascular and other noncommunicable and communicable diseases were also redistributed using individual-level records and variables that affect compara-bility of certification [22]. (iv) We redistributed injury deaths assigned to several ill-defined codes for unintentional injuries pro rata to road traffic injuries, falls, drowning, and other unintentional injuries. (v) Finally, 3,329 deaths (less than 1% of all deaths) were assigned to codes for alcohol use disorders (a neuropsychiatric condition) as the underlying cause of death. Many of these deaths were assigned another disease (e.g., an injury, ischemic heart disease, or cirrhosis of the liver) as one of the multiple contributing causes of death. We judged that when another disease was included as a contributing cause of death, alcohol use was likely a more distal contributor to death (i.e., a risk factor). Therefore, we assigned these deaths to the corresponding associated cause. After adjusting the cause-of-death distribution, we grouped diseases into the exhaustive GBD list of 136 diseases.
Disease-specific death rates.We estimated disease-specific death rates by applying the adjusted distribution of the causes of death to the adjusted total mortality figures (Table S3).
Burden of Disease and Injury
Burden of disease was measured in DALYs. DALYs are the sum of the years of life lost to premature death (YLL) and years lived with disability (YLD). Following the GBD study [2], we calculated DALYs using age weights and a discount rate of 3%; the effects of these two normative components of DALYs are examined in detail elsewhere [23]. We calculated YLL using age- and disease-specific deaths, and YLD using estimates of incidence and duration of nonfatal diseases for Mexico and for the low-mortality countries in the World Health Organization Region of the Americas (AMR-B), and disability weights for each disease from the GBD study [20]. The methods used to calculate DALYs for individual diseases and injuries from these inputs are described in Table S4, Text S2, and elsewhere [20].
Comparative Risk Assessment
We used the comparative risk assessment methods, de-scribed in detail elsewhere [3,24], to estimate deaths and DALYs attributable to 16 selected risk factors. In summary, to calculate deaths and disease burden attributable to a risk factor, we first calculated the population attributable fraction (PAF) for each disease affected by each risk factor. PAF measures the proportional reduction in mortality or disease burden that would be observed if risk factor exposure were reduced to an alternative (counterfactual) distribution. Inputs to the PAF calculation are (i) current distribution of exposure to a risk factor, (ii) relative risks for each disease caused by the risk factor, and (iii) a counterfactual distribution of exposure to which current exposure is compared. We used a counter-factual exposure distribution that results in the lowest possible population risk, known as the theoretical-mini-mum-risk exposure distribution (Table S5). Using this
counterfactual allows quantifying the effects of all levels of nonoptimal exposure in a consistent and comparable manner for all risk factors. When relative risks for death and incidence were different, we calculated separate PAFs for mortality/YLL and for YLD. Deaths, YLL, and YLD from each disease attributable to each risk factor were calculated by multiplying PAF by total mortality, YLL, or YLD from that disease. The attributable deaths and DALYs were summed across all diseases and injuries affected by each risk factor. We also calculated PAFs for combined exposure to selected groups of risk factors, using methods described in detail elsewhere [25]. We measured risk factor exposure using data from subtionally representative health examination surveys, the na-tional census, and Mexican epidemiological studies (Table S5). For most risk factors, data on exposure came from the National Health and Nutrition Survey 2006 (ENSANut), which was administered to 94,710 individuals in 48,304 households and is representative at the state level [26]. This sample size is larger than health examination surveys in most developed countries, most of which are not representative at the state level.
We primarily used relative risks from meta-analyses of epidemiological studies carried out world-wide (Table S5). Using meta-analyses reduces influence of bias and variability that may be present in individual epidemiological studies, especially the smaller studies. Cross-country epidemiological studies have demonstrated that relative risks for most risk factor effects are similar across populations [27], indicating that combining and applying international studies to Mexico is appropriate. However, we did not use relative risks from international meta-analyses for the effects of (i) alcohol use on injuries and (ii) unsafe sex on HIV/AIDS. For these risks and disease outcomes, the proportional increase in risk caused by exposure may be affected by local socio-demographic, epidemiologic, and policy factors (e.g., drinking and driving behaviors and law enforcement; the prevalence of HIV infection among individuals engaging in risky sex behaviors). For this reason, we used epidemiological studies from Mexico to quantify the effects of alcohol use on injuries (Table S5). To estimate the proportion of HIV/AIDS attributable to unsafe sex, we used data on probable transmission route recorded in the National HIV/AIDS Registry [28].
Results
Mortality, Causes of Death, and Burden of Diseases and Injuries
expectancy ranged from 70.6 y (similar to that of Guatemala) in the Southern region to 73.8 y in the Pacific Central region (similar to Chile). Female life expectancy ranged from 75.3 y in the Pacific Central region (similar to Ecuador) to 79.1 y in the central region (like the Czech Republic and only 1 y lower than female life expectancy in the US; Table S1).
Despite its status as a middle-income country, total mortality in Mexico (and particularly in the Mexico City Metropolitan Area [MCMA]) was more similar to mortality in high-income countries than in other middle-income nations (Figure 2). Within Mexico, mortality was highest in the Southern region, where age-standardized death rates were 27% higher than in the MCMA. Under-five mortality varied substantially more across regions than total mortality (Figure 3), with under-five mortality in the Southern region (7.0 per 1,000 children) more than twice that of the Pacific Central region (3.1 per 1,000). Under-five mortality in the Southern region was higher than the average in all lower-middle
income countries, whereas in other regions it was similar to, or lower than, the upper-middle income countries.
Nationally, 75% of total deaths were from noncommuni-cable (group II) diseases. The leading causes of death were a number of group II diseases, including ischemic heart disease, diabetes, cerebrovascular disease, and cirrhosis of the liver, as well as road traffic injuries and lower respiratory infections (Table 1). After adjustment for inconsistent cause of death assignment, 9.7% of deaths were caused by diabetes, with particularly high mortality in the MCMA and Pacific Central regions (4.9 per 10,000; all disease rates are age-standardized to Mexico’s population in 2000; Figure 2). Liver cirrhosis mortal-ity was high throughout Mexico, but there were variations across regions, with mortality in the Southern and Gulf regions nearly twice the Northern region and the MCMA (3.7 and 3.2 per 10,000 MCMA versus 1.7 and 2.1 per 10,000). Cirrhosis mortality among men was nearly four times that of women (4.0 per 10,000 versus 1.1 per 10,000). Among males in the Southern and Gulf regions (the most highly affected groups), liver cirrhosis caused 11.9% and 11.2% of deaths, respectively.
Communicable, maternal, perinatal, and nutritional (group I) diseases were the underlying cause of 14% of deaths nationally. The death rate from group I diseases in the Southern region (8.7 per 10,000) was nearly twice those in the Pacific Central region and the MCMA (5.1 and 5.2 per 10,000). Regional disparities were even greater for pneumonia and diarrhea mortality among children; under-five mortality from these two diseases in the Pacific Central region was 2.5 per 10,000, more similar to high-income countries (0.25 per 10,000) than other upper-middle-income countries (7.8 per 10,000); rates in the Southern region were 13.7 per 10,000, a figure typical of lower-middle-income countries (Figure 3).
Group II diseases accounted for 68% of DALYs nationally and many noncommunicable diseases were among the leading causes of disease burden (Table 1). At the same time, there were more group I diseases and injuries (group III) among the leading causes of disease burden than among deaths. This occurred because group I diseases disproportionately affect children, and injuries mainly affect young adults, both resulting Figure 2.Age-Standardized Mortality Rates (A) and Burden of Disease Rates (B) for Mexico and Its Regions, Divided by Disease Category
For comparison, the figure also shows mortality rates for all high-income and low-and-middle-income countries [52]. All rates are standardized to the 2000 national population of Mexico. Regions used to present results are: Northern: Baja California, Baja California Sur, Coahuila, Chihuahua, Nuevo Leo´n, Sonora, Tamaulipas; Pacific Central: Aguascalientes, Colima, Jalisco; Central: Durango, Guanajuato, Michoaca´n, Morelos, Nayarit, Quere´taro, San Luis Potosı´, Sinaloa, Tlaxcala, Zacatecas, and parts of Mexico State not in the Mexico City region; Mexico City: Distrito Federal and parts of Mexico State in the contiguous urban area; Gulf: Campeche, Quintana Roo, Tabasco, Veracruz, Yucata´n; Southern: Chiapas, Guerrero, Hidalgo, Oaxaca, and Puebla (Table S1). Key: Ca, cancers; Cir, liver cirrhosis; Com, communicable; CVD, cardiovascular; DM, diabetes; Inj, injuries; Mat, maternal, perinatal, and nutritional; NCom, other noncommunicable; NP, neuropsychiatric.
doi:10.1371/journal.pmed.0050125.g002
Figure 3.National and Regional Under-Five Mortality Rates, Divided by Disease Category
For comparison, the figure also shows the rates for all high-income, upper- and lower-middle-income, and low-income countries [52]. Key: Com, other communicable; Diar, diarrhea; Inj, injuries; NCom, other noncommunicable; Perinatal, perinatal; Resp, respiratory infections. doi:10.1371/journal.pmed.0050125.g003
in relatively large YLLs compared to noncommunicable diseases. Among group II diseases, a large burden was associated with neuropsychiatric conditions, to which few deaths are directly assigned. This occurred partly because these diseases are most common among young and middle-aged adults, who form a large proportion of Mexico’s population.
In every region and state, noncommunicable diseases caused the majority of DALYs, ranging from 63% in the Southern region to 72% in the MCMA and Pacific Central regions. Although the proportion of disease burden from group II diseases was lowest in the Southern region, their absolute effect, measured as DALYs per 1,000 population, was highest there (104 per 1,000 versus 96–98 per 1,000 in other regions; Figure 2). With the exception of liver cirrhosis, there was little variability in group II DALY rates among the other regions. Cirrhosis burden of disease showed the same regional and sex patterns as cirrhosis mortality.
A comparison of the leading causes of disease burden by region shows the regional disparities in maternal and child diseases: in the Southern region, birth asphyxia and lower respiratory infections were the first and third leading causes of disease burden, respectively, with about twice as many DALYs per 1,000 population as the national average.
Uniquely, diarrhea was also one of the ten leading causes of disease burden in Chiapas, the poorest state in Mexico.
The rate of road traffic deaths was lowest in the MCMA, a highly motorized region (2.9 per 100,000 versus 4.1 per 100,000 nationally), and was also low in a highly motorized, wealthy state (Nuevo Leo´n; 3.1 per 100,000). Despite their high rates of motorization, road traffic mortality may be low in these areas due to several factors, including quality of emergency care and lower pedestrian exposure to traffic [32]. Among other states, the lowest rate of road traffic deaths was in Chiapas (1.8 per 100,000), likely due to fewer roads and cars, and thus low exposure to vehicular traffic. Homicide was among the six leading causes of disease burden in every region except the Gulf region. Homicide death rates were generally higher along the Pacific coast of Mexico (3.6–7.2 per 100,000 versus 2.1 per 100,000 nationally), and particularly in Guerrero. These were followed by the MCMA and states in the Northwest of Mexico.
Comparative Risk Assessment
Nationally, and in every state and region, risk factors for noncommunicable diseases contributed the most to the burden of disease (Figure 4, Table 1). Jointly, alcohol use,
Table 1.Leading Causes of Death and Disability in Mexico (2004), by Disease and Risk Factor
Category Leading Causes of Death
Percentage of Total Deaths Leading Causes of Disease Burden
Percentage of Total DALYs
Both Sexes (n¼468,000)
Men
(n¼264,000)
Women (n¼205,000)
Both Sexes (n¼14,560,000)
Men
(n¼7,896,000)
Women (n¼6,664,000)
Disease Ischemic heart disease
13.0 12.6 13.6 Unipolar depressive
disorders
6.2 4.2 8.6
Diabetes mellitusa 9.7 7.9 12.1 Road traffic collisions 4.6 6.5 2.4
Cerebrovascular disease
6.0 5.1 7.1 Birth asphyxia and
birth trauma
4.3 4.6 4.0
Cirrhosis of the liver 5.5 7.5 2.9 Diabetes mellitus 3.5 3.0 4.2
Road traffic collisions
4.4 6.1 2.1 Ischemic heart
disease
3.1 3.6 2.6
Chronic obstructive pulmonary disease
4.0 4.0 3.9 Cirrhosis of
the liver
3.0 4.4 0.0
Lower respiratory infections
3.9 3.7 4.1 Violence
(homicide)
2.9 4.6 0.0
Hypertensive heart disease
3.2 2.5 4.1 Asthma 2.4 2.3 2.5
Birth asphyxia and birth trauma
3.0 3.2 2.8 Alcohol use
disorders
2.4 3.6 0.0
Nephritis and nephrosis
2.6 2.5 2.8 Lower respiratory
infections
2.3 2.4 2.3
Risk factorb
High blood glucose
14.1 11.6 17.3 Alcohol usec 7.3 11.4 2.4
High BMI 12.2 9.9 15.1 High BMI 5.1 4.3 6.0
High blood pressure
9.9 8.8 11.4 High blood glucose 5.0 4.5 5.6
Alcohol usec 8.3 12.1 3.3 High blood pressure 2.4 2.4 2.3
Tobacco smoking 5.2 6.0 4.3 Unsafe sex 1.8 1.9 1.7
Low fruit and vegetable intake
4.6 4.6 4.5 Low fruit and
vegetable intake
1.4 1.6 1.2
Physical inactivity 4.4 3.8 5.0 High cholesterol 1.2 1.3 1.1
High cholesterol 3.5 3.1 4.1 Physical inactivity 1.2 1.1 1.3
Urban air pollution 1.6 1.5 1.7 Childhood and
maternal underweight
1.1 1.1 1.1
Unsafe sex 1.0 1.5 0.4 Tobacco smoking 1.1 1.4 0.6
a
The adjustments to correct for coding incomparability across states (see Methods) shifted diabetes from the leading to second leading cause of death in Mexico. b
Deaths attributed to multiple risk factors may not be summed, as some deaths are caused by more than one exposure [25]. c
Figure 4.Mortality (A) and Burden of Disease (B) Attributable to Leading Risk Factors in Four Mexican Regions, Divided by Disease Category
The rates in this figure were not age-standardized. Therefore, the observed regional variation in attributable mortality and burden of disease is partly due to regional variation in age structure. Key: Ca, cancers; Cir, liver cirrhosis; Com, communicable; CVD, cardiovascular; DM, diabetes; Inj, injuries; Mat, maternal, perinatal, and nutritional; NCom, other noncommunicable.
doi:10.1371/journal.pmed.0050125.g004
PLoS
Medicine
|
www.plos
medicine.or
g
June
2008
|
Volume
5
|
Issue
6
|
e125
0905
Subnational
Burden
of
Disease
in
high blood pressure, high body mass index (BMI), high cholesterol, low fruit and vegetable intake, physical inactivity, tobacco smoking, and high blood glucose accounted for an estimated 36% of deaths and 16% of disease burden. Among these risks, alcohol use, high blood glucose, and high BMI were responsible for the largest disease burden (Table 1), in aggregate as well as in young and middle-aged adults (15–60 y). Fasting blood glucose levels (age-standardized mean of 5.5 mmol/l for men and 5.6 mmol/l for women) and BMI (27.6 kg/ m2for men and 29.1 kg/m2for women) in Mexico were among the highest observed worldwide [33,34]. The disease burden attributable to alcohol use was largely due to its effects on alcohol use disorders, injuries, and liver cirrhosis, all three of which contributed approximately equally to total burden caused by alcohol use.
Mortality and burden of disease caused by high blood cholesterol and tobacco smoking were relatively low in comparison to those associated with high BMI, blood glucose, and blood pressure (Table 1). This was due to lower measured exposure to these risks: mean blood cholesterol in the 2006 ENSANut, used for this analysis, was 4.4 mmol/l for men, 4.5 mmol/l for women, low by international standards and also lower than was found in prior nationally representative surveys in 1987–1988 and 2000 [35,36]. Using mean blood cholesterol measured in 2000 [36] would double deaths attributable to high blood cholesterol, and make this risk factor the fifth leading cause of death. The differences in mean blood cholesterol measured in the various recent national surveys should be investigated. Although smoking prevalence in Mexico is similar to that of many high-income countries, especially for men (36% for men and 13% for women), nearly half of smokers do not smoke daily, and most of the remainder smoke fewer than five cigarettes per day [37]. Low smoking intensity can also be seen in consumption figures: despite having a slightly higher prevalence of smoking than the US, Mexican adults consumed an average of 712 cigarettes per year, compared to 2,081 in the US [38]. Our method for quantifying exposure to tobacco smoking (Table S5) accounts for this lower intensity in the estimated effects. Regionally, the largest proportional effects of tobacco smoking on mortality and burden of disease were in the wealthiest regions, in particular the Northern region, where it was responsible for 9% of deaths (Figure 4). In contrast, mortality and burden of disease caused by alcohol use were negatively correlated with economic development, and were highest in the Southern region, followed by the Central region. Regional patterns of deaths associated with alcohol use were caused primarily by differences in liver cirrhosis rates, and were less affected by the effects of alcohol use on other disease and injury outcomes.
Nationally, the burden of disease attributable to risk factors that affect child mortality, including child and maternal underweight and micronutrient deficiencies, unsafe water and sanitation, and indoor air pollution from solid fuels, were relatively small. These risks together were responsible for 2.3% of all deaths and 2.7% of disease burden (10.1% of deaths and 8.9% of DALYs under 5 y of age). There were however important regional patterns and disparities in the proportional and absolute effects of these risks: in the Northern region, where exposure to these risk factors was low, together they were responsible for less than 2% of under-five deaths (Figure 5). It is likely that in this
region, medical interventions such as improved neonatal care are needed to further reduce infant mortality rates to levels observed in high-income countries. In contrast, the same risk factors were together responsible for 16% of under-five deaths in the Southern region. The Southern region also had a higher under-five mortality rate, likely caused by risk factor exposures and less access to case management. This created a highly unequal regional gradient in the absolute effects of these risks. The South-to-North ratio of rates of under-five mortality attributable to risk factors in this study ranged from 3.3 for vitamin A deficiency, with a well-established national supplementation program, to 18 for indoor air pollution from solid fuels. Unlike in other states, in Chiapas the burden of disease attributable to childhood and maternal under-weight (4.9 DALYs per 1,000 population) was nearly as large as that of high blood glucose and high BMI (5.1 and 5.0 DALYs per 1,000).
Discussion
In this paper, we used detailed, consistent, and comparable data and analyses to establish the role of diseases, injuries, and their risk factors in the loss of health in Mexico, and identified patterns by age, sex, and region. This analysis demonstrated that the national burden of disease in Mexico is dominated by noncommunicable diseases and their risk factors, consistent with the epidemiological and nutritional transition framework [10–12,39]. Further, the analysis re-vealed important disease and risk factor patterns that distinguish Mexico from high-income countries at broadly similar stages of the epidemiological transition: the liver cirrhosis and diabetes mortality in Mexico were substantially higher than in high-income countries, but those of other noncommunicable diseases, such as cardiovascular diseases, were comparable. Mirroring these disease patterns, the highest mortality and burden of disease were caused by the high blood glucose, high BMI, and alcohol use risk factors, with lower burden of disease attributable to tobacco smoking, which was primarily due to lower exposure to tobacco. This finding of the highest mortality and disease burden shows the need for further research on the role of genetic, dietary, and other environmental and health system factors as determi-nants of high blood glucose and high BMI in Mexico.
be having larger subnational surveys with self-reported indicators, which are calibrated against direct measurement for a subset of participants [40,41].
This study has several limitations. First, while we used high-quality mortality and risk factor data, substantially less data were available to estimate disease incidence and duration, which are used to calculate the disability associated with nonfatal outcomes (i.e., YLDs). This is a relatively common, although not universal, phenomenon [20], because deaths are routinely recoded as a part of countries’ vital registration, but disease incidence or duration are rarely recorded directly. These epidemiological parameters may be recorded in small, nonrepresentative studies. As a result of these data limi-tations, for most diseases we relied partially or entirely on regional incidence rates from the GBD study, which incorporated data sources from Mexico as well as other countries, rather than relying exclusively on Mexican data. Future research should compare the implications of using multiple data sources from a larger geographic area with disease modeling, versus using fewer local studies to calculate disease incidences. Second, we analyzed only selected risks to health in the comparative risk assessment. Hundreds of risk exposures are potentially harmful to human health; consid-ering an exhaustive set of exposures was out of the scope of this analysis. Potentially important omitted risks for Mexico include specific dietary factors. Estimating the population effects of dietary risks is constrained by difficulties in measuring exposure, both for absolute intake and
composi-tion [42]. Given the importance diseases associated with high BMI and blood glucose, further analysis of dietary patterns and risk factors should be a research priority in Mexico. Third, data on fasting blood glucose was only available for a nonrepresentative subset of the Mexican population, and therefore we used regression analysis to predict fasting blood glucose for the general population (Table S5). Our relatively high estimates of fasting blood glucose are consistent with findings in a nonrepresentative survey of rural Mexicans and with the high diabetes death rates [43]. Finally, relative risks for most risk factors were from large international meta-analyses, complemented with Mexican sources (Table S5). Relative risks, which quantify the proportional relationship between exposure and outcome, have been shown to be consistent across populations for most risk factors and diseases [27]; yet further analyses of heterogeneity, especially for relationships such as high BMI and diabetes or alcohol use and liver cirrhosis would reduce the uncertainty of our results. For injuries as a result of alcohol use, despite using epidemiological evidence from Mexico, uncertainty remains because this association may vary even among different parts of the same country.
A prior analysis of burden of disease in Mexico for 1991 found that Mexico faced a triple burden of disease, with injuries (violence and road traffic injuries), infectious disease (lower respiratory infections and diarrhea), and noncommu-nicable diseases (cirrhosis of the liver) all among the leading five causes of disease burden [1]. In our analysis, perinatal Figure 5.Under-Five Mortality Attributable to Leading Risk Factors in Four Mexican Regions, Divided by Disease Category
Key: Comm, other communicable; Diar, diarrhea; Inj, injuries; NCom, other noncommunicable; Perinatal, perinatal; Resp, respiratory infections. doi:10.1371/journal.pmed.0050125.g005
conditions continued to be a leading cause of DALYs. Lower respiratory infections remained among the leading causes of disease burden in 2004 but shifted from the sixth to the tenth leading cause of DALYs. Noncommunicable diseases, partic-ularly neuropsychiatric conditions, diabetes, and cardiovas-cular diseases, made up the majority of the leading causes of loss of healthy life. Injuries, particularly road traffic injuries, remained important causes of loss of healthy life, but both their share of burden and their absolute rates have decreased since 1991. While these analyses are not directly comparable because of differences in methods, data sources, and disease categories used, they do illustrate that the health challenges that Mexico faces have transitioned toward predominantly noncommunicable diseases.
Coupled with these national results, our analysis demon-strated subnational patterns of diseases and risk factors, with implications for health policies and programs and for health equity. Subnational analyses showed a strong regional and sex pattern of liver cirrhosis mortality, and of the burden of disease attributable to alcohol use, with the highest burden in the most marginalized areas (the Southern, Central, and Gulf regions). The extremely high liver cirrhosis rates found in some parts of the country cannot be explained by the quantity of alcohol consumed (which is lower in Mexico than in the US or most European nations) [44]; rather they may be related instead to beverage type, pattern of consumption, or quality of alcohol, as hypothesized in a number of studies [45,46]. Ecologic analyses have found a strong correlation betweenpulque (a traditional fermented alcoholic beverage) and spirits consumption and liver cirrhosis rates in Mexico [47,48]. Other possible factors may include past hepatitis infection (though recent surveys have found moderate seroprevalence of hepatitis B [49] and hepatitis C [50]) or dietary and metabolic factors [51]; some cause-of-death misclassification cannot be ruled out. Of these factors, only alcohol use explains the higher cirrhosis mortality among men.
The national finding in which noncommunicable diseases and their risks represent the largest share of disease burden also masks the large proportional and absolute effects of risk factors that affect under-five mortality in the Southern region. The epidemiological transition, in terms of the proportion of deaths caused by maternal and infectious diseases, is least advanced in the Southern region, which is still plagued by high under-five mortality rates and a substantial number of preventable under-five deaths. At the same time, the absolute rates of noncommunicable diseases and injuries were highest in the Southern region. The large absolute burden from all three disease groups, including a younger age of death from many noncommunicable diseases, demonstrates the overall worse health status in this region. A similar pattern was observed in a subnational analysis of mortality in South Africa, where under-five mortality rates were negatively correlated with the level of development, but age-standardized noncommunicable disease rates were sim-ilar across all regions [8]. These findings highlight that the increase in the proportion of deaths caused by noncommu-nicable diseases during the epidemiological transition is a result of a rapid decrease in communicable and maternal causes of death and an aging population. In fact, total age-specific noncommunicable mortality rates also fall during the epidemiological transition. As the epidemiological transition
progresses nationally, high child mortality may remain in less developed regions, as observed in our analysis in Mexico and in South Africa [8]. Injuries and specific noncommunicable causes of death may lag or even decouple from overall group trends due to exposure to specific risk factors, as is the case for diabetes and liver cirrhosis in Mexico. An analysis such as ours can identify such specific details of epidemiological change, and hence provide evidence on which risk factors should be priorities for policy intervention.
Supporting Information
Figure S1. Regions Used for Presentation of Results
Found at doi:10.1371/journal.pmed.0050125.sg001 (1.2 MB DOC).
Table S1. Selected Economic and Health Indicators for Each State and Region
Found at doi:10.1371/journal.pmed.0050125.st001 (112 KB DOC).
Table S2. Adjustments Made to the Recorded Cause-of-Death Distribution
Found at doi:10.1371/journal.pmed.0050125.st002 (45 KB DOC).
Table S3. Deaths in 2004 by Selected Cause, Prior to Adjustment, after Correction for Coding Comparability Only, and after Correc-tion for Coding Comparability, Underreporting, Age Misreporting, and Migration
Found at doi:10.1371/journal.pmed.0050125.st003 (52 KB DOC).
Table S4. Methods Used to Impute Incidence Rates for Mexican States Using Mexican Mortality Data and Incidence Rates for Mexico and for Latin America (the AMR-B Region)
Found at doi:10.1371/journal.pmed.0050125.st004 (43 KB DOC).
Table S5. Risk Factors Considered in This Analysis, Their Exposure Variables, Theoretical-Minimum-Risk Exposure Distributions, Dis-ease Outcomes, and Data Sources for Relative Risks and Exposure Found at doi:10.1371/journal.pmed.0050125.st005 (121 KB DOC).
Text S1. Mortality and Causes of Death
Found at doi:10.1371/journal.pmed.0050125.sd001 (35 KB DOC).
Text S2. Disability-Adjusted Life Years
Found at doi:10.1371/journal.pmed.0050125.sd002 (42 KB DOC).
Acknowledgments
We thank Michael Lisman for coordinating our research. The following people generously shared their expertise during the analysis and writing: Guilherme Borges, Goodarz Danaei, Emmanuela Gakidou, Sandeep Kulkarni, Rafael Lozano, Colin Mathers, Eric Monterrubio Flores, Christopher Murray, Shefali Oza, Kiran Pandey, Ju¨rgen Rehm, Joshua Salomon, Patricia Soliz, Niels Tomijima, and Jorge Villatoro.
Author contributions. GS and ME designed and coordinated the study. KJAT and KH conducted analysis of all-cause mortality. GS, RHD, and NC conducted the analyses of causes of death and disease burden. JAR and SB gathered, and GS analyzed, risk factor exposure data. GS conducted comparative risk assessment analysis. GS and ME wrote the paper with input from other authors. ME oversaw the research and acts as the paper’s guarantor.
References
1. Lozano R, Murray CJL, Frenk J, Bobadilla JL (1995) Burden of disease assessment and health system reform: results of a study in Mexico. J Int Dev 7: 555–563.
2. Murray CJL, Lopez AD (1996) The global burden of disease: a compre-hensive assessment of mortality and disability from diseases, injuries, and risk factors in 1990 and projected to 2020. Boston: Harvard School of Public Health. 990 p.
3. Ezzati M, Lopez AD, Rodgers A, Vander Hoorn S, Murray CJL, et al. (2002) Selected major risk factors and global and regional burden of disease. Lancet 360: 1347–1360.
5. Mahapatra P (2002) Estimating national burden of disease: the burden of disease in Andhra Pradesh, 19909s. Hyderabad: Institute of Health Systems. 6. Lopez AD, Mathers CD, Ezzati M, Jamison DT, Murray CJ (2006) Global and regional burden of disease and risk factors, 2001: systematic analysis of population health data. Lancet 367: 1747–1757.
7. Begg S, Vos T, Barker B, Stevenson C, Stanley L, et al. (2007) The burden of disease and injury Australia 2003. Canberra: Australian Institute of Health and Welfare. 337 p.
8. Bradshaw D, Nannan N, Groenewald P, Joubert J, Laubscher R, et al. (2005) Provincial mortality in South Africa, 2000–priority-setting for now and a benchmark for the future. S Afr Med J 95: 496–503.
9. Murray CJL, Kulkarni SC, Michaud C, Tomijima N, Bulzacchelli MT, et al. (2006) Eight Americas: investigating mortality disparities across races, counties, and race-counties in the United States. PLoS Medicine 3: e260. doi:10.1371/journal.pmed.0030260
10. Preston SH (1976) Mortality patterns in national populations, with special reference to recorded causes of death. New York: Academic Press. 212 p. 11. Omran AR (1971) The epidemiologic transition: a theory of the
epidemiology of population change. Milbank Mem Fund Q 49: 509–538. 12. Salomon J, Murray CJL (2002) The epidemiologic transition revisited:
compositional models for causes of death by age and sex. Popul Dev Rev 28: 205–228.
13. Frenk J, Bobadilla JL, Sepu´lveda Amor JA, Lo´pez Cervantes M (1989) Health transition in middle-income countries: new challenges for health care. Health Policy Plan 41: 29–39.
14. Frenk J, Bobadilla JL, Stern MP (1991) Elements for a theory of the health transition. Health Transit Rev 1: 21–38.
15. Gonza´lez Pier E, Gutie´rrez Delgado C, Stevens G, Barranza Llore´ns M, Porras Condey R, et al. (2006) Priority-setting for health interventions in Mexico’s system of social protection in health. Lancet 368: 1608–1618. 16. Brass W (1975) Methods for estimating fertility and mortality from limited
and defective data. Chapel Hill (North Carolina): University of North Carolina, Chapel Hill.
17. Hill K (1987) Estimating census and death registration completeness. Asian Pac Popul Forum 1: 8–13, 23–24.
18. United Nations (1983) Manual X: indirect techniques for demographic estimation. New York: United Nations.
19. Coale AJ, Demeny P (1983) Regional model life tables and stable populations;Vaughn B editor. Princeton (New Jersey): Princeton University Press.
20. Mathers CD, Lopez AD, Murray CJL (2006) The burden of disease and mortality by condition: data, methods, and results for 2001. In: Lopez AD, Mathers CD, Ezzati M, Jamison DT, Murray CJL, editors. Global burden of disease and risk factors. Washington (D.C.): Oxford University Press and The World Bank. pp. 45–240.
21. Murray CJ, Kulkarni SC, Ezzati M (2006) Understanding the coronary heart disease versus total cardiovascular mortality paradox: a method to enhance the comparability of cardiovascular death statistics in the United States. Circulation 113: 2071–2081.
22. Murray C, Dias RH, Kulkarni SC, Lozano R, Stevens GA, et al. (2007) Improving the comparability of diabetes mortality statistics in the United States and Mexico. Diabetes Care 31: 451–458.
23. Mathers CD, Salomon JA, Ezzati M, Begg S, Vander Hoorn S, et al. (2006) Sensitivity and uncertainty analysis for burden of disease and risk factor estimates. In: Lopez AD, Mathers CD, Ezzati M, Jamison DT, Murray CJ editors. Global burden of disease and risk factors. Washington (D.C.): The World Bank. pp. 399–426.
24. Ezzati M, Lopez AD, Rodgers A, Murray CJL (2004) Comparative quantification of health risks: global and regional burden of disease attributable to selected major risk factors. Geneva: World Health Organization. 2248 p.
25. Ezzati M, Hoorn SV, Rodgers A, Lopez AD, Mathers CD, et al. (2003) Estimates of global and regional potential health gains from reducing multiple major risk factors. Lancet 362: 271–280.
26. Olaiz Ferna´ndez G, Rivera Dommarco JA, Shamah Levy T, Rojas R, Villalpando Herna´ndez S, et al. (2006) Encuesta nacional de salud y nutricio´n 2006. Cuernavaca, Mexico: Instituto Nacional de Salud Pu´blica. 27. Yusuf S, Hawken S, Ounpuu S, Dans T, Avezum A, et al. (2004) Effect of
potentially modifiable risk factors associated with myocardial infarction in 52 countries (the INTERHEART study): case-control study. Lancet 364: 937–952.
28. Oficina de la Presidencia (2005) Quinto informe de gobierno del c. presidente constitucional de los Estados Unidos Mexicanos. Me´xico, D.F.: Presidencia de la Repu´blica. 420 p.
29. Ndong I, Gloyd S, Gale J (1994) An evaluation of vital registers as sources of data for infant mortality rates in Cameroon. Int J Epidemiol 23: 536–539. 30. Al-Rabee K, Alkafajei A (2006) Evaluation of child deaths registration in a
Jordanian community. East Mediterr Health J 12: 23–34.
31. Tome P, Reyes H, Pina C, Rodriguez L, Gutierrez G (1997) [Characteristics associated with under-registration of children’s deaths in the state of Guerrero, Mexico]. Salud Publica de Mexico 39: 523–529.
32. Peden M, Scurfield R, Sleet D, Mohan D, Hyder AA, et al., editors (2004) World report on road traffic injury prevention. Geneva: World Health Organization. 203 p.
33. Danaei G, Lawes CMM, vander Hoorn S, Murray CJL, Ezzati M (2006) Global and regional mortality from ischaemic heart disease and stroke attributable to higher-than-optimum blood glucose concentration: com-parative risk assessment. Lancet 368: 1651–1659.
34. Ezzati M, Vander Hoorn S, Lawes CM, Leach R, James WP, et al. (2005) Rethinking the ‘‘diseases of affluence’’ paradigm: global patterns of nutritional risks in relation to economic development. PLoS Medicine 2: e133. doi:10.1371/journal.pmed.0020133
35. Posadas-Romero C, Tapia-Conyer R, Lerman-Garber I, Zamora-Gonzalez J, Cardoso-Saldana G, et al. (1995) Cholesterol levels and prevalence of hypercholesterolemia in a Mexican adult population. Atherosclerosis 118: 275–284.
36. Barquera S, Flores M, Olaiz-Ferna´ndez G, Monterrubio E, Villalpando S, et al. (2007) Dyslipidemias and obesity in Mexico. Salu´d Publica de Me´xico 49: S338–S347.
37. Instituto Nacional de Estadı´stica Geografı´a e Informa´tica (2004) Encuesta nacional de adicciones 2002. Aguascalientes (Me´xico): Instituto Nacional de Estadı´stica Geografı´a e Informa´tica. 149 p.
38. American Cancer Society (2003) Tobacco control country profiles.Shafey O, Dolwick S, Guindon G editors. Atlanta (Georgia): American Cancer Society.
39. Rivera JA, Barquera S, Campirano F, Campos I, Safdie M, et al. (2002) Epidemiological and nutritional transition in Mexico: rapid increase of non-communicable chronic diseases and obesity. Public Health Nutr 5: 113–122.
40. Ezzati M, Martin H, Skjold S, Vander Hoorn S, Murray CJ (2006) Trends in national and state-level obesity in the USA after correction for self-report bias: analysis of health surveys. J R Soc Med 99: 250–257.
41. Ezzati M, Oza S, Danaei G, Murray CJ (2008) Trends and cardiovascular mortality effects of state-level blood pressure and uncontrolled hyper-tension in the United States. Circulation 117: 905–914.
42. Willett W, Stampfer MJ (1986) Total energy intake: implications for epidemiologic analysis. Am J Epidemiol 124: 17–27.
43. Harvard University, Secretarı´a de Salud, Instituto Nacional de Salud Pu´blica (2006) Evaluation of the system for social protection in health. Cambridge (Massachusetts): Harvard University.
44. Rehm J, Room R, Monteiro M, Gmel G, Graham K, et al. (2004) Alcohol use. In: Ezzati M, Lopez AD, Rodgers A, Murray CJL, editors. Comparative quantification of health risks. Geneva: World Health Organization. pp. 959–1108.
45. Szucs S, Sarvary A, McKee M, Adany R (2005) Could the high level of cirrhosis in central and eastern Europe be due partly to the quality of alcohol consumed? An exploratory investigation. Addiction 100: 536–542. 46. Kerr WC, Fillmore KM, Marvy P (2000) Beverage-specific alcohol consumption and cirrhosis mortality in a group of English-speaking beer-drinking countries. Addiction 95: 339–346.
47. Narro-Robles J, Gutierrez-Avila JH, Lopez-Cervantes M, Borges G, Rosovsky H (1992) [Liver cirrhosis mortality in Mexico. II. Excess mortality and pulque consumption]. Salud Publica de Mexico 34: 388–405.
48. Narro-Robles J, Gutierrez-Avila JH (1997) [Ecological correlation between consumption of alcoholic beverages and liver cirrhosis mortality in Mexico]. Salud Publica de Mexico 39: 217–220.
49. Silveira TR, da Fonseca JC, Rivera L, Fay OH, Tapia R, et al. (1999) Hepatitis B seroprevalence in Latin America. Rev Panam Salud Publica 6: 378–383.
50. Valdespino J, Conde-Gonzalez C, Olaiz-Fernandez G, Palma O, Kersheno-bich D, et al. (2007) [Seroprevalence of hepatitis C among Mexican adults: an emerging public health problem?]. Salud Publica de Mexico 49: S395– S403.
51. James O (2002) Non-alcoholic steatohepatitis. Medicine 30: 62.
52. Mathers CD, Loncar D (2006) Projections of global mortality and burden of disease from 2002 to 2030. PLoS Medicine 3: e442. doi:10.1371/journal. pmed.0030442
Editors’ Summary
Background.The impact that a particular disease has upon a population is known as the ‘‘burden of disease.’’ This burden is estimated by considering how many deaths the disease causes and how much it disables those still living. The relative contributions of different diseases and injuries to the loss of healthy life from death and disability vary greatly among countries. Broadly speaking, in low-income countries (such as many African countries), infectious diseases and undernutrition are the major causes of ill health and death whereas in high-income countries (for example, the United States), noncommunicable diseases such as heart disease, diabetes, and stroke are more important. As poor countries become richer, they experience a change in the pattern of disease away from infectious diseases and malnutrition and toward noncommunicable diseases. Health experts call this change the
‘‘epidemiological transition’’(epidemiology is the study of the distribu-tion and causes of diseases in populadistribu-tions). Governments need to know as much as possible about which diseases have the greatest burden— and about where the country is in the epidemiological transition—to help them implement effective health policies. For example, there is no point in setting up treatment centers for a specific infectious disease in a country where the disease no longer occurs. Equally importantly, governments need to know which lifestyle choices and other genetic and environmental factors affect the chances of people in their country developing specific diseases so that they can provide relevant educa-tional and intervention programs.
Why Was This Study Done?Most analyses of the burden of disease have been done at the national and global scale. However, in middle-income countries, different regions of the country may be at different stages of the epidemiological transition and may, therefore, have very different patterns of disease. In this study, the researchers investigate whether this is the case for Mexico, a middle-income country that has developed rapidly over the past few decades. Mexico recently reformed its health system to improve access to health care for the poor and underserved. Under this new system, individual states play an important role in allocating health-care resources (as they do in many other countries) so it is very important to know how the burden of disease varies in different states of the country.
What Did the Researchers Do and Find?The researchers estimated deaths and loss of healthy life years caused by various diseases and injuries for Mexico and its states using data from death registers, censuses, health examination surveys, and epidemiological studies. Loss of healthy life years was measured using a metric called‘‘ disability-adjusted life years’’(DALYs)—one DALY is equivalent to the loss of one year of healthy life because of premature death or disability. They also identified the major risk factors for these diseases and injuries across the country. Nationally, noncommunicable diseases (particularly heart disease, diabetes, stroke, and liver cirrhosis) caused 75% of deaths and 68% of DALYs. Undernutrition, infectious diseases, and problems
occurring in mothers and infants around the time of birth (maternal and perinatal diseases) caused 14% of deaths and 18% of DALYs. The leading risk factors for disease in Mexico were being overweight, having high blood glucose, and alcohol use. When the researchers studied different regions of the country, they found that Mexico City had the lowest death rate whereas the relatively undeveloped Southern region of Mexico had the highest, particularly among young children. In Chiapas, the most southerly state of Mexico, undernutrition and infectious, maternal, and perinatal diseases caused nearly a third of DALYs. In addition to the highest infectious disease burden, the Southern region also had the highest noncommunicable disease and injury burden per head of population.
What Do These Findings Mean?These findings indicate that Mexico as a nation is at an advanced stage of the epidemiological transition. In other words, because of the improvement in its economic status, the burden of disease caused by infectious diseases and undernutrition has decreased, and noncommunicable diseases now cause the largest share of the total burden of disease. However, the study also shows that the poorest regions of the country, which have the highest overall burden of disease, are lagging behind the richer regions in terms of their position in the epidemiological transition. Thus different health priorities need to be set in different regions of Mexico (and in other middle-income countries where the burden of disease is also likely to vary with region). Finally, the information provided by this study about the forces driving the epidemiological transition in Mexico, such as the importance of obesity and alcohol use, should help public-health officials decide how to improve the overall health of the Mexican population.
Additional Information.Please access these Web sites via the online version of this summary at http://dx.doi.org/10.1371/journal.pmed. 0050125.
A relatedPLoS MedicinePerspective by Martin Tobias further discusses
this research
The World Health Organization provides information on the Global
Burden of Disease Project including links to other burden of disease resources. It also provides detailed information on various aspects of health in Mexico (in several languages), and an explanation of DALYs
Read a detailed article on the‘‘epidemiological transition’’by Abdel
Omran, who proposed this idea in 1971
A large amount of Mexican data is available online for Spanish