Dyslipidemia in Schoolchildren from Private Schools in Belém
Simone Augusta Ribas e Luiz Carlos Santana da Silva
Departamento de Fisiologia da Universidade Federal do Pará, Belém, PA - Brazil
Summary
Background: Currently, childhood dyslipidemia, associated to other non-transmissible diseases such as diabetes, hypertension and obesity, represent a significant public health problem in Brazil.
Objective: To investigate the prevalence of dyslipidemia in children and adolescents from private schools in the city of Belem, state of Para, Brazil.
Methods: Transversal and prospective study that assessed 437 schoolchildren, paired by sex. The age range was established between 6 and 19 years of age and stratified in four subgroups (6 to 9 years; 10 to 12 years; 13 to 15 years and 16 to 19 years). To obtain the anthropometric variables, weight and height were measured for the calculation of the body mass index and skin folds were measured for the calculation of body fat percentage. The serum lipoprotein profile was obtained through the measurement of total cholesterol, triglycerides, LDL-cholesterol and HDL-cholesterol after a 12-hour fasting period, by enzymatic methods.
Results: Of the total number of schoolchildren analyzed, 126 (28.8%) were overweight and 158 (36.2%) presented a high adiposity index. The children (33.6%) presented a higher prevalence of obesity when compared to the adolescents (10.1%; p < 0.001). Regarding the biochemical characteristics, it was observed that 214 (41%) presented some alteration in the lipid profile and that children and adolescents in the age range of 10 to 15 years were the age groups that presented the highest rates of dyslipidemia (34.6% and 25.5%), respectively.
Conclusion: These findings demonstrate the importance of establishing an early diagnosis of the lipid profile, mainly if it is already associated to another risk factor, such as obesity. (Arq Bras Cardiol 2009; 92(6) : 412-417)
Key words: Dyslipidemias; students; adolescent; public health; cardiovascular diseases; Belém (PA)-Brazil.
Mailing address:: Simone Augusta Ribas •
Divisão de Nutrição do Hospital Universitário Pedro Ernesto, Av. 28 de setembro, 77 - Vila Isabel - Rio de Janeiro, RJ - Brazil
E-mail: [email protected]
Manuscript received February 25, 2008; revised manuscript received June 06, 2008; accepted October 06, 2008.
Introduction
The cardiovascular diseases (CVD) represent the main cause of death in industrialized countries, with coronary atherosclerosis being the most frequently manifested in the early stages of adolescence1. In the last 40 years, a great deal
of epidemiological evidence conclusively demonstrated that the hypercholesterolemia, especially the increase in serum levels of LDL-cholesterol (LDL-C), is a direct predictor of aortic disease and thus, it is the main target of intervention, according to the directives of the National Cholesterol Education Program (NCEP)2,3.
Recent data have shown that approximately 17% of the
North-Americans present cholesterol levels ≥ 240 mg/dl and
point out that hypercholesterolemia is the most important risk factor for the development of heart diseases4. In Brazil, the
dyslipidemias, when associated to other non-transmissible diseases such as diabetes, hypertension and obesity, also
currently represent a significant public health problem, in addition to being the main cause of healthcare costs by the Sistema Unico de Saude - SUS (Brazilian Public Health System)5. In the north region of the country, more specifically
in the city of Belém, state of Pará, Brazil, the CVD were responsible for 26% of the deaths in 2004 and 4% of these deaths were individuals younger than 20 years6.
This subject becomes a concern when one learns that the prevalence of dyslipidemia and obesity has been increasing in the last decade due to the lack of the regular practice of physical exercises, a diet high in saturated fats and poor in fibers7. According to the data from the Family Budget
Research (FBR) of 2002-2003, the North region presented a higher consumption of beef, cereals, roots, tubercles and oilseeds and a lower consumption of fruit, vegetables, legumes and derivatives, when compared to other regions of the country8.
Although several studies have demonstrated that the genesis of atherosclerosis can start in schildhood9-12, there is
Methods
Children and adolescents of both sexes that studied in private Elementary, Junior High and High Schools in the city of Belém, state of Pará, Brazil, were enrolled in this transversal, descriptive and prospective study. Age range was defined between 6 and 19 years and was stratified in four subgroups (6 to 9 years; 10 to 12 years; 13 to 15 years and 16 to 19 years).
The exclusion criterion was based on the pre-existence of cardiac or metabolic pathologies associated to dyslipidemia (familial hypercholesterolemia) and obesity (congenital leptin deficiency, Down’s syndrome, Prader-Willi syndrome) or any endocrine disorder (hyperthyroidism, Cushing’s syndrome).
Pregnant adolescents and patients undergoing treatment with hypolipemiant drugs were also excluded from the study. All these data were obtained by means of a questionnaire, which was previously sent to the selected institution and distributed among the parents or tutors of the children and adolescents that participated in this study. The schools were chosen at random, by drawing lots without replacement and in a stratified form, per administrative region of the city in places that had enough schools for the technique to be used, totaling 14 schools (12%) of the 78 registered in the year 2004 at the Instituto Nacional de Estudos e Pesquisas Educacionais Anísio Teixeira, an organ of the Ministry of Education.
The number of schools and students per institution was obtained through the School Census of 2004, supplied by the Secretary of Education of the State of Pará, which established a total number of 43,060 enrollments in private Grade, Junior High and High Schools. The random selection of 437 schoolchildren and adolescents was aided by the schools’ principals, who provided the groups that could meet the age and sex stratification criterion that was required by the study, preventing the formation of subgroups with a sample size < 50 individuals for statistical analysis.
The sample size calculation took into account the prevalence among the variables chosen for the study of 13% for dyslipidemia13, 95% confidence level and 3% error. After
the study was approved by the Ethics Committee in Research of Hospital Universitario Barros Barreto and the Secretary of Education (SEDUC) of the State of Pará and after the parents or tutors of the children and adolescents signed the Free and Informed Consent Form, the data was collected from May to November, 2005. The questionnaire that consisted of personal, clinical and socioeconomic data of the interviewee, was sent to the parents together with a document that included the Free and Informed Consent Form to be filled out at home and only those individuals who returned the filled out questionnaire and Free and Informed Consent Form signed by a parent or tutor participated in the study.
Anthropometric data
The following data were obtained for recording: weight (Kg), height (cm), tricipital skin-fold (TSF) and scapular skin-fold (SSF) (mm) thickness and arm perimeter (cm) measurements. The measurement of the body mass was carried out in a Plenna digital scale with a capacity of
150 kg, with a 50-g precision. The scale was set on a level surface; the examiner was standing opposite to scale, whereas the individual undergoing evaluation, barefoot, wearing light clothes and on a 12-hour fast, stepped on the platform, with the back turned to the scale, with both feet in the center of the platform. The measurements were carried out in duplicate and the means of the obtained values were used, with the objective of minimizing possible measurement errors. Height was measured with the help of a 1.5-m inextensible measuring tape, which was affixed perpendicularly to a level wall, at 1 meter from the floor without a baseboard, in the schoolyard, where the scale was also set and where the measurements of the skin folds and perimeters were also obtained. For the measurement of mass and height, the protocol of Marins and Giannichi was followed14.
Students younger than 10 years were denominated children and students older than 10 years of age were denominated adolescents, for the classification of the nutritional status, according to the criteria of the Ministry of Health15. The
Body Mass Index (BMI) for age of the participants followed the reference pattern of the growth charts of the National Center for Health Statistics(NCHS) in association with the National Center for Disease Prevention and Health Promotion16 (CDC), 2001. The adopted cutoffs followed the
WHO recommendations (1995). The obtained BMI values were interpreted as Z score values for the statistical analysis. The following cutoffs were adopted for the assessment of the nutritional status: underweight: below –1Z (<10th percentile);
eutrophy: between –1 and 1Z (between 10th and 84th
percentiles); overweight: between 1 and 2Z (between 85th
and 95th percentiles); obesity: > 2Z (>95th percentile) of the
reference median.
To determine the percentage of body and peripheral fat through the measurement of the skin folds (TSF and SSF) the protocol by França and Vívolo17 was followed. To calculate
the percentage of fat, we used the equation developed by Slaughter et al18. The body fat index was obtained taking into
account the classification proposed by Lohman19.
Lipid proile
The lipoprotein profile was determined after a 12-hour fast. A 10-ml blood sample was collected from the left antecubital vein using the specific test tubes for blood collection. The samples were processed and the serum was analyzed in a semi-automated equipment (SP 2000 UV Spectrophotometer). The analysis was carried out at the Laboratory of Clinical Analysis (LCA) located in the Biological Science Institute of the Federal University of Para – UFPA. The total blood cholesterol, triglycerides and HDL-cholesterol were determined by enzymatic methods using the LABTEST reagents. The LDL-cholesterol was calculated using the equation by FRIEDWALDet al20 recommended by the American
Academy of Pediatrics21: LDL-cholesterol = total cholesterol
Statistical analysis
The continuous variables are presented as means and standard deviations, in percentages. The ANOVA test was used to compare the means, considered statistically significant if p < 0.05. The description of the variables was carried out with the EPI-INFO 6.04B and Microsoft Excel® 2002 software.
The associations between TC and the variables that were previously determined by a theoretical model, using the χ2 test with a level of significance (α) of 5%, were determined. The statistical tests were carried out using the SPSS® program,
v.13.0, Chicago, USA.
Results
Of the 437 children and adolescents that participated in the study, 25.2% were 6 to 9 years, 25.8% were 10 to 12 years, 26.2% were 13 to 15 years and 22.8% were 16 to 19 years of age. Regarding gender, the sample was uniformly divided: 219 were males and 218 were females.
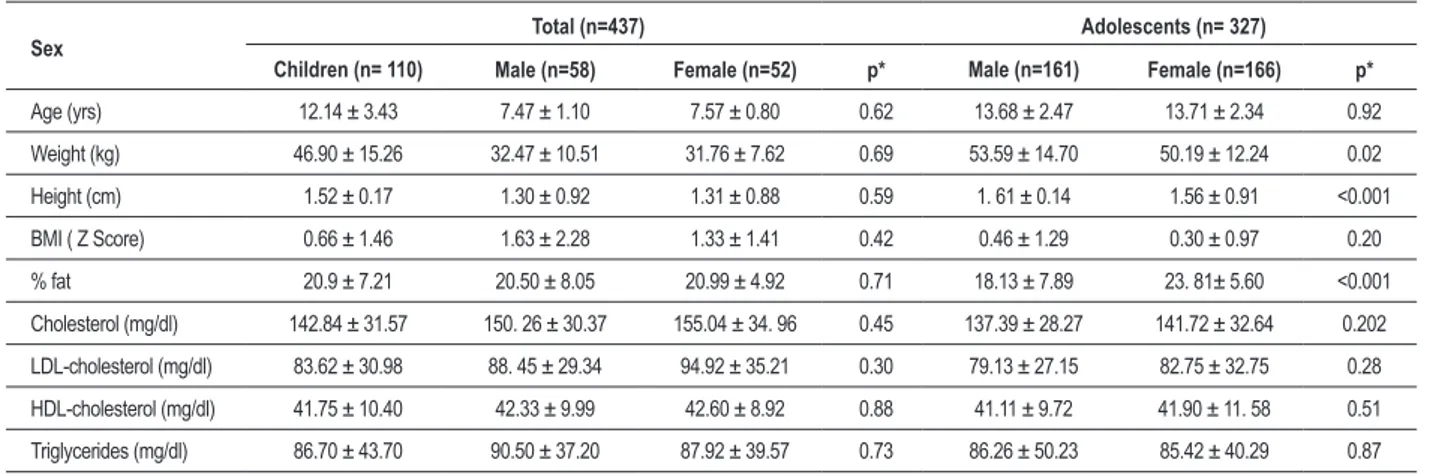
Regarding the anthropometric characteristics of the assessed students, although it was observed that a large number of the female students presented higher mean values when compared to the male students (Table 1), only the means of the fat percentage and height of the adolescents showed a significant difference between the sexes (p<0.001). The classification of the nutritional status showed that 126 (28.8%) were overweight and 158 (36.2%) presented a high fat percentage. As for the analysis by age group, the children (33.6%) presented a higher prevalence of obesity when compared to the adolescents (10.1%) (p< 0.001).
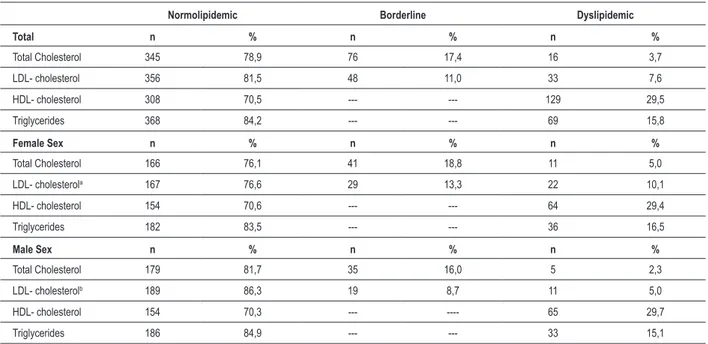
Regarding the biochemical characteristics, the mean values of the lipid profile, according to sex and age range, are shown in Table 1. As for the prevalence of dyslipidemic individuals, it was observed that the female students had a higher tendency to present an altered lipid profile, although the difference was only statistically significant in relation to the concentration of LDL lipoprotein (Table 2). It was verified that, of the total sample, 214 (49%) presented some alteration in the lipid profile. It was also observed that the HDL lipoprotein was the lipid component
Table 1- Anthropometric and biochemical characteristics of schoolchildren, Belém (PA), 2006
Sex Total (n=437) Adolescents (n= 327)
Children (n= 110) Male (n=58) Female (n=52) p* Male (n=161) Female (n=166) p*
Age (yrs) 12.14 ± 3.43 7.47 ± 1.10 7.57 ± 0.80 0.62 13.68 ± 2.47 13.71 ± 2.34 0.92
Weight (kg) 46.90 ± 15.26 32.47 ± 10.51 31.76 ± 7.62 0.69 53.59 ± 14.70 50.19 ± 12.24 0.02
Height (cm) 1.52 ± 0.17 1.30 ± 0.92 1.31 ± 0.88 0.59 1. 61 ± 0.14 1.56 ± 0.91 <0.001
BMI ( Z Score) 0.66 ± 1.46 1.63 ± 2.28 1.33 ± 1.41 0.42 0.46 ± 1.29 0.30 ± 0.97 0.20
% fat 20.9 ± 7.21 20.50 ± 8.05 20.99 ± 4.92 0.71 18.13 ± 7.89 23. 81± 5.60 <0.001
Cholesterol (mg/dl) 142.84 ± 31.57 150. 26 ± 30.37 155.04 ± 34. 96 0.45 137.39 ± 28.27 141.72 ± 32.64 0.202
LDL-cholesterol (mg/dl) 83.62 ± 30.98 88. 45 ± 29.34 94.92 ± 35.21 0.30 79.13 ± 27.15 82.75 ± 32.75 0.28
HDL-cholesterol (mg/dl) 41.75 ± 10.40 42.33 ± 9.99 42.60 ± 8.92 0.88 41.11 ± 9.72 41.90 ± 11. 58 0.51
Triglycerides (mg/dl) 86.70 ± 43.70 90.50 ± 37.20 87.92 ± 39.57 0.73 86.26 ± 50.23 85.42 ± 40.29 0.87
BMI – Body Mass Index; LDL – low-density lipoprotein and HDL –high-density lipoprotein; * ANOVA Test.
that presented the highest percentage values of alteration, regardless of sex (Table 2). As for the age range, it was verified that the percentage of dyslipidemic students decreased with age, demonstrating in percentage data that children (< 10 years) were more predisposed to the development of dyslipidemia than the adolescents (> 10 years) (Chart 1).
Discussion
In the last years, an important increase in the degree of school attendance for Grade and Junior High School has been observed, reaching approximately 97.2% of the Brazilian population. Thus, the school environment has become a privileged, feasible and appropriate setting from which to obtain local representative information on health and nutrition, which were, to date, little available for children older than 5 years and adolescents. The present study represents an important contribution of data for the Northern region of Brazil, mainly due to the scarcity in the literature of studies that investigated the lipid profile in this region of the country.
Regarding the mean values obtained from the lipid profile of the evaluated students (TC-142.8 mg/dl, LDL-83.6 mg/dl, HDL - 41.8 mg/dl and TG - 86.7mg/dl), these are below the ones presented in other studies carried out in Brazil23-26, except
the ones presented by Grilo et al9 and Romaldini et al12, in
which TG showed lower mean values when compared to the present study.
The percentages of the serum levels of TC > 170 mg/dl and LDL-C > 130 mg/dl observed in the study – 21.1% and 18.6%, respectively – were higher than those observed 6 years ago in this same region, when, of the 650 studied adolescents, 71 (10.9%) presented cholesterol levels > 170 mg/dl and 579 (89.1%), presented levels below this reference value13. The significant percentage of observed dyslipidemia
(48.5%) was higher than the prevalence of 38.4%, found by another study carried out with children and adolescents that already presented a family history of premature coronary artery disease12.
Table 2- Prevalence of the lipid proile of schoolchildren, according to gender, Belem, 2006
Normolipidemic Borderline Dyslipidemic
Total n % n % n %
Total Cholesterol 345 78,9 76 17,4 16 3,7
LDL- cholesterol 356 81,5 48 11,0 33 7,6
HDL- cholesterol 308 70,5 --- --- 129 29,5
Triglycerides 368 84,2 --- --- 69 15,8
Female Sex n % n % n %
Total Cholesterol 166 76,1 41 18,8 11 5,0
LDL- cholesterola 167 76,6 29 13,3 22 10,1
HDL- cholesterol 154 70,6 --- --- 64 29,4
Triglycerides 182 83,5 --- --- 36 16,5
Male Sex n % n % n %
Total Cholesterol 179 81,7 35 16,0 5 2,3
LDL- cholesterolb 189 86,3 19 8,7 11 5,0
HDL- cholesterol 154 70,3 --- ---- 65 29,7
Triglycerides 186 84,9 --- --- 33 15,1
Chi-square Test -axb: p= 0.029.
factor against cardiovascular diseases, was the lipid component that presented the highest percentage of alteration of the lipid profile, although the means of the serum levels of HDL found in the present study were lower than those found in other studies10-11.
Brotons et al27 reported that the serum levels of lipids and
lipoproteins undergo important variations during childhood and adolescence, and that, on average, girls present higher levels of TC, HDL-C and LDL-C when compared to the boys, with the menarche being the triggering factor of this phenomenon in adolescence. However, other epidemiological studies on the distribution of lipids in children and adolescents showed that elevated levels of lipoproteins and lipids in the female gender do not depend on age or ethnicity28-29. In the present study, although the
lipid profile showed a tendency among the girls to present higher mean values of the lipid profile when compared to the boys, this difference was not significant.
As for the age range, the results showed that the number of dyslipidemic students decreased with age. The fact that the present study included students from a wide age range (6 to 19 years) allowed the identification of which age range or ranges could be more prone to present dyslipidemia, attenuating the finding of results that did not reflect the reality of the region. The results showed that the children and the adolescents aged 10 to 15 years are age ranges that deserve to be thoroughly studied regarding the investigation of other risk factors, considering that these groups presented higher levels of dyslipidemia (34.6% and 25.5%, respectively).
There are few comparative studies in the literature on the lipid profile stratified by age range; most of them are limited to only one age range. However, in the study by Giuliano et al11, it was also demonstrated that most means of the lipid
profile components (TC, HDL and TG), presented by the schoolchildren in the city of Florianopolis, decreased with age and that the schoolchildren aged 7 to 10 years were the ones that presented the highest means of lipidemic levels.
Some studies and the III Brazilian Directives of Dyslipidemia and Atherosclerosis Prevention25 report the
correlation between elevated blood cholesterol and the incidence of cardiovascular diseases, demonstrating that the risk increases when the cholesterol is higher than 200 mg/100 ml. However, from December 2005 on, the Brazilian Society of Cardiology, through the I Directive of Atherosclerosis Prevention in Childhood and Adolescence, already recommended dietary counseling with cholesterol levels of 150 mg/100 ml of blood and routine supervision with cholesterol levels of 170 mg/100 ml of blood for the prevention of cardiovascular diseases22.
Another important factor to be considered is that the schoolchildren that presented a higher percentage of alteration in the lipid profile were also the ones that presented BMI > 85th percentile, as well as elevated fat index. The children
were the main target for cardiovascular disease risk factors and were also the age range that presented the highest percentages of weight alteration and lipid profile in comparison to the schoolchildren older than 10 years.
This series also showed that the prevalence of overweight decreased with age (Table 1). This is an expected phenomenon, as it is known that, in children, a moderate excess weight can be compensated by the future growth. Another factor that must be considered is the fact that, currently, the adolescents are progressively concerned with being physically fit, leading to an increasing number of individuals in this age range that spontaneously practice physical activities26.
Chart 1 - Percentage distribution of schoolchildren with undesirable lipid levels according to age range; TC - total cholesterol >170 mg/dl; LDL (low-density lipoprotein)
> 110mg/dl ; TG - triglycerides >100 mg/dl (<10 years) and <130 mg/dl (>10 years) and HDL ( high-density lipoprotein) ≥ 40 mg/dl (<10 years) and ≥ 35 mg/dl (>10 years). Age range: 6 to 20 years.
Age range
TG HDL-C
LDL-C TC
weight during the childhood and adolescence, as obesity, in addition to being an independent risk factor for the development of atherosclerosis, might be associated to a series of other risk factors, such as arterial hypertension, type-2 diabetes mellitus and dyslipidemia.
The association between body mass and dyslipidemia has multiple metabolic causes: insulin resistance, hyperinsulinemia, hyperglycemia and increase in the cholesterol-ester transporting protein secreted by the adipocytes, among others31. Both weight control and localized fat control seem
to be an effective measure in the control of dyslipidemia, with the decrease in LDL-C and increase in HDL-C levels, mainly in girls32.
In conclusion, one can affirm that it is necessary to start the prevention of the atherosclerotic disease during childhood and that the healthcare team must be aware, in order to identify its risk factors and establish the necessary intervention, so that prevention programs can be implemented, which must include the stimulus to have adequate dietary habits and a healthy lifestyle.
Acknowledgements
To CNPq (Conselho Nacional de Pesquisas), together with the Ministry of Health, for the financial support of this project, protocol: Edital CT-Saúde/MCT/MS/CNPq, #030/2004; to the principals of the schools and the children who participated in this investigation.
Potential Conflict of Interest
No potential conflict of interest relevant to this article was reported.
Sources of Funding
This study was funded by CNPq and Ministério da Saúde.
Study Association
This article is part of the thesis of master submitted by Simone Augusta Ribas, from Universidade Federal do Pará.
References
1. Bao W, Srinivasan SR, Valdez R, Greenlund KJ, Wattigney WA, Berenson GS. Longitudinal changes in cardiovascular risk from childhood to young adulthood in offspring of parents with coronary heart disease. The Bogalusa Heart Study. JAMA. 1997; 278: 1749-54.
2. National Cholesterol Education Program. Expert panel on blood cholesterol levels in children and adolescents. Pediatrics. 1992; 89 (3 Suppl): 525-84. 3. National Cholesterol Education Program (NCEP). Expert Panel on Detection,
Evaluation, and Treatment of High Blood Cholesterol in Adults. Summary of the Third Report (Adult Treatment Panel III). JAMA. 2001; 269: 3015-23. 4. National Center for Health Statistics. Health, United States, 2005, with
Chartbook on the Health of Americans.Hyattsville, Maryland: 2004. [Accessed 2007 Dec 10]. Available from: htpp://www.cdc.gov/nchs/hus. htm.
5. Buss PM. Assistência hospitalar no Brasil (1984-1991): uma análise preliminar baseada no Sistema de Informação Hospitalar do SUS. Inf Epidemiol SUS. 1993; 2: 5-44.
6. Brasil. Ministério da Saúde. Caderno de Informações de Saúde – Mortalidade. Belém, PA, 2004.
8. Instituto Brasileiro de Geografia e Estatística. Análise da disponibilidade domiciliar de alimentos e do estado nutricional no Brasil: pesquisa de orçamentos familiares 2002-2003. Rio de Janeiro; 2004.
9. Grillo LP, Crispim SP, Siebert AN, Andrade ATW, Rossi A, Campos IC. Perfil lipídico e obesidade em escolares de baixa renda. Rev Bras Epidemiol. 2005; 8 (supl 1): 75-81.
10. Gerber ZRS, Zielinsky P. Fatores de risco de aterosclerose na infância: um estudo epidemiológico. Arq Bras Cardiol. 1997; 69: 231-6.
11. Giuliano ICB, Coutinho MSSA, de Freitas SFT, Pires MMS, Zunino JN, Ribeiro RQC. Lípides séricos em crianças e adolescentes de Florianópolis, SC: estudo Floripa saudável 2040. Arq Bras Cardiol. 2005; 85 (2): 85-91.
12. Romaldini CC, Issler H, Cardoso AL, Diament J, Forti N. Risk factors for atherosclerosis in children and adolescents with family history of premature coronary artery disease. J Pediatr. 2004; 80 (2): 135-40.
13. Rego SS. Prevalência de hipercolesterolemia em adolescentes [dissertação]. São Paulo: Universidade Federal de São Paulo; 1999.
14. Marins JCB, Giannichi RS. Avaliação e prescrição da atividade física. Rio de Janeiro: Shape; 1996.
15. Brasil. Ministério da Saúde. Vigilância alimentar e nutricional-SISVAN: orientações básicas para coleta, processamento, análise de dados e informações em serviços de saúde. Brasília; 2004.
16. CDC table for calculated body mass index values for selected heights and weights for ages 2 to 20 years. Developed by the National Center for Health Statistics in collaboration with the National Center for Chronic Disease Prevention and Health Promotion; 2000. Publicado em maio de 2002, modificado 20/04/2001. [Accessed 2006 Feb 10]. Available from http://www. cdc.gov/growthcharts.
17. França NM, Vivolo MA. Avaliação antropométrica. In: Matsudo, VRK. (ed). Testes em ciências do esporte. São Paulo: Burti; 1998. p. 9-31.
18. Slaughter MH, Lohman TG, Boileau RA, Horswill CA, Stillman RJ, Van Loan MD, et al. Skinfold equations for estimation of body fatness in children and youth. Hum Biol. 1988; 60: 709-23.
19. Lohman TG. Exercise training and body composition in childhood. Can J Sport Sci. 1992; 17: 284-7.
20. Friedewald WT, Levy RI, Fredrickson DS. Estimation of the low density lipoprotein in plasma without use of the preparative ultracentrifuge. Clin
Chem. 1972; 18: 499-502.
21. American Academy of Pediatrics. National Cholesterol Education Program: Report of the Expert Panel on blood cholesterol levels in children and adolescents. Pediatrics. 1992; 89: 525-84.
22. Sociedade Brasileira de Cardiologia. I Diretriz de prevenção da aterosclerose na infância e na adolescência. Arq Bras Cardiol. 2005; 85 (supl 6): 3-36. 23. Moura EC, Castro CM, Mellin AS, Figueiredo DB. Perfil lipídico em escolares
de Campinas (SP), Brasil. Rev Saúde Pública. 2000; 34: 499-505. 24. Sichieri R, Veiga GV, Teixeira MH. Consumo de gordura e hipercolesterolemia
em uma amostra probabilística de estudantes de Niterói (RJ). Arq Bras Endocrinol Metab. 2007; 51 (supl 1): 65-71.
25. Sociedade Brasileira de Cardiologia. III Diretrizes brasileiras de dislipidemias e Diretriz de prevenção da aterosclerose. Arq Bras Cardiol. 2001; 67 (supl. 3): 1-48.
26. Maldonado GR. A educação física e o adolescente: a imagem corporal e a estética da transformação na mídia impressa. Revista Mackenzie de Educação Física e Esporte. 2006; 5 (supl 1): 59-76.
27. Brotons C, Ribera A, Perich RM, Abrodos D, Magana P, Pablo S, et al. Worldwide distribution of blood lipids and lipoproteins in childhood and adolescence: a review study. Atherosclerosis. 1998; 139: 1-9.
28. Morrison JA, James FW, Sprecher DL, Khoury PR, Daniels SR. Sex and race differences in cardiovascular disease risk factor changes in schoolchildren,1975-1990: the Princeton School Study. Am J Public Health. 1999; 89: 1708-14.
29. Pietro Albino L, Arroyo Diez J, Vadillo Machota JM, Mateos Montero C, Galán Rebollo A. Prevalência de hiperlipidemia en ninõs y adolescente de la Provincia de Carceres. Rev Esp Salud Publica. 1998; 72: 343-55. 30. Lobstein T, Baur L, Uauy R, IASO International obesity Task Force. Obesity
in children and young people: a crisis in public health. Obes Rev. 2004; 5 (Suppl 1): 4-104.
31. Asayama K, Hayashibe H, Dobashi K, Uchida N, Nakane T, Kodera K, et al. Increased serum cholesteryl ester transfer protein in obese children. Obes Res. 2002; 10: 439-46.