with the Same Monoclonal Antibodies
Dian-Bing Wang1,2, Ruifu Yang4, Zhi-Ping Zhang1, Li-Jun Bi3, Xiang-Yu You1, Hong-Ping Wei1, Ya-Feng Zhou1, Ziniu Yu2, Xian-En Zhang1*
1State Key Laboratory of Virology, Wuhan Institute of Virology, Chinese Academy of Sciences, Wuhan, China,2State Key Laboratory of Agromicrobiology, College of Life Science and Technology, Huazhong Agricultural University, Wuhan, China,3State Key Laboratory of Macromolecules, Institute of Biophysics, Chinese Academy of Sciences, Beijing, China,4State Key Laboratory of Pathogen and Biosecurity, Institute of Microbiology and Epidemiology, Academy of Military Medical Sciences, Beijing, China
Abstract
Bacillus anthracis, the causative agent of anthrax disease, could be used as a biothreat reagent. It is vital to develop a rapid, convenient method to detectB. anthracis. In the current study, three high affinity and specificity monoclonal antibodies (mAbs, designated 8G3, 10C6 and 12F6) have been obtained using fully washedB. anthracisspores as an immunogen. These mAbs, confirmed to direct against EA1 protein, can recognize the surface ofB. anthracisspores and intact vegetative cells with high affinity and species-specificity. EA1 has been well known as a major S-layer component of B. anthracis
vegetative cells, and it also persistently exists in the spore preparations and bind tightly to the spore surfaces even after rigorous washing. Therefore, these mAbs can be used to build a new and rapid immunoassay for detection of both life forms ofB. anthracis, either vegetative cells or spores.
Citation:Wang D-B, Yang R, Zhang Z-P, Bi L-J, You X-Y, et al. (2009) Detection ofB. anthracisSpores and Vegetative Cells with the Same Monoclonal Antibodies. PLoS ONE 4(11): e7810. doi:10.1371/journal.pone.0007810
Editor:Linqi Zhang, Tsinghua University, China
ReceivedJuly 24, 2009;AcceptedOctober 18, 2009;PublishedNovember 13, 2009
Copyright:ß2009 Wang et al. This is an open-access article distributed under the terms of the Creative Commons Attribution License, which permits unrestricted use, distribution, and reproduction in any medium, provided the original author and source are credited.
Funding:This work was supported by National Natural Science Foundation of China. The funders had no role in study design, data collection and analysis, decision to publish, or preparation of the manuscript.
Competing Interests:The authors have declared that no competing interests exist.
* E-mail: x.zhang@wh.iov.cn
Introduction
Bacillus anthracis, the causative agent of anthrax disease, is a Gram-positive spore-forming bacterium. Fully virulent bacilli carry two plasmids, pXO1 and pXO2, which contain genes to produce the lethal factor and edema factor toxins, and a poly-c -D-glutamic acid capsule, respectively [1,2]. In response to nutrient deprivation, B. anthracis will produce spores that can withstand harsh conditions, including temperature, radiation, chemical assault, time and even the vacuum of outer space [3]. These remarkable characteristics allow B. anthracis to be used as a biological threat agent.
Recent studies have indicated that B. anthracis is genetically similar to other members of theBacillus genus. The 16S rRNA, 23S rRNA and 16S–23S internal transcribed spacer sequences of B. anthracisshare a high degree of similarity with those inB. cereus, B. subtilis,B. megaterium,B. mycoides, andB. thuringiensis[4,5]. These sequence similarities make identification ofB. anthracischallenging, and substantial effort has been devoted to developing identification methods. The conventional method is the bacteriological assay, which is reliable but time consuming. Other advanced approaches have been proposed forB. anthracisdetection, including immuno-logical assays [6,7], PCR-based methods [8,9,10,11,12,13], molecular fingerprinting [14,15,16] and mass spectrometric (MS) analyses [17,18]. The detection targets have mainly focused on the pXO1 and pXO2, gene polymorphisms, specific gene sequences (Ba813,rpoB, bclA) and small acid soluble proteins (SASPs) in the spores. However, these methods fail to eliminate the need for
complicated protocols such as cell disruption, nucleic acid extraction and protein purification, and cannot support conve-nient, rapid and real-time detection of B. anthracis. Therefore, direct detection ofB. anthracisis attractive for on-site application. So far, several immunoreagents, directed against the surface ofB. anthracis, have been developed for the direct detection ofB. anthracis vegetative cells orB. anthracisspores [19,20,21,22,23].
Results
Atomic-force microscopy (AFM) analysis ofB. anthracis
spores
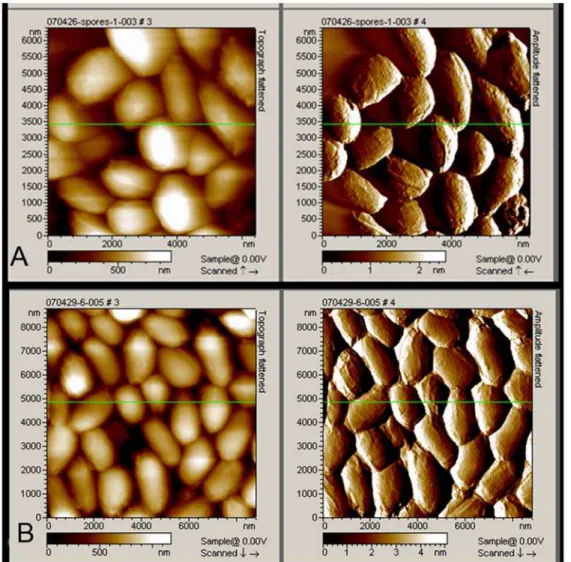
To guarantee the purity of spores that we prepared, both unwashed and fully washed spores were analysed by AFM. As is shown in Figure 1, a larger amount of free spores appeared. Even the unwashed spores were surprisingly clean, as no intact vegetative cells and little vegetative cell debris were present (Fig. 1A). However, because it is likely that some vegetative cell proteins will bind accidentally to the spore surface, the rigorous washing method, as described above, was still employed. There were few differences between the unwashed spores and fully washed spores, but the latter seemed to have a much smoother surface than the former, indicating that our spore purification protocol had removed some unknown material (Fig. 1B). There-fore, we used these fully washed B. anthracis spores as our immunogen and employed them in the subsequent experiments.
Preparation and screening of mAbs againstB. anthracis
spores
By the fusion protocol [29], approximately 600 hybridoma cultures were screened with the indirect ELISA method. Fifteen
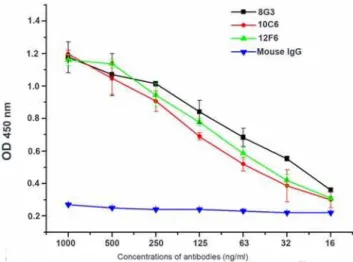
hybridomas produced high affinity antibodies and were cloned successfully. Following isotyping, five mAbs were IgMs, while the other 10 were IgGs (data not shown). These mAbs were then examined for their reactivity against a range ofBacillusspores using ELISAs. Three mAbs, designated 8G3 (IgG3), 10C6 (IgG1) and 12F6 (IgG1), specifically recognizedB. anthracisspores (Fig. 2A), and showed no cross-reaction with high concentrations ofB. cereus,B. subtilis, B. megaterium, B. mycoides and other Bacillus spores. Additionally, compared to the other mAbs, these three mAbs all had higher affinity againstB. anthracisspores. Even with a range of low concentrations, these mAbs, especially mAb 8G3, always showed strong signals when reacting against B. anthracis spores (Fig. 2B). Therefore, these three mAbs were examined further.
Antigen identification
Exosporium, the outermost structure of spores, was isolated fromB. anthracisA16 spores using mild sonication in order to avoid the loss of some exosporium proteins and the damage of the remaining spore protein denaturation. Using electron microscopy, it was observed that the exosporium fragments were successfully extracted (Fig. 3A), and there was no obvious disruption to the spores after sonication (Fig. 3B). The exosporium fragments were boiled in sample buffer for 30–40 min to release more soluble
Figure 1. Images captured by AFM analysis ofB. anthracisspores.Topography images (left) and amplitude images (right) of the spores were collected in tapping mode. A: Unwashed spores. B: Extensively washed spores.
doi:10.1371/journal.pone.0007810.g001
proteins. The soluble exosporium proteins were separated by SDS-PAGE, and the mAbs (8G3, 10C6 and 12F6) recognized a 91– 93 kDa protein by Western blotting (Fig. 4A). The band was excised and subjected to DE-MALDI-TOF-MS analysis; the protein was identified as EA1 (Fig. 4B). To determine whether the mAbs were all directed against EA1, the coding region of the gene for EA1 was cloned into the pQE-30 plasmid and expressed inE. coli M15, and the expressed proteins were purified with affinity chromatography. By the method reported previously [30], the affinity constants (Kaff) of the mAbs (8G3, 10C6 and 12F6) for the recombinant EA1 protein were measured to be 1 to 36109M21 Thus, the results not only established that EA1 was the target protein of the three mAbs, but also indicated that the mAbs had a high affinity for EA1.The reaction curves for the mAbs with 4mg ml21recombinant EA1 are shown in Figure 5.
The mAbs could also react withB. anthracisvegetative cells
Since EA1 is a major S-Layer protein inB. anthracisvegetative cells [24,31], the mAbs against EA1 were tested for their reactivity and specificity toB. anthracisvegetative cells. The sandwich ELISA method was employed, rather than indirect ELISA, because the intact vegetative cells were so large that were not adequately coated to the microwells in our indirect ELISA assays (data not shown).
As shown in Figure 6, the mAbs specifically recognized B. anthracis vegetative cells with no significant cross-reaction with other strains at high concentrations (107CFU/ml). Of these mAbs, 12F6 seemed the best candidate, because it reacted strongly with different kinds ofB. anthracis vegetative cells. However, the other mAbs, especially 8G3, did not strongly recognizeB. anthracis strains lacking the pXO1 or pXO2 plasmids. Therefore, these
Figure 2. The specificity and reactivity of mAbs withB. anthracisspores.A: Reaction of the mAbs with a series ofBacillusspores, as detected by indirect ELISA. B: Reactions of different concentrations of mAbs withB. anthracisspores by indirect ELISA. The experiment was repeated three times.
results indicated that the mAbs had different characteristics, despite having been raised against the same protein.
The mAbs bound to surfaces of bothB. anthracisspores and vegetative cells
Binding of mAbs (8G3, 10C6 and 12F6) to the surface of B. anthracis A16 spores and vegetative cells was investigated with immunofluorescence. Normal mouse IgG was used as a negative control (Figure S1), and photographs from the 8G3 experiments as examples are shown in Figure 7. In the immunofluorescence assays, the fully washed spores incubated with 8G3 were extensively stained with R-phycoerythrin-conjugated goat anti-mouse IgG (red). The vegetative cells were incubated with the mAb, and were visualized with FITC-conjugated goat anti-mouse IgG (green). The pattern of fluorescence indicated that these mAbs not only recognized the surfaces of spores, but also bound to the intact vegetative cells.
EA1 was persistently present inB. anthracisspore extracts
During preparation, the B. anthracis spores were washed extensively with water and pelleted through 20% and 50%
Renografin to remove vegetative cell debris [10]. The spores were monitored and collected at four stages of the standard washing procedure: unwashed spores from the culture plate (Preparation 1), spores washed with MilliQ water for 24 h, three times (Prepara-tion 2), Renografin purified spores (Prepara(Prepara-tion 3), and spores subjected to three additional washes (Preparation 4). In addition, the supernatants from sedimentation during Preparation 3 were diluted 1:10 with water and centrifuged at 10,0006g for 30 min to collect the debris. Equal volumes of all preparations and the debris were subjected to SDS-PAGE analysis.
As a result, theB. anthracisA16 SDS-PAGE profiles showed no obvious differences between Preparations 1 and 2, except that a negligible amount of protein was removed by the washing steps (Figure 8). The same results were observed when Preparations 3 and 4 were compared. In contrast, most proteins, including EA1, decreased after sedimentation through Renografin. These re-moved proteins were present in the ‘‘debris’’ of the supernatant, which contained a similar amount of protein to Preparations 2 and 4. These results suggest that the Renografin step washed out some of the EA1 along with many other spore proteins, which were then detected by SDS-PAGE. Despite the presence of EA1 in the debris, EA1 was also persistently present in theB. anthracis A16 spore extracts of each preparation. Furthermore,B. anthracisstrains lacking pXO1 or pXO2 produced similar results to those presented above (data not shown). Therefore, EA1 was persistently present inB. anthracisspore extracts.
Discussion
The primary goal of this study was to generate mAbs with high affinity and specificity that could be applied to rapid detection of B. anthracisspores. The mAbs were produced against formalde-hyde-inactivatedB. anthracisA16 spores and reacted with a range of liveBacillusspores, includingB. anthracis.Most of the mAbs we produced were highly specific for B. anthracis spores. For each screening of the hybridoma cultures, spores fromB. cereusandB. thuringiensis, the two closest relatives ofB. anthracis, were used as negative controls. To identify mAbs with high affinity and specificity, hybridomas were selected if the mAbs reacted strongly withB. anthracisbut did not recognize either negative antigen. As a result, the three mAbs (8G3, 10C6 and 12F6) we prepared have no cross reaction with manyB. thuringienesissubspecies andB. cereus isolates (Table S1).
The three mAbs recognized not only the surface ofB. anthracis spores but could also detect intact B. anthracis vegetative cells (Fig. 7). Furthermore, these mAbs were capable of reaction with liveB. anthracis as well as deadB. anthracis (inactivated by 1.5% formaldehyde), which is critical for the detection of biological warfare agents in unknown ‘‘white powders’’, since it has been suggested thatBacillusinactivation would affect antibody detection assays [32]. Although these three mAbs were directed toward the same target protein, EA1, they had different characteristics. The mAb 12F6 was superior at reacting with different kinds of B. anthracis vegetative cells, while 8G3 had a higher affinity for B. anthracis spores and the target protein EA1 (Fig. 2, Fig. 5 and Fig. 6). Besides this, in the epitope mapping, the epitopes of mAb 8G3 and 10C6 were concluded to be located from the amino acid 275 to 435 on the EA1 protein, and the epitope of mAb 12F6 was exactly located from the amino acid 465 to 554 (data not shown). We suggested that the different positions of the mAb epitopes caused the mAbs to exhibit different behavior the detection ofB. anthracis.
As to whether EA1, a major S-layer component ofB. anthracis vegetative cells, is also a spore protein, much research has indicated
Figure 3. Transmission electron micrographs. A: B. anthracis
exosporium fragments and theB. anthracisspores after sonication. B: Scale bars: 500 nm.
doi:10.1371/journal.pone.0007810.g003
that this protein is retained in the proteomic profiling of spores and salt/detergent washed exosporium [26,27]. However, Williams and Turnbough stated that this protein was merely a persistent contaminant in spore preparations [28]. Whichever is correct, it does not matter for the detection ofB. anthracisspores, because this protein does persistently exist in each of the spore preparations (Fig. 8), and theB. anthracisspores, even after full washing, can be detected with our anti-EA1 mAbs (Fig. 2 and Fig. 7).
Although EA1 could be partially washed out during the rigorous washing step in our study, the other proteins detected by SDS-PAGE also apparently decreased and were present as debris in the supernatant of centrifuged purified samples (Fig. 8). The
supernatant debris contained significant amounts of true spore proteins with similar protein profiles to fully washed spores. Therefore, rigorous washing methods, such as Renografin purification, can cause serious loss of spore surface associated proteins and are not suggested for proteomic analysis [26,27]. This suggests that EA1 is certainly at least a highly spore-associated protein: it might be a true spore protein, or may anchor onto particular spore surface components.
In conclusion, this study reports three mAbs (8G3, 10C6 and 12F6) that can bind toB. anthracisspores and intact vegetative cells with high species-specificity and affinity. It also indicates that EA1, the target protein of our mAbs, could serve as a potential detection
Figure 4. Identification of the mAbs’ target proteins.A: The protein profiles of the fully washedB. anthracisexosporium following SDS-PAGE (Lane 1) and immunoblotting with mAb 8G3 (Lane 2), 10C6 (Lane 3), 12F6 (Lane 4) and mouse IgG (Lane 5). B: Mass spectrometric analysis of the target protein, which was determined to be EA1.
target ofB. anthracis, establishing a new immunoassay protocol that realizes sensitive, rapid, on-site and simultaneous detection of both life forms ofB. anthracis.
Materials and Methods
Bacterial strains
The bacterial strains used in this study are listed in Table 1. All assays involving live B. anthracis spores and vegetative cells were carried out in a P3 biosafe laboratory. The experimenters were equipped with masks, gloves and exposure suits.
Preparation of spores
Spores were prepared by growing bacteria at 37uC on modified Difco sporulation medium (DSM) [33], containing 6 g tryptone, 3 g yeast extract, 10 g NaCl, 1 g KCl, 0.25 g Mg2SO4?7H2O, 0.23 g Ca(NO3)2, 0.197 g MnCl2?4H2O, 0.0002 g FeSO4, and
15 g agar per liter. When more than 95% free spores appeared, the spores were collected with cold, sterile, ultrapure water, centrifuged and washed extensively three times, before sedimen-tation through 20% and 50% Renografin (Bracco Sine, China) [10] and another three washes. The washed spores were then resuspended in sterile saline and stored at 4uC. The spores were quantified by serially diluting the spore stock, and plating 100ml
aliquots on Luria broth (LB) plates, in triplicate. The number of spores (CFU/ml) was counted following overnight culture at 37uC.
Atomic-force microscopy (AFM) analysis of spores An aqueous spore suspension of 10ml, containing 108–109 spores, was spread on a 1 cm61 cm silicon wafer and air-dried. The sample was not placed in the AFM chamber for imaging until the spores settled on the substrate. PicoscanTM 2500 AFM (Molecular Imaging, US) and commercial single MAClever type II cantilevers (Molecular Imaging, US) were used to obtain images in tapping mode.
Exosporium extraction
Approximately 0.5 g of purified B. anthracisspores (wet weight) were collected by centrifugation at 9,0006g for 5 min at 4uC and resuspended in 15 ml cold sterile TE buffer (50 mmol l21Tris-HCl, 0.5 mmol l21 EDTA, pH 7.2), containing 1ml ml21 protease
inhibitor cocktail (Sigma, US). All subsequent centrifugations were performed at 4uC. To extract larger exosporium fragments, the spore suspension was divided into three partitions and each was treated using a Vibra-Cell Ultrasonic Processor (Sonics & Materials, USA) with 120 pulse cycles on ice (5 s pulse - 9 s interval - 5 s pulse). The three partitions were sonicated, pooled and centrifuged for 45 min at 1,2006g. Then the pellet was washed five times with cold TE buffer and centrifuged as above. All the supernatant samples were saved and centrifuged at 184,0006g for 1 h. The sediments, which were composed of exosporium fragments, were then resuspended in 500ml sterile PBS for further study.
Production of monoclonal antibodies and polyclonal antibodies
Preparations containing 106spores ofB. anthracisstrain A16 and inactivated by 1.5% formaldehyde were injected subcutaneously
Figure 5. The reactivity of the mAbs with purified EA1 protein. Reactions of a range of concentrations of the mAbs with the 4mg/ml
EA1 protein using indirect ELISA. The experiment was repeated three times.
doi:10.1371/journal.pone.0007810.g005
Figure 6. The specificity and reactivity of the mAbs withB. anthracisvegetative cells.Reactions of the mAbs with a series of vegetative cells, as detected by sandwich ELISA.
doi:10.1371/journal.pone.0007810.g006
into six-week-old BALB/c mice. The immunization was repeated three times at two-week intervals before boosting by intraperito-neal injection. The spleen cells were removed 3 d later and fused with SP2/0 myeloma cells, according to the procedures of Kohler and Milstein (1975)[29]. The hybridomas were cloned by limit dilution, screened using ELISA (described below) and then injected intraperitoneally into BALB/c mice. The mAbs were isotyped using an isotyping kit (Sigma, US), according to the manufacturer’s directions, and were purified by caprylic acid-ammonium sulfate precipitation of ascites [34].
For the polyclonal antibodies againstanthracisvegetative cells, the rabbit was injected subcutaneously with 107cells (inactivated by 1.5% formaldehyde) for three times at two week before boosting by double injection dose. The polyclonal antibodies were purified from the antiserum by caprylic acid-ammonium sulfate precipitation of ascites.
ELISA
For indirect ELISA detection, 96 well microtiter plates were coated with 100ml per well of carbonate-bicarbonate (CB) buffer (pH 9.6) containing either 107–108/ml spores or recombinant EA1 (2, 4, 8, 16mg/ml) and incubated overnight at 4uC. The wells were blocked
with 200ml of blocking buffer (5% skim milk in phosphate buffered saline (PBS) for 2 h at 37uC. Hybridoma culture supernatants or a concentration series of purified mAbs were added in 100ml aliquots
to individual wells and incubated for 30 min at 37uC. Horseradish peroxidase (HRP)-conjugated goat anti-mouse antibodies were added at a dilution of 1/900 and incubated for 20 min.
For sandwich ELISA, the microtiter plates were coated with purified mAbs (10mg/ml) and blocked as described above. The plates were incubated with a range ofBacillus vegetative cells at 37uC for 1 h and then reacted with 10mg/ml polyclonal
antibodies against anthrax at 37uC for 40 min. HRP-conjugated goat anti-rabbit antibodies were added to the plate at a dilution of 1/3000 (Boster, China) and reacted for 30 min at 37uC.
For both indirect ELISA and sandwich ELISA, five washes with PBS with 0.05% Tween 20 (PBST) were carried out between each step. Normal mouse IgG was used as a negative control, and all antibody dilutions were prepared in PBS, containing 1% skim milk. A tetramethylbenzidine substrate (0.1 mg/ml 100ml per well) was added for approximately 10–15 min at 37uC to start the reaction, and 50ml of 2 M H2SO4was added to stop the reaction. Then the absorbance was measured at 450 nm, and each assay was performed in quadruplicate.
Analysis by SDS-PAGE and immunoblotting
Samples were mixed with an equal volume of sample buffer (50 mM Tris-HCl at pH 6.8, 0.5 mol l21 b-mercaptoethanol,
Figure 7. Representative confocal microscopy images of 8G3 binding to fully washedB. anthracisspores (top) and vegetative cells (bottom).The secondary antibodies were R-phycoerythrin-conjugated goat anti-mouse IgG. (red) or FITC-conjugated goat anti-mouse IgG (green). The corresponding phase contrast images (A and D) and fluorescence images (B and E) were merged to show overlap (C and F). Scale bars: spores, 5mm; vegetative cells, 10mm.
doi:10.1371/journal.pone.0007810.g007
20% v/v glycerol, 10% w/v SDS, 0.2% w/v bromophenol blue) and boiled for 10–40 min. The soluble proteins were analyzed by SDS-PAGE using a Bio-Rad gel apparatus, according to the manufacturer’s instructions. For immunological detection, the proteins were transferred from the gels onto polyvinylidene difluoride (PVDF) membranes (Millipore, US). The membranes were blocked in Tris-buffered saline (TBS) containing 5% skim milk at 4uC overnight, and were washed three times for 5 min with Tris-buffered saline Tween-20 (TBST, with 0.05% Tween 20). Then the membranes were incubated in 5mg ml21mAbs, which were diluted in TBS containing 1% skim milk, for 1.5 h at room temperature, followed by three additional 10 min washes. The membranes were incubated for 1 h with a 1/100 dilution of HRP-conjugated goat anti-mouse IgG. Four thorough 10 min washes were completed before the substrate buffer (6 mg 3,39-Diaminobenzidine (DAB) and 10ml of 37% H2O2in 10 ml TBS) was added and allowed to react for 3–5 min. Images were acquired using a Canon digital camera and analyzed using Adobe Photoshop software.
MS protein analysis
The protein band identified on the SDS-PAGE gel was excised, washed, and subjected to tryptic digestion [26]. The peptides were collected and analyzed by delayed extraction-matrix assisted laser desorption ionization-time of flight mass spectrometry (DE-MALDI-TOF-MS). The MS spectra were obtained using an Axima-CFR Plus Mass Spectrometer (Shimadzu Biotech, Japan). All MS analyses were performed at the Institute of Biophysics, Chinese Academy of Sciences, China.
Gene cloning and expression
Sequence data for theB. anthracisgenome were obtained from the National Center for Biotechnology Information (NCBI) web site at http://www.ncbi.nlm.nih.gov. Based on the sequence information, DNA primers were designed to amplify the entireeagopen reading frame of theB. anthracisA16 strain using polymerase chain reaction
(PCR). The chromosomal DNA of A16 was used as the template, and the primer sequences were 59-TATTGGATCCATGGCAAA
GAC-TAACT-39and 59-CTATAGAGCTCGTATAGATTTGGGTT A
-39. The PCR conditions were as follows: 30 cycles of 94uC for 5 min, 94uC for 45 s, 40uC for 45 s, and 72uC for 2 min for 30 cycles; and lastly 72uC for 5 min. The PCR products were digested withBamHI andSacIand were inserted into plasmid pQE-30 (Qiagen, Germany). The recombinant plasmids were transformed into E. coli M15 to express the cloned genein vitro. Firstly, the E. coli M15, carrying recombinant plasmids, were incubated at 37uC at 160 rpm to an average OD600of 0.5 followed by addition of IPTG to 1 mM final concentration, and were incubated for another 4 h at 30uC. Secondly, the cells were harvested by centrifugation at 3000 g for 5 min, and were sonicated by a Vibra-Cell Ultrasonic Processor (Sonics & Materials, USA) as described above. Lastly, after centrifugation at 12,000 g for 20 min, the supernatant containing recombinant EA1 protein with His tag was purified using Ni-nitrilotriacetic acid agarose (Qiagen, Germany) affinity chromatography, according to the manufacturer’s instructions.
Determination of the mAbs affinities
As the antibody affinities reported previously [30], different concentrations of recombinant EA1 (2, 4, 8, 16mg/ml) were
coated on the microwells and incubated with serial dilutions of mAbs for indirect ELISAs. The affinity constants (Kaff) of the mAbs (8G3, 10C6 and 12F6) for the recombinant EA1 protein were measured using the equation: Kaff= (n21)/2(n[Ab9]t2[Ab]t), where n = [Ag]/[Ag9]. Briefly, [Ag] and [Ag9] are antigen (EA1) concentrations. [Ab9]t and [Ab]t are the measurable total antibody concentrations at the half maximum OD (OD-50) for plates coated with [Ag9] and [Ag], respectively.
Indirect immunofluorescence
For the indirect immunofluorescence assays, 200ml aliquots of spore or vegetative cell suspension (109CFU ml21) were pelleted Table 1.Bacterial strains examined in this study.
Strains Source Plasmid
pXO1 pXO2
B. anthracisA16 Institute of Microbiology and Epidemiology, AMMS + + B. anthracis170044 Institute of Microbiology and Epidemiology, AMMS + + B. anthracisCMCC(B) 63002 National Center for Medical Culture Collections, China + 2
B. anthracisCMCC(B) 63005 National Center for Medical Culture Collections, China 2 + B. cereusCCTCCAB 93038+ Institute of Microbiology and Epidemiology, AMMS
B. cereusATCC 33018 Huazhong Agricultural University, China
B. thuringienesissubsp. alesti Huazhong Agricultural University, China
B. thuringienesissubsp. sotto Huazhong Agricultural University, China
B.licheniformis Institute of Microbiology and Epidemiology, AMMS
B. subtilis Institute of Microbiology and Epidemiology, AMMS
B. megaterium Institute of Microbiology and Epidemiology, AMMS
B. mycoides Wuhan Institute of Virology, Chinese Academy of Sciences
B. pumilus Wuhan Institute of Virology, Chinese Academy of Sciences
Proteus vulgaris Wuhan Institute of Virology, Chinese Academy of Sciences
E. coliBL21 Wuhan Institute of Virology, Chinese Academy of Sciences
E. coliM15 Wuhan Institute of Virology, Chinese Academy of Sciences
AMSS: the Academy of Military Medical Sciences, China. doi:10.1371/journal.pone.0007810.t001
by centrifugation at 10,0006g for 1 min at room temperature. The spores and vegetative cells were resuspended by adding 500ml blocking buffer and incubated for 2 h at 37uC with gentle
shaking (70–100 rpm). Aliquots of mAbs (500ml; 1mg ml21) were added and the mixture was incubated for 1 h at 37uC with shaking. R-phycoerythrin-conjugated goat anti-mouse IgG (Sig-ma, US) or FITC-conjugated goat anti-mouse IgG (Boster, China) was used as the secondary antibody (100ml, 1/50 dilution), and was added to the spores or vegetative cell solution respectively. The mixture was incubated for 40 min at room temperature in the dark. Each step was followed by three 10 min washes in PBST, followed by centrifugation at 10,0006g for 1 min to remove the supernatant. The antibodies were collected in PBS containing 1% skim milk, and images were acquired using a Leica confocal microscope.
Supporting Information
Figure S1 Confocal microscopy images of negative control antibody binding to B. anthracis. The secondary antibodies were
R-phycoerythrin-conjugated goat anti-mouse IgG. (B. anthracis spores, top) and FITC-conjugated goat anti-mouse IgG (vegetative cells, bottom). Scale bars: spores, 5mm; vegetative cells, 10mm
Found at: doi:10.1371/journal.pone.0007810.s001 (0.53 MB DOC)
Table S1 Additional B. thuringienesis subspecies and B. cereus isolates than the strains shown in the manuscript were reacted with our mAbs to further determine the mAbs species specificity. The B. cereus strains were from Wuhan Institute of Virology, Chinese Academy of Sciences. The B. thuringiensis strains were from Huazhong Agricultural University, China.
Found at: doi:10.1371/journal.pone.0007810.s002 (0.07 MB DOC)
Author Contributions
Conceived and designed the experiments: DBW XEZ. Performed the experiments: DBW XYY. Analyzed the data: DBW RY ZPZ LJB HPW YFZ ZY. Contributed reagents/materials/analysis tools: DBW RY ZPZ. Wrote the paper: DBW XEZ.
References
1. Green BD, Battisti L, Koehler TM, Thorne CB, Ivins BE (1985) Demonstration of a capsule plasmid inBacillus anthracis. Infect Immun 49: 291–297. 2. Mikesell P, Ivins BE, Ristroph JD, Dreier TM (1983) Evidence for
plasmid-mediated toxin production inBacillus anthracis. Infect Immun 39: 371–376. 3. Nicholson WL, Munakata N, Horneck G, Melosh HJ, Setlow P (2000)
Resistance ofBacillus endospores to extreme terrestrial and extraterrestrial environments. Microbiol Mol Biol Rev 64: 548–572.
4. Ash C, Collins MD (1992) Comparative analysis of 23S ribosomal RNA gene sequences ofBacillus anthracisand emeticBacillus cereusdetermined by PCR-direct sequencing. FEMS Microbiol Lett 73: 75–80.
5. Daffonchio D, Cherif A, Borin S (2000) Homoduplex and heteroduplex polymorphisms of the amplified ribosomal 16S–23S internal transcribed spacers describe genetic relationships in the ‘‘Bacillus cereus group’’. Appl Environ Microbiol 66: 5460–5468.
6. Wang SH, Zhang JB, Zhang ZP, Zhou YF, Yang RF, et al. (2006) Construction of single chain variable fragment (ScFv) and BiscFv-alkaline phosphatase fusion protein for detection ofBacillus anthracis. Anal Chem 78: 997–1004. 7. Kleine-Albers C, Bohm R (1989) The detection ofBacillus anthracisprotective
antigens by enzyme immunoassay (EIA) using polyclonal and monoclonal antibodies. Zentralbl Veterinarmed B 36: 226–230.
8. Henderson I, Duggleby CJ, Turnbull PC (1994) Differentiation of Bacillus anthracis from otherBacillus cereusgroup bacteria with the PCR. Int J Syst Bacteriol 44: 99–105.
9. Beyer W, Glockner P, Otto J, Bohm R (1995) A nested PCR method for the detection ofBacillus anthracisin environmental samples collected from former tannery sites. Microbiol Res 150: 179–186.
10. Henriques AO, Beall BW, Roland K, Moran CP Jr (1995) Characterization of cotJ, a sigma E-controlled operon affecting the polypeptide composition of the coat ofBacillus subtilisspores. J Bacteriol 177: 3394–3406.
11. Lee MA, Brightwell G, Leslie D, Bird H, Hamilton A (1999) Fluorescent detection techniques for real-time multiplex strand specific detection ofBacillus anthracisusing rapid PCR. J Appl Microbiol 87: 218–223.
12. Qi Y, Patra G, Liang X, Williams LE, Rose S, et al. (2001) Utilization of the rpoB gene as a specific chromosomal marker for real-time PCR detection of Bacillus anthracis. Appl Environ Microbiol 67: 3720–3727.
13. Skottman T, Piiparinen H, Hyytiainen H, Myllys V, Skurnik M, et al. (2007) Simultaneous real-time PCR detection of Bacillus anthracis, Francisella tularensis and Yersinia pestis. Eur J Clin Microbiol Infect Dis.
14. Hill KK, Ticknor LO, Okinaka RT, Asay M, Blair H, et al. (2004) Fluorescent amplified fragment length polymorphism analysis ofBacillus anthracis,Bacillus cereus, andBacillus thuringiensisisolates. Appl Environ Microbiol 70: 1068–1080. 15. Helgason E, Tourasse NJ, Meisal R, Caugant DA, Kolsto AB (2004) Multilocus
sequence typing scheme for bacteria of theBacillus cereusgroup. Appl Environ Microbiol 70: 191–201.
16. Keim P, Price LB, Klevytska AM, Smith KL, Schupp JM, et al. (2000) Multiple-locus variable-number tandem repeat analysis reveals genetic relationships withinBacillus anthracis. J Bacteriol 182: 2928–2936.
17. Castanha ER, Fox A, Fox KF (2006) Rapid discrimination ofBacillus anthracis from other members of theB. cereusgroup by mass and sequence of ‘‘intact’’ small acid soluble proteins (SASPs) using mass spectrometry. J Microbiol Methods 67: 230–240.
18. Elhanany E, Barak R, Fisher M, Kobiler D, Altboum Z (2001) Detection of specificBacillus anthracisspore biomarkers by matrix-assisted laser desorption/ ionization time-of-flight mass spectrometry. Rapid Commun Mass Spectrom 15: 2110–2116.
19. Williams DD, Benedek O, Turnbough CL Jr (2003) Species-specific peptide ligands for the detection ofBacillus anthracisspores. Appl Environ Microbiol 69: 6288–6293.
20. Kozel TR, Murphy WJ, Brandt S, Blazar BR, Lovchik JA, et al. (2004) mAbs to Bacillus anthraciscapsular antigen for immunoprotection in anthrax and detection of antigenemia. Proc Natl Acad Sci U S A 101: 5042–5047.
21. Swiecki MK, Lisanby MW, Shu F, Turnbough CL Jr, Kearney JF (2006) Monoclonal antibodies for Bacillus anthracis spore detection and functional analyses of spore germination and outgrowth. J Immunol 176: 6076–6084. 22. Mechaly A, Zahavy E, Fisher M (2008) Development and implementation of a
single-chain Fv antibody for specific detection ofBacillus anthracisspores. Appl Environ Microbiol 74: 818–822.
23. Love TE, Redmond C, Mayers CN (2008) Real time detection ofanthraxspores using highly specific anti-EA1 recombinant antibodies produced by competitive panning. J Immunol Methods 334: 1–10.
24. Mesnage S, Tosi-Couture E, Mock M, Gounon P, Fouet A (1997) Molecular characterization of theBacillus anthracismain S-layer component: evidence that it is the major cell-associated antigen. Mol Microbiol 23: 1147–1155.
25. Fritz DL, Jaax NK, Lawrence WB, Davis KJ, Pitt ML, et al. (1995) Pathology of experimental inhalationanthraxin the rhesus monkey. Lab Invest 73: 691–702. 26. Delvecchio VG, Connolly JP, Alefantis TG, Walz A, Quan MA, et al. (2006) Proteomic profiling and identification of immunodominant spore antigens of Bacillus anthracis,Bacillus cereus, andBacillus thuringiensis. Appl Environ Microbiol 72: 6355–6363.
27. Lai EM, Phadke ND, Kachman MT, Giorno R, Vazquez S, et al. (2003) Proteomic analysis of the spore coats of Bacillus subtilisandBacillus anthracis. J Bacteriol 185: 1443–1454.
28. Williams DD, Turnbough CL Jr (2004) Surface layer protein EA1 is not a component ofBacillus anthracisspores but is a persistent contaminant in spore preparations. J Bacteriol 186: 566–569.
29. Kohler G, Milstein C (1975) Continuous cultures of fused cells secreting antibody of predefined specificity. Nature 256: 495–497.
30. Beatty JD, Beatty BG, Vlahos WG (1987) Measurement of monoclonal antibody affinity by non-competitive enzyme immunoassay. J Immunol Methods 100: 173–179.
31. Mesnage S, Tosi-Couture E, Gounon P, Mock M, Fouet A (1998) The capsule and S-layer: two independent and yet compatible macromolecular structures in Bacillus anthracis. J Bacteriol 180: 52–58.
32. Dang JL, Heroux K, Kearney J, Arasteh A, Gostomski M, et al. (2001)Bacillus spore inactivation methods affect detection assays. Appl Environ Microbiol 67: 3665–3670.
33. Sonenshein AL, Cami B, Brevet J, Cote R (1974) Isolation and characterization of rifampin-resistant and streptolydigin-resistant mutants ofBacillus subtiliswith altered sporulation properties. J Bacteriol 120: 253–265.