From Parasite to Mutualist:
Rapid Evolution of
Wolbachia
in Natural Populations of
Drosophila
Andrew R. Weeks1*, Michael Turelli2, William R. Harcombe3, K. Tracy Reynolds1, Ary A. Hoffmann1
1Department of Genetics, Centre for Environmental Stress and Adaptation Research, University of Melbourne, Parkville, Victoria, Australia,2Section of Evolution and Ecology and Center for Population Biology, University of California Davis, Davis, California, United States of America,3Section of Integrative Biology, University of Texas, Austin, Texas, United States of America
Wolbachiaare maternally inherited bacteria that commonly spread through host populations by causing cytoplasmic incompatibility, often expressed as reduced egg hatch when uninfected females mate with infected males. Infected females are frequently less fecund as a consequence ofWolbachiainfection. However, theory predicts that because of maternal transmission, these‘‘parasites’’will tend to evolve towards a more mutualistic association with their hosts.
Drosophila simulansin California provided the classic case of aWolbachiainfection spreading in nature. Cytoplasmic incompatibility allowed the infection to spread through individual populations within a few years and from southern to northern California (more than 700 km) within a decade, despite reducing the fecundity of infected females by 15%– 20% under laboratory conditions. Here we show that theWolbachiain CaliforniaD. simulanshave changed over the last 20 y so that infected females now exhibit an average 10% fecundity advantage over uninfected females in the laboratory. Our data suggest smaller but qualitatively similar changes in relative fecundity in nature and demonstrate that fecundity-increasingWolbachia variants are currently polymorphic in natural populations.
Citation: Weeks AR, Turelli M, Harcombe WR, Reynolds KT, Hoffmann AA (2007) From parasite to mutualist: Rapid evolution ofWolbachiain natural populations ofDrosophila. PLoS Biol 5(5): e114. doi:10.1371/journal.pbio.0050114
Introduction
When microbes that live within animal cells are trans-mitted only maternally, their reproductive success is directly tied to that of the matrilines they inhabit. Both intuition and mathematics suggest that such endosymbionts will be selected towards mutualism, if possible, increasing the fecundity of their female hosts [1]. The expectation that vertical trans-mission favours evolution towards mutualism is supported by both laboratory co-evolution experiments between viruses and bacteria and comparative data from a wide range of natural associations [1,2]. Mutualisms generally have long evolutionary histories, but given the potentially explosive rate of bacterial evolution [3], rapid evolution of mutualisms in nature might also be expected. Here we report such evolution by bacteria (Wolbachia) associated with a dipteran host
(Drosophila simulans)in natural California populations. In less than 20 y, theWolbachiain CaliforniaD. simulanshave changed so that infected females now produce more eggs than uninfected females under laboratory conditions, whereas infected females previously suffered a significant fecundity deficit.
Cytoplasmic incompatibility (CI) in insects is normally caused whenWolbachia-infected males mate with uninfected females or females that carry a differentWolbachiastrain [4]. Because CI causes embryo lethality, infected females, who are protected from CI, often have a reproductive advantage over uninfected females. This results in the rapid spread of the infection through host populations when theWolbachia are faithfully transmitted from mother to offspring and produce relatively minor fitness costs.
Hoffmann et al. [5] discovered Wolbachia-induced CI in California populations ofD. simulans. Initially, the California
D. simulans Wolbachia(wRi) infection was found only south of the Tehachapi transverse range in the southern quarter of the state. From 1985 to 1994, we monitored the infection’s spread north [6,7]. We showed that the dynamics and equilibrium infection frequencies in nature could be described accurately by a discrete-generation model with only three parameters:l, the average frequency of uninfected ova produced by an infected female;H,the relative hatch rate from‘‘ incompat-ible’’fertilisations of uninfected eggs by sperm from infected males (the other three possible fertilisations produce indis-tinguishable hatch rates); and F, the relative fecundity of infected females [8–10]. Using replicated field assays in the early 1990s, we found the following:l’0.045,H’0.55, and
F’1.0. In contrast, in laboratory populations, the infection showed perfect maternal transmission (l¼0), and infected females were 10%–20% less fecund than uninfected females (F’0.8–0.9). Our field-based parameter estimates produce a predicted equilibrium infection frequency, p^ ’ 0.94, con-sistent with data from several locations, including three populations where we monitored the infection’s introduction and spread over about 2 y, with dynamics that roughly matched our simple predictions [7]. ThewRi infection quickly
Academic Editor:Laurent Keller, University of Lausanne, Switzerland
ReceivedJanuary 11, 2006;AcceptedFebruary 26, 2007;PublishedApril 17, 2007
Copyright:Ó2007 Weeks et al. This is an open-access article distributed under the terms of the Creative Commons Attribution License, which permits unrestricted use, distribution, and reproduction in any medium, provided the original author and source are credited.
Abbreviations:bCI, bootstrapped confidence interval; CI, cytoplasmic incompat-ibility;wRi,Drosophila simulans Wolbachia
spread northward through California and is now pervasive throughout most North American populations ofD. simulans. Models suggest that bothWolbachiainfections and the host nuclear background should evolve to reduce deleterious effects associated with the infection and to increase the transmission fidelity of the microbe [11,12]. Despite the fact that CI allows Wolbachia to spread within populations, intrapopulation selection of Wolbachia is not expected to directly affect the level of CI [11,12], unless host populations are structured so that kin selection favours more intense CI [13] (e.g., when infected males can reduce the larval competition experienced by the progeny of their female siblings, a condition that is likely to be rare forD. simulans). In contrast, host evolution is expected to reduce the intensity of CI (i.e., increase embryo viability from incompatible crosses) [12]. BothWolbachiaand host evolution affecting transmission (l), level of incompatibility (H), and fecundity of infected hosts (F) are plausible, because both Wolbachia- and host-related effects influence CI, transmission, and fitness [14–16]. Indeed, some Wolbachiainfections do not induce detectable levels of CI and have no known deleterious effects on host fitness [17,18]. Positive fitness effects from Wolbachia infec-tions have been suggested [19–22], and indirect comparative evidence from different Wolbachia infections in Drosophila
indicates thatWolbachia–host interactions may become more benign and potentially mutualistic over time [4,23].
Southern California populations ofD. simulansare natural candidates for observing such evolution, because they have been stably infected for at least two decades, the host populations produce on the order of 10–15 generations per year [7], and the parameter values describing transmission, fecundity, and CI level are such that both the infection and its host should experience significant pressure to evolve [12]. We have informally monitored these populations for evolu-tionary changes in CI and otherWolbachia effects for about a decade. Here we provide our accumulated evidence that the
Wolbachia infection in D. simulans has changed to become more mutualistic, while no evolution by either theWolbachia
or D. simulans has been detected affecting CI levels or the fidelity of maternal transmission.
Results
Fecundity Effects in the Laboratory
Apart from the viability effects associated with CI, female fecundity is the only fitness component known to be affected by the wRi infection in California D. simulans [9]. To test whether fecundity effects associated with this Wolbachia
infection have evolved, we re-examined female fecundity in California D. simulans after 20 y [5]. In the late 1980s, fecundity costs were evident in the laboratory when lines treated with the antibiotic tetracycline, which curesWolbachia
infections, were compared to untreated lines, or when naturally uninfected and infected lines were compared [9]. Flies were collected in 2002 and uninfected lines were generated by treatment with tetracycline. Infected and uninfected lines were then scored for fecundity every day over 5 d. Overall, there was a fecundity advantage associated with the infection; in some lines no fecundity advantage was detected, while in other lines the total egg output was significantly greater in infected individuals (Figure 1A). In contrast, the wRi line collected from Riverside in 1988 and maintained in the laboratory still produced a fecundity deficit, comparable to the deficits found in infected lines previously (see Table 10 of [8] and Table 7 of [9]). We repeated this fecundity assay, again curing many of the same lines after 10 mo of laboratory culture. To test the sensitivity of the fecundity effect to culture conditions, we restricted access to yeast. Overall, the infected lines still showed greater fecundity than the uninfected lines derived from them. Although one line showed a decrease in fecundity when infected, there was a significant increase overall, and no significant interaction effect (Figure 1B). When individual lines were considered, there appeared to be a shift in fecundity for line R3 and R24 (Figure 1A and 1B). However, when we computed confidence intervals on these data for the difference in fecundity relative to the uninfected lines, the bootstrapped confidence intervals (bCIs) overlapped be-tween, for example, the yeasted R3 line (mean difference 42%, 95% bCI 3.7% to 85%) and non-yeasted R3 line assays (mean difference 0.4%, 95% bCI6.8% to 20.4%). Hence, the lack of repeatability for the statistical significance of individual lines is likely to reflect primarily the large inherent stochasticity of fecundity data. In contrast, the positive effect of the Wolbachiainfection on mean fecundity across lines is evident in both of the experimental treatments reported in Figure 1A and 1B (the mean effect is 23% in Figure 1A and 10% in Figure 1B).
BecauseWolbachiaeffects on fitness may be temporarily or permanently induced by tetracycline treatment [14,24], we re-collected isofemale lines ofD. simulansfrom Irvine, California, in 2004. We then generated uninfected lines from these and reciprocally crossed infected and uninfected sublines two generations after tetracycline treatment (using old males in the incompatible cross) to homogenise nuclear backgrounds and remove the effects of the antibiotic treatment. Fecundity was then assayed each day over 10 d, controlling for body size. Again, a significant overall fecundity advantage of approx-imately 10% was associated withWolbachiainfection (F1,185¼ 8.03,p¼0.005), with three lines out of eleven (IR1, IR2, and
Author Summary
Wolbachiaare endosymbiotic bacteria that live inside the cells of their invertebrate hosts. They are transmitted directly from mother to offspring, and spread through populations by manipulating the reproduction of their hosts. The most common reproductive manipulation responsible for the spread of these bacteria, called ‘‘cytoplasmic incompatibility,’’arises when infected males mate with uninfected females, resulting in fewer offspring than normal. There are fitness costs for the hosts associated withWolbachiainfections, most commonly involving a reduction in egg production. Theory predicts that this detrimental effect ofWolbachiaon its host should result in selection for the bacteria to evolve a more benign lifestyle, changing the bacterium from being parasitic to more mutualistic.
We document such a shift in a Wolbachia infection of fruit flies
(Drosophila simulans)from California. The shift occurred extremely
rapidly, over 20 years. Consequently,Wolbachia-infected hosts now
have higher rates of egg production than their uninfected
counter-parts. Changes in the genome ofWolbachiaseem to be responsible
IR28) showing a significant fecundity advantage (Figure 1C). Therefore, the fecundity effect associated with the wRi infection in the laboratory has changed from negative to positive. The apparent lack of consistency of this fecundity advantage across individual lines suggests that there may be polymorphism among the Wolbachia strains infecting the populations near Riverside and Irvine. These data do not demonstrate polymorphism because there is no significant line-by-infection interaction in our fecundity assays. How-ever, polymorphism is expected from our theoretical analyses
(see ‘‘Mathematical Analyses’’) and is directly demonstrated from additional data presented below.
Our data indicate that the fecundity deficit initially associated with the wRi infection in laboratory assays [7,9] has disappeared. We computed 95% CIs of the mean difference between infected and uninfected lines following Sokal and Rohlf (p. 444 of [25]) for the 2004 Irvine data and earlier published data (Table 10 of [9]; Table 7 of [7]). The mean difference for infected minus uninfected lines from the 2004 data was 10.4% (95% bCI 2.6% to 18.2%) and for the earlier data was19.4% (95% bCI24.5% to13.6%). Thus, the infection has changed from causing a significant fecundity deficit to causing a significant fecundity advantage in the laboratory (an overall shift of 30%).
Fecundity Effects
WolbachiaorDrosophilaevolution?We have shown that the fecundity deficit associated with the wRi infection has changed into a fecundity benefit in less than 20 y, while (as shown below) both CI and transmission levels have stayed roughly constant. But what is causing this effect? To determine whether the fecundity benefit is caused by the
Wolbachiaor an interaction betweenWolbachiaand its host, we backcrossed for five generations the oldwRi strain collected in 1988 into the IR2 (Irvine isofemale line 2; Figure 1C) nuclear background, and the IR2 Wolbachia strain into the Riverside 1988 nuclear background. We then assayed fecund-ity as before over 10 d and found a clear strain effect (F1,77¼ 18.3,p,0.001) but no effect of nuclear background (F1,77¼ 0.95, p¼0.33) or interaction between nuclear background and Wolbachia strain (F1,74¼0.02, p¼0.88) (Figure 2). This supports the previous finding in our fecundity assays that showed no interaction of line (nuclear genome) by infection (F10,175¼1.06, p¼0.40). Thus, the observed change in the fecundity effect ofWolbachiainfection appears mostly due to
Wolbachiaevolution.
Wolbachia polymorphism? To test whether the Wolbachia
advantage is polymorphic in the Irvine 2004 collection, we backcrossed for two generations the nuclear background of the old wRi line collected in 1988 into 20 strains from the Irvine 2004 collection so that we could determine strain effects on a similar nuclear background (at least 75% homogeneous). Fecundity was assayed as before over 10 d, and we found a clear strain effect on fecundity (F19,290¼2.49,
Figure 1.Fecundity Assays on Infected and Uninfected Isofemale Lines ofD. simulansCollected from California in 2002 and 2004
(A) Mean number of eggs over 5 d laid by infected (black bars) and uninfected (white bars) lines collected at Riverside in 2002 and 1988. The 2002 lines were assayed four generations after collection. A significant overall increase in fecundity was associated with the infection (F1,108¼ 6.7,p¼0.011).
(B) Mean number of eggs over 5 d laid by infected (black) and uninfected (white) lines collected at Riverside in 2002 and assayed 10 mo after collection. These flies were cultured on a yeast-restricted diet. Again, the infection produced a significant overall increase in fecundity (F1,213¼5.8,
p¼0.017).
(C) Mean number of eggs over 10 d laid by infected (black) and uninfected (white) lines collected at Irvine in 2004 and assayed five generations after collection. Infection status had a significant effect on fecundity (F1,185¼8.03,p¼0.005).
Error bars are standard errors, and asterisks indicate significant differences at the 5% level.
doi:10.1371/journal.pbio.0050114.g001
Figure 2.Effects ofWolbachiaStrain and Nuclear Background on 10-d Fecundity ofD. simulans
The nuclear background (normal text) andWolbachiastrain (superscript text) are for flies collected in Riverside in 1988 (Riv88) or Irvine in 2004 (IR2). Error bars are standard errors. Different letters indicate significantly different means (at the 5% level).
p,0.001) (Figure 3). Some residual nuclear effects are likely to contribute to this strain difference, but polymorphic
Wolbachiaeffects are also likely to be involved, consistent with the variable differences between cured and infected lines described above. Coefficients of variation calculated from the data for Figure 1C were larger (15% for infected lines and 12% for uninfected lines) than for the data in Figure 3 (6%) when nuclear effects were controlled.
CI Levels
Evolutionary changes may also influence CI levels and maternal transmission. To test for changes in CI, we reciprocally mated infected and uninfected individuals derived from isofemale lines ofD. simulanscollected in 1999 and 2002 and compared these with the oldwRi line collected at Riverside in 1988. We also mated females to males that were 5, 10, and 15 d post-eclosion, as male age can affect CI [7,9,26]. When males were 5 d old, levels of CI were high, with an average of 92% egg mortality for all lines in crosses between uninfected females and infected males (Figure 4). CI levels did drop off when males were 10 and 15 d old, as described previously [7,9]. However, there was no difference in the level of CI between the Riverside collections in 1999 and 2002 and the old 1988wRi line, and the power of our CI
tests indicated that we could have detected a difference of 8% or greater. Hence, the level of CI has certainly evolved significantly less than the fecundity effects observed in our laboratory assays.
The levels of CI for matings involving males in the three age classes are also similar to those found previously [7,9]. We assume that the lack of change of CI in our laboratory assays implies relative constancy of CI levels in nature. Hence, we expect that H, the average relative hatch rate from an incompatible fertilisation in nature (sperm from an infected male fertilising an uninfected ovum), remains approximately 0.55, as estimated previously [7].
Maternal Transmission and Population Frequencies We did not directly re-measure field maternal transmission rates of the Wolbachia infection. Instead, we used field infection frequencies and our assumption that H remains approximately 0.55 to indirectly estimate transmission efficiency, as any significant increase or decrease in maternal
Wolbachiatransmission would lead to an observable change in the equilibrium infection frequency. For instance, withH¼ 0.55, explaining an equilibrium frequency of 0.94 requires a transmission efficiency of 0.964 to 0.953 if the relative fecundity of infected females,F,is between 0.9 and 1.1. Our previous estimates of transmission frequency in nature, denoted 1l, averaged 0.96, consistent with the observed infection frequency and field estimates of CI intensity and relative fecundity [7]. Because selection among mutually compatibleWolbachiavariants acts to increase the parameter combination F(1 l) [12], we expect l to decrease. If the failure rate of maternal transmission,l, was halved to 0.02 (which would have roughly the same fitness impact on
Wolbachia as increasing F by only 2%), the expected equilibrium infection frequencies would rise to 0.97, withH ¼ 0.55 and F between 1.0 and 1.1 (see ‘‘Mathematical Analyses’’).
We collected 654D. simulansfemales from four locations in California (Irvine, Ivanhoe, Riverside, and Winters), and screened F1 females from each field-collected female for
Wolbachiausing PCR. We found that infection frequencies did not differ significantly between the locations, with an overall Figure 3.Effects ofWolbachiaStrain on 10-d Fecundity ofD. simulansCollected at Irvine in 2004 and Backcrossed for Two Generations to Males from Riverside Collected in 1988
Error bars are standard errors. doi:10.1371/journal.pbio.0050114.g003
Figure 4.Levels of CI Induced byWolbachia-InfectedD. simulansMales 5, 10, and 15 d Post-Eclosion When Mated to Uninfected Females Isofemale lines originated from California in 1988 (hatched bars), 1999 (grey bars), and 2002 (white bars). Error bars are 95% confidence intervals.
infection frequency of 93% (Table 1;Gtest for homogeneity,
G¼3.09, df¼3,p¼0.38). These infection frequencies do not differ from those found in earlier studies [7,9], suggesting that transmission ofWolbachiafrom mother to offspring (1l) has not changed appreciably.
In SituWolbachiaEvolution or Invasion of a New Strain? To determine if the observed fecundity advantage ofwRi infection is associated with evolution of thewRi strain and not merely a new strain of Wolbachia that has invaded California, we tested for compatibility between the oldwRi line collected in 1988 and the IR2 line collected from Irvine in 2004. IfWolbachiastrains are incompatible (i.e., cause CI in matings between lines), then it is likely that a new strain has invaded California populations ofD. simulans. However, we found no difference between the hatch rates of crosses between and within lines (F3,72¼0.08, p¼0.97), indicating complete compatibility between the Wolbachia strains. In addition, we sequenced part of theWolbachia wsp gene (611 bp) for the oldwRi strain collected in 1988 and strains from 25 isofemale lines collected at Irvine in 2004 and found no differences at the nucleotide level. We also sequenced part of theWolbachia ftsZgene (718 bp) for five of these strains and found no differences in nucleotide sequence compared to the 1988 wRi strain. Therefore, it is likely that the change in fecundity has involved evolution of thewRi strain rather than invasion by a new strain.
Fecundity Effects in Nature versus the Laboratory Essentially all studies ofWolbachiaeffects have been limited to laboratory populations. ThewRi infection ofD. simulansis one of very few whose effects have been studied in nature (cf. [27–29]). We have shown thatwRi has apparently evolved in nature over the past 15 y so that laboratory isofemale lines with the infection tend to show a fecundity advantage on the order of 10% rather than a fecundity disadvantage on the order of 20%, as was the case when thewRi infection was new in CaliforniaD. simulans. We do not yet have new fecundity data from wild-collected females to directly compare fecund-ities of infected versus uninfected females in nature.
However, we previously reported such data while we tracked the northward spread of wRi through California. During this spread, we were able to study populations in which wRi was at intermediate frequencies, allowing us to make comparisons between the fecundities of wild-collected infected versus uninfected females. We performed nine comparisons, four in the Tehachapi mountains of southern California in 1988–1989 (Table 4 of [9]), then five more near
Davis in northern California in 1992–1993 (Tables 6 and 7 of [7]) (all of these data are summarised in Table S1). Collectively these studies assayed the fecundity of more than 1,000 females from nature, and each of our nine comparisons was based on 45–203 females. Only the first of these nine studies (104 females) found a statistically significant fecundity deficit for infected females (F¼0.82,p,0.05). More relevant to our new laboratory fecundity data is that the four 1988–1989 studies produced an average relative fecundity of F¼0.92, whereas the five 1992–1993 studies produced an average ofF ¼1.03 (with three of the last five point estimates forFabove one). Although the difference between these two sets of estimates is marginally non-significant in a one-tailed test (t -test,t¼1.76, df¼7,p¼0.06), it suggests that the changes in relative fecundity we have documented in the laboratory reflect similar changes in nature. This is discussed further below in light of our theoretical analyses.
Discussion
In less than 20 y, the wRi strain that invaded and spread throughout California in the 1980s has evolved from inducing a fecundity deficit in the laboratory to providing a fecundity benefit to its host, as theory predicts [12]. There has been no detectable change in the level of CI, indicating that the genes controlling fecundity have at most minor pleiotropic effects on CI. Rapid evolutionary change within this system has resulted in a parasitic Wolbachia evolving towards a more mutualistic interaction with its host. Interspecific compar-isons (e.g., [30–32]) and laboratory experimental evolution systems (e.g., [33]) provide many examples supporting the theoretical prediction that vertical transmission, as opposed to horizontal transmission or a mixed mode of transmission, tends to promote mutualism [34–36]. There are well-known examples in which viruses have rapidly evolved to become more benign in nature [37,38]. However, these are best interpreted as evolution towards an ‘‘optimal’’ level of virulence, rather than evolution towards mutualism [34]. We know of no previous examples in which an evolutionary shift towards mutualism has been observed over a period of decades in nature.
To understand the evolutionary dynamics in nature that have so rapidly produced the new fecundity effects, we assume—consistent with our laboratory CI data—that the relevant Wolbachia variants are fully compatible with each other. This implies that within the population of infected individuals, the frequencies of alternative Wolbachia types follow haploid selection dynamics with fitness determined by the parameter combinationF(1l), irrespective of whether the variants cause different levels of CI with uninfected individuals [12]. Between 1988 and 2002, the California populations of D. simulans have produced about 200 gen-erations [7]. The observed fecundity variation produced by differentWolbachiaon a common genetic background (Figure 3) demonstrates polymorphism for the fecundity-increasing
Wolbachiavariant(s). Irrespective of within-host dynamics, we can use discrete-generation haploid selection theory to explore the selective pressures responsible for the spread of fecundity-enhancing variants among hosts and their likely evolutionary trajectory (see‘‘Mathematical Analyses’’).
Assuming that the observed changes are attributable to increased frequency of variants initially present, but ex-Table 1.WolbachiaInfection Frequency in Four Populations of
D. simulansfrom California in 2004
Site N Frequency
of Infection
95% CI
Irvine 205 0.94 (0.91, 0.97)
Riverside 135 0.94 (0.90, 0.97)
Ivanhoe 126 0.92 (0.87, 0.96)
Winters 188 0.90 (0.85, 0.94)
Overall 654 0.93 (0.90, 0.94)
tremely rare, in the 1988 southern CaliforniawRi population, our analysis suggests that selective advantages in the field are likely to be on the order of 5% (whereas 1% or 15% are unlikely). Theory also indicates that the current polymor-phism should be transient and that the fecundity-enhancing variants should reach very high frequencies in these populations over the next 5–10 y. Hence, we predict that the continuing evolution of theseWolbachiapopulations will be easily documented.
Our data on compatibility of the ‘‘new’’ versus ‘‘old’’ Wolbachiavariants and their DNA sequence similarity indicate that Wolbachia effects on its host evolve readily in natural populations by selection among closely related Wolbachia
variants. Such rapid evolution helps to explain the diversity of effects ofWolbachiaon host fitness noted in the literature: these effects range from negative [9,15,39] to positive [19,21,22] to the extreme whereWolbachiabecomes essential for host survival [20] or host fertility [40,41]. It also helps to explain the inconsistent effects ofWolbachia on host fitness detected in previous experiments [22,42]; changes in the apparent host effects of Wolbachia over time or between experiments may well reflect selection among Wolbachia
variants rather than residual effects of antibiotics or changes inWolbachia density. The rapid evolution of wRi, as well as rapid evolution ofWolbachia hosts [43], suggests a dynamic interaction between parasitic and mutualistic life modes and rapidly changing effects of endosymbionts in host insect evolution.
Materials and Methods
Strains.The CI assays usedD. simulans collected from Riverside, California, in 1998 and 2002 and maintained in the lab as isofemale lines until testing. Fecundity assays included the 2002 isofemale lines and those established from females collected at Irvine, California, in 2004. A CaliforniawRi-infected line from 1988 was included in some assays. To determine the infection frequencies in California populations, approximately 200 femaleD. simulanswere collected at each of four localities (Irvine, Ivanhoe, Riverside, and Winters) in 2004, and F1 individuals scored for infection status by PCR assay (described below).
To produce uninfected sublines for each line, larvae were treated with 0.03% tetracycline [5] for two generations. Lines were reared for at least two generations without tetracycline before the CI and fecundity experiments.
CI assay.Level of CI was determined by mating virgin 5-, 10-, and 15-d-oldWolbachia-infected males to uninfected virgin females (.5 d old) from the same 1998 and 2002 collected lines. Reciprocal crosses acted as controls. Males were mated once, and females were placed after mating in a vial with a spoon containing 5 ml of agar-treacle-yeast medium and left for 24 h at 258C. The number of unhatched eggs was counted.24 h later.
CI data (egg hatch rates) were angular transformed prior to analysis. Model I ANOVA (analysis of variance) andt-tests were used to compare CI levels between the Riverside collections from 1998 and 2002 and thewRi line from 1988.
Fecundity assay.Five fecundity experiments were done. In the first two (Figure 1A and 1B), lines from the 2002 Riverside collection were cured, and infected and uninfected females from each line were mated to uninfected males from the same line. In the first experi-ment, the 1988 wRi line was included to re-test the previously described fecundity deficit [9]. Flies were reared at low densities by placing 20 eggs per vial on 15 ml of medium. To measure fecundity of emerging flies, pairs of 1-d-old virgin females and males were placed in vials with spoons as for the CI tests. Spoons were replaced every 24 h for 5 d and eggs counted. Between ten and 15 females were assayed for each line. Yeast paste was added to the medium surface in the first experiment, but not in the second experiment, to see if the same fecundity-enhancing Wolbachia effect could be detected when egg output was suppressed due to the absence of live yeast.
In the third experiment (Figure 1C), lines from the 2004 Irvine
collection were cured as above. To control for nuclear background, we crossed uninfected and infected flies from the same line reciprocally and scored F1offspring for fecundity (with live yeast) after they had been reared and set up as above. Fecundity scoring was extended from 5 to 10 d to increase the likelihood of detecting small differences. Between 15 and 20 replicates were assayed per infected/ uninfected treatment of each isofemale line. Wing size (measured as centroid size based on landmarks [44]) was also measured for each female and used as a covariate in analyses to control for body size.
To assign the effects on fecundity to eitherWolbachiaor a host–
Wolbachiainteraction, we backcrossed the nuclear background of one Irvine line showing the greatest fecundity advantage (Figure 1C; IR2) into the 1988wRi strain, and the 1988wRi line nuclear background into the IR2 strain, both for five generations (Figure 2). Ten-day fecundity was measured on 20 replicate pairs of males and females per backcross line as above.Wolbachiastrain and nuclear background were treated as fixed effects in the ANOVA for fecundity.
Finally, to determine whether the Wolbachiafecundity effect was polymorphic within the 2004 Irvine lines, we backcrossed the 1988
wRi line nuclear background into 20 strains (isofemale lines) from the 2004 Irvine collection for two generations (Figure 3). Ten-day fecundity was measured on 20 replicate pairs of males and females as above. Model I ANOVA was used to determineWolbachiastrain differences for fecundity. We also determined the coefficient of variation [25] for the lines in this experiment and the infected and uninfected lines from the third fecundity experiment (2004 Irvine lines) to see if they fitted the patterns expected (fecundity of infected .fecundity of uninfected.fecundity of infected with a homoge-nised background).
Wolbachiainfection status.We determined the infection status of
all lines collected from the field or after treatment with tetracycline using extracted DNA from females in a PCR with the Wolbachia -specific primers 76–99 forward and 1012–994 reverse which amplify a ;950-bp fragment of bacterial 16S rDNA [45]. TheD. melanogaster
primers su(s) forward 724–753 and su(s) reverse 1113–1092 were included in each reaction as a control [7].
To determine the infection frequency in the four populations collected from California in 2004, we first assayed DNA as above from a single F1 female from each field-collected female. In addition, another PCR with theWolbachia-specific primerswsp81F andwsp619R [46] was performed with the same DNA to minimise the chance of false positives. If either or both of these assays were negative, DNA was extracted from a second F1fly from the same isofemale line and subjected to the two PCRs. This second fly was used to control for PCR artefacts and imperfect maternal transmission ofWolbachia[7,9]. CI data comparing the compatibility of old versus new infections. To determine compatibility between the 1988wRi line and the IR2 line collected at Irvine in 2004, we crossed virgin males and females (.5 d old) between and within each line in a reciprocal design. Males were mated once, and females were placed after mating in a vial with a spoon containing medium as above for the CI assays. The number of unhatched eggs was counted after 48 h. The analysis was as above for the CI assays.
Sequence data comparing the similarity of old versus new infections.To compare the similarity between the 1988 wRi strain and the Irvine strains collected in 2004, we sequenced 611 bp of the highly variableWolbachia wspcell-surface gene [46] and 718 bp of the
Wolbachia ftsZcell-cycle gene. DNA was extracted from a single female from each of 25 isofemale lines from the 2004 Irvine collection and the laboratory line of the 1988 wRi strain. The partial wsp gene fragment was amplified from all lines using the primers and protocol found in [46]; the partial ftsZ gene was amplified from only five isofemale lines from the 2004 Irvine collection and the 1988wRi line as in [47]. Amplified fragments were sequenced using the BigDye Terminator cycle sequencing kit (v3.1, Applied Biosystems, http:// www.appliedbiosystems.com). Sequences were aligned using the CLUSTAL W algorithm [48]. We also included in the analysis the originalwspandftsZsequences of thewRi strain found in GenBank (http://www.ncbi.nlm.nih.gov/Genbank; accession numbers AF020070 and U28178, respectively).
Mathematical analyses.We analysed various mathematical models to address three issues discussed in the text: (1) inferences concerning transmission-rate evolution based on the dependence of equilibrium infection frequencies on the three parameters that are sufficient to explain dynamics and equilibria in nature [7], (2) the intensity of selection responsible for the observed evolution, and (3) predicted future frequency changes in the fecundity-enhancing Wolbachia
variant(s). Our methods and analyses leading to our conclusions are described below.
inferences concerning whether Wolbachia’s maternal transmission rate has evolved, we first considered how the stable equilibrium infection frequency, denotedp^, changes with the parametersH,the relative hatch rate from incompatible crosses, F, the relative fecundity of infected versus uninfected females, andl, the fraction
of uninfected ova produced by an infected female. Based on field estimates of infection frequencies, we concluded that the equilibrium frequency throughout central and southern California in 1992 was approximately^p’0.94 (with 95% confidence interval 0.92 to 0.96) [7]. This was consistent with our theoretical prediction forp^from field-based parameter estimates [7]. Our new laboratory data suggest that F has evolved significantly, while H has remained relatively constant. Given the change inF,it may seem surprising that our new estimate of the infection frequency in central and southern California, approximately 93% (with 95% confidence interval 0.90 to 0.94), does not differ significantly from the frequency estimated previously. Our formula forp^allows us to examine the consistency of these observations.
Evolutionary theory suggests that ifWolbachiavariants remain fully compatible, F(1 l) should tend to increase [12]. Thus, we are
particularly interested in determining whether l has decreased.
However, because fitness is proportional toF(1l), changingFfrom
0.9 to 1.0 or from 1.0 to 1.1 involves a selection coefficient on the order of s ¼ 0.1 (which should produce significant changes in polymorphicWolbachiavariant frequencies over tens of generations). In contrast, halving l from 0.04 to 0.02 involves much weaker
selection, on the order ofs¼0.02, so that hundreds of generations would be required for significant evolution. Hence, we expect that detectable evolutionary changes since the mid-1980s inlare much
less likely than detectable changes inF.
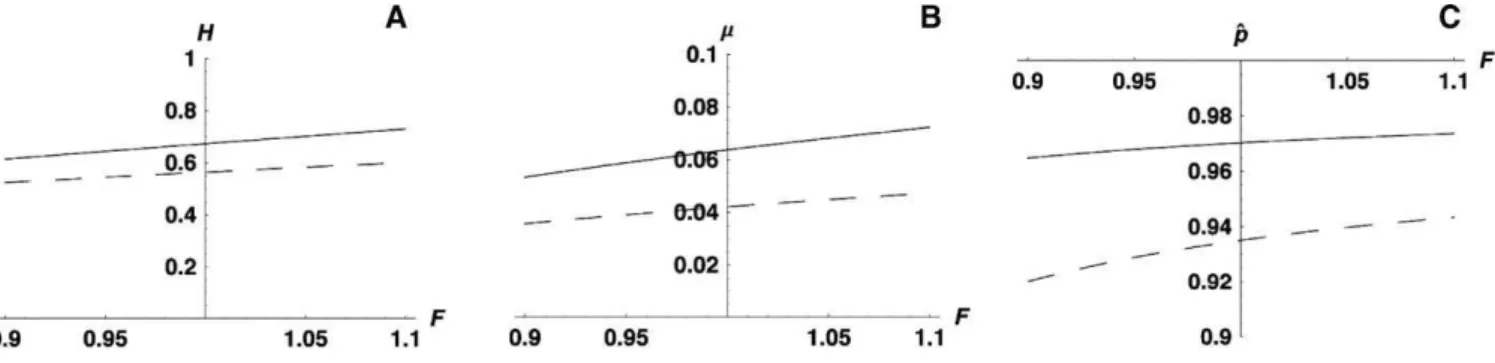
Figure 5A and 5B explore how varyingFchanges the values ofH
andl necessary to explain equilibrium population frequencies of
0.90 or 0.94. Figure 5 assumesl¼0.04 and shows the values ofH
needed to producep^¼0.90 (solid line) versus 0.94 (dashed line) asF
varies from 0.9 to 1.1. As shown, varyingFover this range requires very little change inHto preservep^. Similarly, Figure 5B assumesH¼ 0.55 and shows the values oflneeded to producep^¼0.90 (solid line)
versus 0.94 (dashed line) asFvaries from 0.9 to 1.1. Again, changingF
has little effect. Both graphs indicate that changes inFare likely to have little impact on p^. This is shown directly in Figure 5C, which assumesH¼0.55 andl¼0.045 (orl¼0.0225) and plotsp^asFvaries
from 0.9 to 1.1. Clearly, changes inFover the range suggested by our laboratory and field data have little impact on^p. In contrast, a change in lthat would have a much smaller impact on Wolbachiafitness would produce changes inp^that our samples would have detected.
Regarding selection intensity, within the population of infected individuals, the frequencies of mutually compatibleWolbachiavariants follow haploid selection dynamics with the fitness of each variant proportional toF(1l), irrespective of the level of CI they produce
with uninfected females [12]. All else being equal, two conclusions follow: (1) the level of CI is not subject to direct selection based on between-host frequency dynamics, and (2) for values ofFnear one andlnear zero (as suggested by our data), selection for modifyingFis
much stronger than selection for modifyingl. These inferences are
consistent with our data, which suggest thatHandlhave remained
relatively constant, whileFhas increased.
To make quantitative inferences, we assumed discrete generations. If we consider twoWolbachiavariants such thatF1(1l1)/[F2(1l2)]¼ 1þs,the frequency of variant 1 in generationt,denotedpt,changes
according to
pt 1pt
¼ p0 1p0
ð1þsÞt
: ð1Þ
Our inferences about plausible selection intensities follow from equation 1, assuming that the observed changes have occurred over roughly 200 generations.
Figure 6 illustrates the selection intensity needed to explain a transient polymorphism, assuming that the fecundity-enhancing variant was rare in the population 200 generations ago. It shows that for low initial frequencies (say, between 103 and 106), selection coefficients,s,on the order of 0.04–0.08 would produce polymorphic frequencies (between 0.1 and 0.8, for instance) that are consistent with our data. In contrast, forson the order of 0.01, a significantly longer time would be necessary to produce the polymorphism observed (see Figure 7), whereas if s were as large as 0.15, polymorphism for the fecundity-enhancing variant would tend to be very short-lived (on the order of 2 y).
Regarding future evolution, our analysis suggests that the currently inferred polymorphism for the fecundity-enhancing variant(s) is likely to be transient. We can use equation 1 to understand the time scale over which near-fixation is expected. Figure 7 plots the time required for a favoured variant to increase from an initial frequency of 0.001 up to a frequency of between 0.1 and 0.9. The difference between the highest and lowest lines indicates the time required for the frequency to increase from 0.1 to 0.9. Note that forsas large as Figure 5.Effects of Changes in Parameters for Various Values ofF
(A) Assumingl¼0.04, the solid line shows the value ofHneeded to produce^p¼0.90, and the dashed line shows the value ofHneeded to producep^¼
0.94.
(B) AssumingH¼0.55, the solid line shows the value oflneeded to produce^p¼0.90, and the dashed line shows the value oflneeded to producep^¼
0.94.
(C) AssumingH¼0.55 andl¼0.045 (dashed line) orl¼0.0225 (solid line), this shows how^pchanges.
doi:10.1371/journal.pbio.0050114.g005
Figure 6. Selection Intensity Needed to Explain a Transient Poly-morphism
Intensity of selection,s,needed to explain a current frequency of 0.8 (solid line), 0.4 (short-dashed line), or 0.1 (long-dashed line) as a function of the initial allele frequency measured in units of log10, assuming equation 1.
0.15, this time is only about 31 generations, or approximately 2 y in these populations. Given that samples collected in 2002 and 2004 both showed an apparent polymorphism, it seems unlikely that selection was this intense. This inference is consistent with our conjecture that the currentWolbachia-induced fecundity advantage in nature is likely to be less than the 10% effect observed in the laboratory, just as the fecundity deficit of roughly 15% found in the laboratory in 1989 [9] corresponded to a fecundity deficit for infected field-collected females that was probably less than 10% in 1989 [9] and less than 8% in 1992 [7]. Conversely, if the fecundity advantage was as small as 1% (corresponding tos¼0.01), as Figure 7 shows, the inferred polymorphism would be unlikely to arise in only 15 y (about
200 generations). Hence, for plausible levels of selection, we are likely to be able to observe significant frequency increases of the fecundity-enhancingWolbachiavariant(s) in nature over the next few years.
Supporting Information
Table S1. Previously Published Relative Fecundities, F, of Wild-Caught Infected versus Uninfected Females
Found at doi:10.1371/journal.pbio.0050114.st001 (31 KB DOC).
Accession Numbers
Sequences for thewspandftsZgenes sequenced in this study have been deposited in GenBank (http://www.ncbi.nlm.nih.gov/Genbank) under the accession numbers EF423730–EF423735 for ftsZ and EF423736–EF423761 forwsp.
Acknowledgments
We are grateful to J. A. Coyne, K. A. Dyer, D. J. Futuyma, C. S. McBride, B. C. O’Meara, M. Sherriffs, and two anonymous reviewers for comments and discussions that improved earlier versions of the manuscript.
Author contributions.ARW and AAH conceived and designed the experiments. ARW, WRH, and KTR performed the experiments. MT provided the theoretical analyses. All authors analyzed the data. MT contributed reagents/materials/analysis tools. ARW, MT, and AAH wrote the paper.
Funding. We thank the Australian Research Council (ARC) for financial support via their Special Research Centre program. MT was supported by National Science Foundation grant DEB 0089716 and UC Berkeley’s Miller Institute for Basic Research in Science. This work was carried out while ARW was the recipient of an ARC Postdoctoral Fellowship and AAH held an ARC Federation Fellow-ship.
Competing interests.The authors have declared that no competing interests exist.
References
1. Herre EA, Knowlton N, Mueller UG, Rehner SA (1999) The evolution of mutualisms: Exploring the paths between conflict and cooperation. Trends Ecol Evol 14: 49–53.
2. Moran NA (2006) Symbiosis. Current Biol 16: R866–R871.
3. Elena SF, Lenski RE (2003) Evolution experiments with microorganisms: The dynamics and genetic bases of adaptation. Nat Rev Genet 4: 457–469. 4. Hoffmann AA, Turelli M (1997) Cytoplasmic incompatibility in insects. In: O’Neill S, Hoffmann AA, Werren JH, editors. Influential passengers: Inherited microorganisms and arthropod reproduction. Oxford: Oxford University Press. pp. 42–80.
5. Hoffmann AA, Turelli M, Simmons GM (1986) Unidirectional incompat-ibility between populations ofDrosophila simulans. Evolution 40: 692–701. 6. Turelli M, Hoffmann AA (1991) Rapid spread of an inherited
incompat-ibility factor in CaliforniaDrosophila. Nature 353: 440–442.
7. Turelli M, Hoffmann AA (1995) Cytoplasmic incompatibility inDrosophila
simulans: Dynamics and parameter estimates from natural populations. Genetics 140: 1319–1338.
8. Hoffmann AA, Turelli M (1988) Unidirectional incompatibility in
Drosophila simulans:Inheritance, geographic variation and fitness effects. Genetics 119: 435–444.
9. Hoffmann AA, Turelli M, Harshman LG (1990) Factors affecting the distribution of cytoplasmic incompatibility inDrosophila simulans. Genetics 126: 933–948.
10. Turelli M, Hoffmann AA, McKechnie SW (1992) Dynamics of cytoplasmic
incompatibility and mtDNA variation in natural Drosophila simulans
populations. Genetics 132: 713–723.
11. Prout T (1994) Some evolutionary possibilities for a microbe that causes incompatibility in its host. Evolution 48: 909–911.
12. Turelli M (1994) Evolution of incompatibility-inducing microbes and their hosts. Evolution 48: 1500–1513.
13. Frank SA (1997) Cytoplasmic incompatibility and population structure. J Theoret Biol 184: 327–330.
14. Bordenstein SR, Werren JH (2000) DoWolbachiainfluence fecundity in
Nasonia vitripennis? Heredity 84: 54–62.
15. McGraw EA, Merritt DJ, Droller JN, O’Neill SL (2002)Wolbachiadenisty and
virulence attenuation after transfer into a novel host. Proc Natl Acad Sci U S A 99: 2918–2923.
16. Weeks AR, Reynolds KT, Hoffmann AA (2002)Wolbachiadynamics and host
effects: What has (and has not) been demonstrated? Trends Ecol Evol 17: 257–262.
17. Hoffmann AA, Clancy D, Duncan J (1996) Naturally-occurringWolbachia
infection inDrosophila simulansthat does not cause cytoplasmic
incompat-ibility. Heredity 76: 1–8.
18. Charlat S, Ballard JWO, Mercot H (2004) What maintains noncytoplasmic
incompatibility inducingWolbachiain their hosts: A case study from a
naturalDrosophila yakubapopulation. J Evol Biol 17: 322–330.
19. Vavre F, Girin C, Bouletreau M (1999) Phylogenetic status of a fecundity-enhancingWolbachiathat does not induce thelytoky inTrichogramma. Insect Mol Biol 8: 67–72.
20. Langworthy NG, Renz A, Macjenstedt U, Henkle-Duhrsen K, Bronsvoort MBD, et al. (2000) Macrofilaricidal activity of tetracycline against the filarial
nematodeOnchocerca ochengi:Elimination ofWolbachiaprecedes worm death
and suggests a dependent relationship. Proc R Soc Lond B Biol Sci 267: 1063–1069.
21. Dobson SL, Marsland EJ, Rattanadechakul W (2002) MutualisticWolbachia
infection inAedes albopictus:Accelerating cytoplasmic drive. Genetics 160: 1087–1094.
22. Fry AJ, Palmer MR, Rand DM (2004) Variable fitness effects ofWolbachia
infection inDrosophila melanogaster. Heredity 93: 379–389.
23. Ballard JWO (2004) Sequential evolution of a symbiont inferred from the host:WolbachiaandDrosophila simulans. Mol Biol Evol 21: 428–442. 24. Poinsot D, Mercot H (1997)Wolbachiainfection inDrosophila simulans:Does
the female host bear a physiological cost? Evolution 51: 180–186. 25. Sokal RR, Rohlf FJ (1995) Biometry: The principles and practice of statistics
in biological research, 3rd edition. New York: W. H. Freeman. 887 p. 26. Reynolds KT, Hoffmann AA (2002) Male age, host effects and the weak
expression or non-expression of cytoplasmic incompatibility inDrosophila
strains infected by maternally transmittedWolbachia. Genet Res 80: 79–87. 27. Hoffmann AA, Clancy DJ, Merton E (1994) Cytoplasmic incompatibility in Australian populations ofDrosophila melanogaster. Genetics 136: 993–999. 28. Hoffmann AA, Hercus M, Dagher H (1998) Population dynamics of the
Wolbachia infection causing cytoplasmic incompatibility in Drosophila melanogaster. Genetics 148: 221–231.
29. Rasgon JL, Scott TW (2003)Wolbachiaand cytoplasmic incompatibility in
the California Culex pipiens mosquito species complex: Parameter
estimates and infection dynamics in natural populations. Genetics 165: 2029–2038.
Figure 7.Time Required for a Favoured Variant to Spread
Number of generations required for a favoured variant to go from an initial frequency of 0.001 to a final frequency of 0.1 (long-dashed line), 0.5 (short-dashed line), or 0.9 (solid line) as a function of the intensity of selection,s,assuming equation 1.
30. Herre EA (1993) Population structure and the evolution of virulence in nematode parasites of fig wasps. Science 259: 1442–1445.
31. Clayton DH, Tompkins DM (1994) Ectoparasite virulence is linked to mode of transmission. Proc R Soc Lond B Biol Sci 256: 211–217.
32. Dale C, Plague GR, Wang B, Ochman H, Moran NA (2002) Type III secretion systems and the evolution of mutualistic endosymbionts. Proc Natl Acad Sci U S A 99: 12397–12402.
33. Bull JJ, Molineux IJ, Rice WR (1991) Selection of benevolence in a host-parasite system. Evolution 45: 875–882.
34. Anderson RM, May RM (1982) Coevolution of hosts and parasites. Parasitology 85: 411–426.
35. Bull JJ, Rice WR (1991) Distinguishing mechanisms for the evolution of co-operation. J Theoret Biol 49: 63–74.
36. Lipsitch M, Siller S, Nowak MA (1996) The evolution of virulence in pathogens with vertical and horizontal transmission. Evolution 50: 1729– 1741.
37. Fenner F, Myers K (1978) Myxoma virus and myxomatosis in retrospect: The first quarter century of a new disease. In: Kurstak E, Maramorosh K, editors. Viruses and Environment. New York: Academic Press. pp. 539–570. 38. Ewald PW (1994) Evolution of infectious disease. Oxford: Oxford University
Press. 298 p.
39. Stouthamer R, Luck RF (1993) Influence of microbe-associated
partheno-genesis on the fecundity ofTrichogramma deionandT. pretiosum. Entomol
Exp Appl 1993: 183–192.
40. Hoerauf A, Nissen-Pahle K, Schmetz C, Henkle-Duhrsen K, Blaxter ML, et al. (1999) Tetracycline therapy targets intracellular bacteria in the filarial
nematodeLitomosoides sigmodontisand results in filarial infertility. J Clin Invest 103: 11–17.
41. Dedeine F, Vavre F, Fleury F, Loppin B, Hochberg ME, et al. (2001)
Removing symbioticWolbachiabacteria specifically inhibits oogenesis in a
parasitic wasp. Proc Natl Acad Sci U S A 98: 6247–6252.
42. Olsen K, Reynolds KT, Hoffmann AA (2001) A field cage test of the effects of the endosymbiontWolbachiaonDrosophila melanogaster. Heredity 86: 731– 737.
43. Hornett EA, Charlat S, Duplouy AMR, Davies N, Roderick GK, et al. (2006) Evolution of male-killer suppression in a natural population. PLoS Biol 4: e283. doi:10.1371/journal.pbio.0040283
44. Gilchrist AS, Partridge L (2001) The contrasting genetic architecture of wing size and shape inDrosophila melanogaster. Heredity 86: 144–152. 45. O’Neill S, Giordano R, Colbert AME, Karr TL, Robertson HM (1992) 16S
rRNA phylogenetic analysis of the bacterial endosymbionts associated with cytoplasmic incompatibility in insects. Proc Natl Acad Sci U S A 89: 2699– 2702.
46. Zhou WG, Rousset F, O’Neill S (1998) Phylogeny and PCR-based
classifications ofWolbachiastrains usingwspgene sequences. Proc R Soc
Lond B Biol Sci 265: 509–515.
47. Lo N, Casiraghi M, Salati E, Bazzocchi C, Bandi C (2002) How many
Wolbachiasupergroups exist? Mol Biol Evol 19: 341–346.