FACULDADE DE ECONOMIA
UNIVERSIDADE NOVA DE
LIsBOA
Conflict in cross-functional teams:
a practical case analysis
!'Juno Fradique Vieira
Thesis presented as a partial requirement for the degree of Master of Business Administration
Table of contents ... 2
Acknowledgements ...3
Abstract... ... 4
1 Introduction... ... 5
2 Conceptual background ...6
2.1 Groups and teams ... 6
2.2 Variables that affect team dynamics ... 7
2.2.1 Efficacy, effectiveness or performance? ...8
2.2.2 Phases of group formation ... 14
2.2.3 Leadership and decision making ... 15
2.2.4 Conflict good or bad? ... 17
2.3 The special characteristics of CFT's ... 20
3 Methodology ... ... ... 22
3.1 Case description... 22
3.2 Data gathering and processing ... 24
4 Results ... 28
4.1 Efficacy and success ... 32
4.2 Team structure and phases of formation ... 33
4.3 Leadership and decisionmaking ... ... 34
4.4 Group conflicts ... ... 36
4.5 Goals and expectations ... 40
4.6 Class/culture dissimilarities MBAs versus Investigators ... 41
4.7 External factors ... 44
5 Discussion ... 47
5.1 Implications for future research ... 51
5.2 Implications for practice ... 52
5.3 Limitations of the study ... ... 53
6 Epilogue ... 55
References... ... 56
Attachment ... ... .. ... 58
Acknowledgements
I wish to thank all the people that helped me to put this work together.
First, I thank my advisor, Professor Rita Cunha, for her continuous support throughout my research. Professor Rita Cunha was always there to listen, give advice and encourage me to proceed. She reviewed the many drafts of this document, often during weekends so that on Monday mornings I could resume my work.
I am also indebted to all the COHITEC participants who kindly shared their views with me. In particular, I thank Dora Batista, Fifipe Mergulhao, Gabriel Lopes, Joao Pires da Silva, Joao Rato, Jose Bom, Jose Ferreira, LUIS Costa, Marcos Napoleao, Margarida Fortes, Nuno Correia, Pedro Coelho, Raquel Sousa, Ricardo Ferreira, Rui Gonc;alves, Tiago Ildefonso and Virgilio Loureiro for the long conversations that were the main source of data for this study.
I thank Pedro Vilarinho, from COTEC, who provided me with useful information about the COHITEC program and its participants.
I would also like to thank Claudia Grac;a and Valter Duarte, who thoroughly reviewed this document and offered valuable suggestions.
Besides those who had a direct contribution to this work, I am grateful to the University's staff. Specifically, I thank Ana Maria and Isabel Dias, for their support and words of encouragement, and all the library team, which assisted me in my bibliographic quest.
The present study is a qualitative analysis of the tensions that occur in crossfunctional teams (CFTs) and the way in which they can affect the teams' accomplishments.
The research is focused on a single case, COHTTEC 2005, a program aimed at transforming new technologies into businesses that took place in Lisbon, Portugal, starting March 2005. In this program, participants were organized in crossfunctional teams that included researchers and management students. Semistructured interviews were made to a sample of 17 participants. These interviews were recorded and transcribed. A table was then elaborated based on the primary data provided by the subjects and these data were classified in different categories.
A threestage model of group dynamics is proposed. The major findings of this project point to the role of interpersonal relationships on group outcomes. More specifically, several patterns associated with team malfunction were uncovered, the clearest ones being autocratic decisionmaking and arrogant behavior from some team members, as well as escalation in relationship conflict.
5
Introduction
1 Introduction
The motivation to develop the present study results from my participation in the COHITEC 2005 program that took place in lisbon, starting March 2005. This program is jointly organized by FEUNL (School of Economics and Business of Universidade Nova de lisboa), the University of North Carolina and COTEC (a Portuguese staterun organization devoted to foster technological development and entrepreneurship). The main goal of the program is to promote the creation of highgrowth startup companies based on new technologies developed in Portuguese universities.
The program involved several crossfunctional teams (CFTs), composed of investigators and MBA students or alumni. All participants had at least one university degree and several had PhDs or postdoctorates.
I was involved in the COHITEC 2005 program as a former MBA student. Throughout this experience, interesting and unexpected behaviors from participants were perceived. In some cases, personal conflicts among group members led to the team's collapse.
This was an intense experience, thus the motivation to delve deeper into the "team dynamics" topic, as part of the work for the MBA dissertation.
One goal of this research study is to analyze a specific case, where several crossfunctional teams were created, and to develop some theoretical propositions on CFT's dynamics, grounded on a qualitative methodology.
A second goal is to provide some practical recommendations, which can be used in future editions of the COHITEC program and maybe in other contexts, where CFT's are a basic work unit.
I started this study with no preliminary hypotheSis, besides my personal opinion (resulting from my participation in the program) that interpersonal relationships are a crucial factor in team success and playa key role in team accomplishments. Therefore, I decided to focus my study on a few variables, namely team structure, leadership and decisionmaking, goals and expectations, class differences and interpersonal conflict.
2 Conceptual background
2. 1
Groups and teams
Several definitions of "group" have been proposed, with a more or less extensive set of criteria like members "being involved in frequent interaction" or "feeling they share a common fate" Cunha et al (2003). However, one criterion appears to be of paramount importance: its members should have the perception of belonging to a group and external people also must regard them as such.
For example, Schein, 1980, cited by Cunha et ai, 2003, defined group as any number of people that: 1) experience mutual interaction; 2) are psychologically aware of each other and 3) have the perception of forming a group.
The organizational interest in groups and teams is associated with the role they have in company operations, despite their advantages and disadvantages. In a world where complexity and turbulence increased dramatically, and where the need for creative problem solving is largely felt by managers across functions and levels, being able to pool a diverse set of competences and information across the organizations is one of the instruments companies have to increase innovation and decision making in complex situations.
Among groups' advantages and disadvantages, we can emphasize the following (Cunha et ai, 2003):
Advantages
• The group approach is more effective in solVing new or complex problems;
• Often, problem resolution demands multiple skills that are more easily found in a group of people;
• Through the confrontation of different points of view, strengths and weaknesses of each proposal become more clear;
• New ideas are more likely to appear;
7
Conceptual background
Disadvantages
• Decisions usually take more time;
• Individual responsibility is diluted, leading to riskier decisions;
• Agreements are often based on "intermediate" compromise solutions, which may be worse than individual propositions.
Theoretically, groups and teams are different constructs. According to Katzenbach and Smith (1993), not every group is a team. "Committees, councils and task forces are not necessarily teams. Groups do not become teams simply because that is what someone calls them" (Katzenbach and Smith, 1993).
The same authors assert that a team is a number of people, as small as possible, but containing enough individuals with complementary skills to attain the desired objectives, joined together by common goals and mutual accountability.
Nevertheless, in this paper, I will not make this distinction and I will use the words "group" and "team" interchangeably.
2.2 Variables that affect team dynamics
Variables known to affect teams' dynamics are traditionally organized in one of the following threestage models:
• The input-process-output model (Hackman and Morris, 1975, cited by Denison et ai, 1996)
• The context-process-outcome model (Guzzo and Shea, 1993, Mowday and Sutton, 1993 and O'Reilly, 1991, cited by Denison et ai, 1996)
These models are very similar and the latter is usually considered as a variation of the former. They differ mostly in the way variables are arranged.
Inputs: Intragroup variables (dimension; members' characteristics; roles; standards; status; development stage; cohesion), task attributes and environmental variables.
Process: Required/emergent behaviors, leadership style, communications, contribution, influence, group atmosphere, task functions and maintenance functions.
Outputs: Productivity, performance, innovation, wellbeing, viability and member satisfaction.
For this study, I picked a subset of variables which, given the observations made during my participation in the program, I believed were the most relevant to explain teams' achievements and failures. Next I will skim through these variables and present alternative definitions to some of them. I will also make some changes to the abovementioned model and introduce a new dimension which I named team value.
2.2.1 Efficacy, effectiveness or performance?
Traditional definitions and models
Besides the definition of groups and their advantages and disadvantages, organizations (and researchers alike) obviously have a special attention to pay to the outputs of group work. There appears to be no consensus, in traditional literature, about the meaning of the words "efficacy", "effectiveness", "efficiency", "productivity" and "performance". Each author, depending on his/her theoretical positioning, presents a set of definitions, descriptions and measurement criteria and techniques. Sometimes, "efficacy" includes dimensions as "member wellbeing" and "future team viability". Other times, it is only based on tangible variables like quantity/quality of the group's outputs and speed of execution. Some authors (Hackman, 1987, cited by Pescosolido, 2003; West et ai, 1998, cited by Cunha et ai, 2003) believe that "performance" is one dimension of "efficacy". Others (De Dreu and Weingart, 2003) say it's the other way around. Others, yet, like Bettenhausen (1991), discuss group performance and group effectiveness without ever providing an explicit definition of these concepts.
Next, I present a brief review of definitions and evaluation techniques as proposed by established authors.
Hackman (1990) cited by Pescosolido (2003) proposes three dimenSions of group
9 Conceptual background
1. Productive output: the degree to which the group's output meets the standards of those that receive or use it;
2. Capability to work interdependently: the degree to which the group's members are able to work together in the future;
3. Growth and wellbeing of members: the degree to which the experience of being in the group enhanced the individual members through their own personal learning or development.
According to this model, the group that performs its assigned task well but is not able to work together in the future is not a truly effective group. Some years later, Hackman would summarize his views about group performance in the following way (Hackman, 2004):
My simple three-item checklist for assessing how well a team is doing is: are the clients happy?
Is the team getting stronger as a performing unit over time? And, do the individual members
of the team find in their work more learning and fulfillment than they do frustration?
DeeterSchmelz et al (2002) maintain that the variables comprising effectiveness can vary, depending on the context and the types of teams being studied. Regarding student teams, they believe two variables seem most representative of effectiveness: task performance
(external evaluation of teamproduced outputs) and goal achievement (the extent to which team members believe they have realized their set goals).
In Jehn (1995)'s study, group performance refers to the degree to which the product or service of the group meets the standards of the organization as rated by the group's superior and by the group's productivity records. Member's performance is the degree to which the member meets the standards of the group and organization as rated by the group's, superior, company performance evaluation and individual productivity records.
West et al (1998) cited by Cunha et al (2003) propose that efficacy comprises four dimensions: productivity, group viability, individual wellbeing and innovation.
De Dreu and Beersma (2005) merge two of the abovementioned concepts when they state that "relationship conflict reduces effectiveness of performance".
According to De Dreu and Weingart (2003), most studies provide an objective team performance measure or ratings by supervisors. Among others, decision quality, product quality and production quantity have been used as measurement criteria.
For example, in a field study with teams of MBA students, Jehn and Mannix (2001) measured performance by using the ratings of the teams' final project reports. Scores were given by two independent raters.
In another study, Jehn (1995) measured group performance by using departmental records provided and standardized by the firm and by supervisors' ratings of the groups. The standards incorporated productivity and error rate.
In a study based on a realistic simulation of business life (where a number of fictitious companies, represented by the various teams, compete in a common business environment), Passos and Caetano (2005) used the final share price obtained by each team to assess team performance. The share price reflects the results obtained by each team and the general financial condition of the company. Higher scores indicated better performance.
In yet another study, De Dreu and Van Vianen (2001) asked teams' supervisors to rate the group using fivepOint scales, on five questions about different aspects of effectiveness.
Proposed definitions and model
As we have seen, the constructs of "efficacy", "effectiveness" and "performance" are ubiquitous in today's literature on team dynamiCS. Given the utmost importance of these concepts, I believe unambiguous and wideranging definitions should be created. Next, I will try to come up with a consistent set of definitions that are:
• Exact, extenSive, measurable and comparable;
• Similar to the meanings usually assigned to them in current language and literature.
conceptual background 11
Efficacy or effectiveness: the capability to achieve measurable goals (outputs)
efficacy
=
effectiveness
=
outputs / expected outputs
Efficiency or productivity: the capability to produce a given quantity of outputs by using the minimum possible amount of available inputs (time, money, people, materials, energy, etc)
efficiency
productivity
=
outputs / inputs
For example, if:
• Team A used 6 input units to produce 11 of the expected 20 output units;
• Team B used 5 input units to produce 10 of the expected 20 output units.
Then, by using the abovementioned definitions, team A was more effective and team B was more efficient.
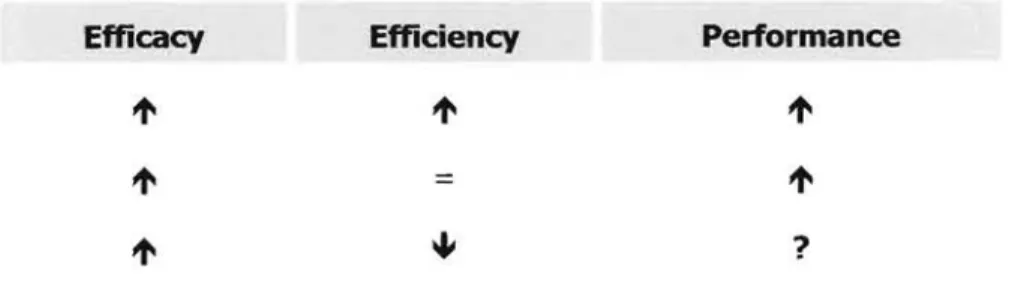
Performance: given the two previous definitions, I believe the concept of "performance" becomes redundant and should not be employed; however, given its generalized use in literature and in common language, I suggest the following definition:
perfonnance
efficacy
+
efficiency
Table 1 - Evolution of Perfonnance based on the evolutions of Efficacy and Efficiency
Efficacy Efficiency Performance
=
?
Of course, if the two components fluctuate in opposite directions but one of the components is clearly dominant, performance variation can be evaluated. For example, in a heart surgery situation, efficacy (patient's survival) clearly outweighs effiCiency (duration of the surgical procedure, cost of materials, number of surgeons), therefore performance will depend almost exclusively on the former.
I will now introduce the word ''valuell to describe the dimension that puts together the notion of "efficiencyll, "efficacyll, "future viabilityll, "member satisfaction" and "external satisfaction", like peer and management opinion about the group. The following equation represents the qualitative relationships among these variables:
value
=
efficacy
+
efficiency
+
viability
+
satisfaction (int) +
satisfaction (ext)
\ I \ I
V v
tangible intangible
This model's novelty has to do with the separation of tangible and intangible variables into distinct clusters, and the introduction of team value, a more encompassing variable that puts together the abovementioned clusters.
Conceptual background 13
. PERFORMANCE
-I \
I I
I I
'+----
L ___ _I I
I
I I I I I I I I I I 1 I I I I I I
:::::~:
TANGIBLE VARIABLES + INTANGIBLE VARIABLES = VALUE
Figure 1 - The value-model
Regarding this proposed model, the following aspects should be noted:
• Variables like product quality, error rate, innovation and the organization standards mentioned by Hackman (1990), cited by Pescosolido (2003), will be included in the "expected outputs".
• Variables like management evaluation, peer opinion and customer satisfaction will be included in "external satisfaction".
• All the other variables traditionally included in the inputs and process stages remain the same.
• Comparison of two "values" is subject to the same restrictions as comparison of two "performances".
Naturally, the model allows for reciprocal interdependency (represented by dashed arrows) between intangible variables like "member satisfaction" and tangible variables like "efficiency" and "efficacy". However, an increase in one of these intangible variables (for example, member satisfaction) will not necessarily affect team efficacy or team effiCiency. But it will
The very own nature of some projects (we will see that COHITEC is one of them) implies that, sometimes, tangible dimensions are identical across different teams and, therefore, cannot be used to differentiate them. In order to compare team value, one must bring into play some intangible variables.
Often, team members and their peers are correctly aware of how successful a team is. Members' perception of success includes a feeling of accomplishment; on the other hand, perception of failure is usually associated with a sentiment of dismay. I will use this approach later on, when an evaluation of the COHITEC's teams value needs to be carried out.
2.2.2 Phases of group formation
Tuckman (1965) proposed that small group development could be structured in four stages that he named "Forming", "Storming", "Norming" and "Performing". His model was updated in 1977 with a fifth stage, "Adjourning". Although his model became famous and has survived for more than 30 years, it is nowadays considered as being too simplistic.
In two consecutive papers, Gersick (1988, 1989) suggested that groups do not develop in a universal sequence of activities or stages. She proposed a punctuated equilibrium model
of group development, where "groups' progress was triggered more by members' awareness of time and deadlines than by completion of an absolute amount of work in a specific developmental stage" (Gersick, 1988). Thus, periods of inertia alternated with periods of revolution.
Conceptual background 15
2.2.3 Leadership and decision making
In the literature, team leadership has been believed to playa critical role on team functioning (Hackman, 1987, cited by Denison et ai, 1996). House (2004) defines "leadership" as "the ability of an individual to influence, motivate, and enable others to contribute toward the success of the organizations of which they are members".
More specifically, a leader can help a team perform by defining tasks, allocating people, keeping track of deadlines, motivating the team, resolving disputes, ensuring the contribution of all members by avoiding "freeriding", promoting communication inside and outside the team, etc.
Some of the leader's powers are delegated by the organization and include the authority to punish and reward. Others are intrinsic to the leader and include charisma and knowledge.
Despite the multiplicity of books and papers published on this subject, there isn't a consensual definition of the "leadership" concept, boundaries between leadership and management are fuzzy and there isn't a definitive set of rules on how to be a capable leader. However, it is clear that: leaders do affect the organization; some personal traits, skills and behaviors add to the success of an individual as a leader; leadership is a process that involves leaders, followers and situations; leadership skills can be learned and improved (based on Cunha et ai, 2003).
Traditional models of leadership can be structured according to three different approaches, based on trait, behavior and situation. These approaches are explained below:
Trait approach
Trait approach is based on the notion that successful leaders have unique personality qualities. Cunha et al (2003) describe seven traits and three broad types of competencies that contribute to leaders' success:
Traits: high energy level and stress tolerance; selfconfidence; strong internal "locus of control" orientation; emotional maturity; honesty and integrity; high achievement orientation; socialized power motivation.
Although once popular, this approach is controversial.
Behavioral approach
The behavioral approach is based on the concept of how a leader conducts himself or herself. Two broad categories of behaviors have been defined:
Production/task centered behavior: the leader pays close attention to the work of subordinates, explains work procedures, and is enthusiastic about performance.
People/relationships centered behavior: the leader is interested in developing a cohesive work group and in promoting team harmony.
From the combination of these two dimensions, Blake and Mouton (1964), cited by Cunha et al (2003) identified five essential management styles, that can be organized in a matrix, also known as "The Managerial Grid".
Also, according to the functional leadership model, leadership is based not on an individual but rather on a set of behaviors that help teams attain their goals. Any member can perform these functions and therefore partiCipate in leadership.
Situational/contingency approach
The Situational/contingency approach is based on the principle that there is no "best leadership style" and that effective and successful leadership depends on the relationship between organizational situations and leadership styles. Therefore, several models were developed to identify which leadership styles will be most effective under specific conditions.
For example, Fiedler'S situational theory identifies effective leadership styles under changing situations (Fiedler, 1967, 1970, cited by Cunha et ai, 2003). In Redler's model, leadership effectiveness (group success) is a result of interaction between the style of leadership and the favorableness of the environment.
conceptual background 17
eventually lead him/her to a recommended decisionmaking type, stating how much involvement team members should have in the decision. (Cunha et ai, 2003; Vroom, 2000). According to Vroom (2000), "people do support what they help to build. Under a wide range of conditions, increasing participation leads to greater "buyin," commitment to decisions, and motivation to implement them effectively".
In the path-goal theory of leadership, developed by House and Mitchell, leaders will guide team members on their way toward objectives, remove obstacles and manage their rewards. The weight that the leader grants to each of these factors will define one of four styles of leadership: directive, supportive, participative and achievementoriented. These four leadership styles are fluid and, consequently, leaders can adopt any of them according to the situation needs. (House and Mitchell, 1974 cited by Cunha et ai, 2003).
The abovementioned models, and many others, assume that there is a leader. But what if the leader is not well defined in the first place?
On the subject of selfmanaged teams, Hackman, J. (2004) said:
A "truly self-managed performing unit:' is one where the team as a whole has responsibility not just for doing work, but also for monitoring and managing how that work gets done. In a
self-managing team there is scope for all members to partiCipate in accomplishing the cntical leadership functions.
[ ..} If the leadership "wheer can rest on multiple shoulders, so much better. This increases the
chances that the group will be effective in monitoring its environment and any changes in this, and in assessing how it is doing internally, and where corrections need to be made. It will then be more likely to develop and refine a performance strategy that is well attuned to requirements.
[ ..}I am not saying that shared leadership is what defines a self-managing team. What defines it
is the amount ofauthority it has for managing and monitoring its own performance.
2.2.4 Conflict - good or bad?
One of the many process factors affecting group value is intra-group conflict. De Dreu and Weingart (2003) define intragroup conflict as "the process resulting from tension between team members due to real or perceived differences".
Task conflict, or cognitive conflict, is a perception of divergence among team members about the content of their decisions and involves differences of opinions, ideas and viewpoints. Relationship conflict, or emotional conflict, is a perception of interpersonal incompatibility and typically includes tension, irritation and hostility among team members (Passos and Caetano, 2005).
Another important aspect related to the impact of conflict on teams' ability to perform is the tendency to have escalation. Conflict escalation occurs when there is an increase in the level or intenSity of the conflict, as time goes by.
Cunha et al (2003) describe three phases and nine stages that range from a slight tenSion, caused by different points of view (but still in a rational and controlled atmosphere) to an utterly irrational final stage where the destruction of the opponent is sought after, even at the cost of selfdestruction.
Pruitt et al (1994), cited by Maiese (2003), describe three broad models of escalation: the aggressordefender model, the conflictspiral model and the structuralchange model. These models are described in more detail below:
Aggressor-defender One of the parties, "the aggressor" starts with soft tactics and moves on to heavier tactics if these don't work. The other party, "the defender", reacts proportionally to the aggressor attack. This model suggests that escalation moves simply in one direction, with the defender always reacting to the action of the aggressor.
Conflict-spiral This model describes conflict escalation as a vicious circle of action and reaction. Each reaction is stronger than the action that instigates it, and, therefore, both action and reaction grow in intenSity and severity. Also, conflict issues proliferate quickly.
Structural-change - According to this model, the conflict process produces "residues" that affect and enduringly change the parties involved. As the fight goes on, conflict moves away from the actual issues that originated it. Permanent psychological changes in the involved parties explain conflict persistence and recurrence.
Conceptual background 19
It has been stated that moderately intense conflict can also increase team performance (in its traditional sense) and quality of decisions (Cunha et ai, 2003). However, one study by De Dreu and Weingart (2003) maintains that for team performance, both task conflict and relationship conflict are equally disruptive. They state that "whereas a little conflict may be beneficial, such positive effects quickly break down as conflict becomes more intense, cognitive load increases, information processing is impeded, and team performance suffers." (De Dreu and Weingart, 2003).
Jehn (1997) cited by Passos and Caetano (2005), introduced a new type of conflict: process conflict, a disagreement over how things should be made, including task distribution among team members. However, there is no consensus among authors on whether process conflict has a positive or negative impact on teams.
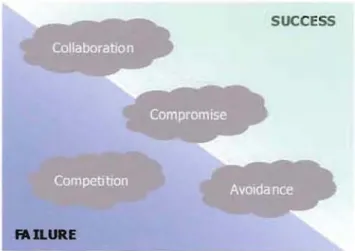
Conflict management strategies
Based on the combination of two dimensions (deSire to satisfy one's interests versus desire to satisfy other's interests), Cunha et al (2003) describe five individual strategies of conflict management: aVOidance, accommodation, competition, compromise and collaboration. They are graphically represented in Figure 2 and described in more detail below.
W ~ to satisfy
own needs
l>-!
II!'"
C!"
til Competition Collaboration
Compromise
Avoidance Accommodation
. . Win to satisfy
Uncooperative Cooperative others' ne eds
Figure 2 - Strategies of conflict management
important, time is short, or the relationship with the other party is not important. However, this strategy can foster conflict escalation and retaliation.
Accommodation (no assertiveness, cooperation) Allows the other part's interests to be met at the expense of one's own interests. It can be useful to preserve the relationship, if used occaSionally or if the issue is unimportant. However, being too accommodating or using this strategy too often can undermine one's credibility in future decisions.
Collaboration (assertiveness, cooperation) This is the most integrative solution of all, where the parties share their inner needs, explore alternative solutions that satisfy everyone and search for ways of increasing the "size of the cake" before dividing it. It should be used when issues are important to all, when there is a high level of trust, when someone wants the others to also have "ownership" of solutions or when the parties are willing to change their thinking as new options are suggested. However, this process can take a lot of time and energy, and it requires specific skills.
Compromise (some assertiveness, some cooperation) Compromise is a less integrative strategy than collaboration and it lays between competition and accommodation. Each party gives up certain aspects in order to gain elsewhere. This strategy is useful if there isn't much time available, goals are moderately important, or one party cannot impose the solution in a competitive way. However, important values and longterm goals can be disregarded.
Avoidance (no assertiveness, no cooperation) Issues are ignored and conflict is avoided by withdrawing, Sidestepping, or postponing. It may be used when the conflict is small and relationships are at stake, but may make matters worse and is not a useful long term conflict management strategy.
The type of conflict management used by the members of the CFrs is one of the variables that were analyzed in the interviews.
2.3 The special characteristics
of
eFT's
Conceptual background 2,1
There are many types of CFTs, but most are task teams, formed to accomplish specific tasks in a limited timespan, comprising members from distinct organizational functions (and sometimes, as in the present case, from different organizations as well). They are integrative and often creative, thus conventional analysis using traditional variables such as efficiency, team cohesion and member satisfaction may be too narrowly focused
(Denison et ai, 1996).
Donnellon (1995), cited by Denison et al (1996), suggests that CFTs are often "coactingfl work groups composed of independent, highly competitive individuals who pursue their own goals over those of the teams.
Webber (2002) supports the abovementioned theories by stating that CFTs pose a variety of unique challenges. She points out three distinctive aspects of CFTs: members, despite working together, have quite different goals and values; people sometimes work on multiple teams Simultaneously, resulting in differential time allocation to the team; and individuals are often subject to multiple reporting, for example to a team leader and to a functional manager.
Regarding leadership, sometimes CFTs function as self-directed teams, responding to broad objectives, but not to specific directives. Decision-making may depend on consensus or, more often, be performed by a leader. Also, power can be shared equally on all issues, or a rotating leadership can be used.
In short, we have seen that traditional theories and models are mostly focused on traditional groups, with long durations, distinct phases of development, single lines of reporting, well-defined methods of decision-making and easily measurable results. CFTs are spreading quickly across organizations, but empirical research on this type of teams - which display a set of particular characteristics - is lagging behind their rate of adoption (Knight, 1976, cited by Denison et ai, 1996).
My partiCipation in the COHITEC 2005 program, where I was faced with high levels of conflict, clashes among participants who pursued individual goals and, ultimately, failure, presented the opportunity to perform the present study and shed some light on the dynamiCS of CFTs.
3 Methodology
3.
1
Case description
Several studies have shown that knowledge generated in Portuguese academic research environments is growing, but is not having a significant impact on the economy. Therefore, programs that stimulate the conversion of technologies into businesses are needed.
The COHTTEC initiative is a cooperation project among universities, financial institutions and managers, meant to promote value creation from knowledge developed at Portuguese universities, by founding technological start-ups with high-growth potential.
Teams include researchers from Portuguese universities, managers and management students, and business executives. Venture capitalists and entrepreneurship tutors also work closely with the teams.
Each team analyzes a set of technologies, developed in participant investigators' research centers, and, building on its members' complementary skills, must produce a viable business plan.
Involved parties:
Several organizations, Portuguese and American, have contributed to this project by supplying coordinating capabilities, entrepreneurial know-how, new technologies, technological people, management people, physical facilities and money. Specifically:
• COTEC is a not-for-profit Portuguese organization committed to promote entrepreneurial development. COTEC was the main organizer of the COHTTEC program and has contributed with logistic and coordinating support.
• University of North Carolina provided know-how and a self-developed methodology for technology assessment and startup creation. It has contributed with teaching personnel and training materials.
Methodology 23
• Several technological universities provided the technologies and some of the researchers involved in their development.
• Several Portuguese companies also participated as sponsors and provided some of their top managers to coach the teams on an occasional basis.
Team formation and structure:
Technologies and their corresponding development teams were initially selected by COTEC from a pool of applications submitted by Portuguese universities. To each team, one or more MBA students or alumni from Universidade Nova de Lisboa (UNL) were allocated.
Each team consisted of:
• One or more subgroups of investigators from one or more universities, each contributing with one or more technologies;
• One or more MBA students or alumni from UNL;
• One "tutor", consisting of a top-manager from one of the sponsor companies (not involved in the teams on a permanent basis).
The participants' background diversity in each team is also reflected in the participants' motivations. As such,
• Investigators participation was suggested by their university's management. As we will later see, some investigators were pressed to partiCipate by the top levels of the academic hierarchy;
• MBA students would partiCipate on a volunteer basis. As compensation, they would get curricular credits depending on the assessment of their accomplishments;
• MBAs (alumni from UNL) were invited to participate as volunteers, with no compensation (besides what they would be able to learn from their participation).
In this paper, I will use the acronym MBA to deSignate both MBAs and MBA students.
Timeframe
The COHITEC 2005 program can be divided in two main phases.
some business potential, in order to select those that were indeed viable. Most of the work performed during this stage consisted of eliminating unfeasible or flawed technologies and producing sound business plans for the remaining ones, that were to be presented on the final public session.
Phase 2 started a short time after the aforementioned presentation and is still taking place. In Phase 2, teams that reached the end of Phase 1 (not all of them did) were to find investors, set up a management team and officially create the company.
The present study was initially planned to cover only Phase 1. But early results from the interviews' analysis suggested that it might be interesting to include also the initial period of Phase 2. Therefore, some results from Phase 2 were also included, whenever they were available.
Seven teams were initially formed and six of them reached the end of Phase 1. After the end of Phase 1, all teams eventually split apart and MBA's left. This separation process was swift for some teams (for example, teams B and D) and gradual for others (for example, team A). In each team, the remaining investigators continued into Phase 2, either alone or with some new members proposed by COTEC.
3.2 Data gathering and processing
In a similar study, Denison et al (1996) proposed a two staged methodology where: first, informal interviews with a small sample of people were conducted and potentially interesting issues were raised; second, complete questionnaires, based on these issues, were designed and applied to larger samples. The second stage was done in a recurring and iterative way, so that a refinement process could take place. (Denison et ai, 1996)
In this research, a decision was made to perform only one round of interviews. Therefore, an interview script was developed to be as wide-ranging as possible, trying to encompass many of the putative problems/variables that affect team dynamics.
The interviews had closed-end questions, e.g. "Was there a formal team-leader?" and open-ended questions, like "Please describe a conflict situation in your group". The script was divided into five broad sections: team structure; decision making; conflicts; goals; and comparison with other teams (both in the same project and in the past).
Methodology 25
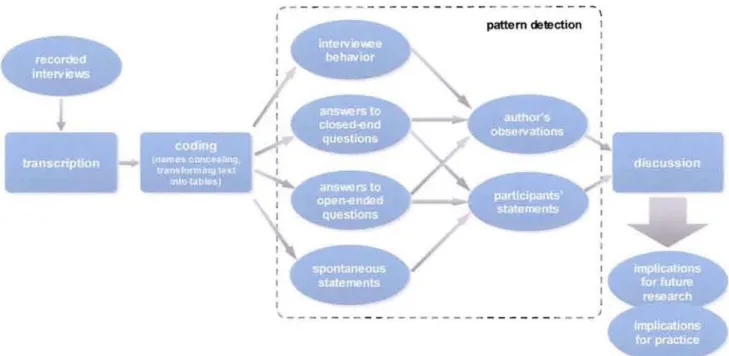
All interviews were recorded and transcribed. They allowed for more spontaneous answers than a questionnaire would and permitted the analysis of the interviewee's behavior during the interview, like "style of language", nervousness, hesitations and, especially, change of opinions during the course of the interview (that was an unexpected result of this study).
Despite having a few "closed" questions, I tried to make the interviews as "conversation-like" as possible, so that the respondents would feel free to talk about issues that I had not previously thought of. There was great care not to "bring the interviewee back to the subject", even when the answer shifted away from the main topic (which occurred quite often). This led to a few unanswered questions in the final data.
It is worthwhile noting that, despite allowing for "new issues" to come up, this approach is more time-consuming and leads to a harder answer systematization process.
All the teams that reached the end of Phase 1 (six out of seven) were analyzed. In each team, at least one MBA and one investigator were interviewed and interviewees were selected based on the following criteria: availability; relevant role in the group (members that had little participation in the daily work were not considered); functional balance (the initial
MBAs/investigators ratio was maintained in the sample); gender balance (the initial
male/female ratio was maintained in the sample). All participants had at least one university degree and several had PhDs or post-doctorates. The age range was quite wide (approximately 25 to 60) but the exact ages are not known. In the end, 17 interviews were performed, with an average duration of one hour and fifteen minutes.
The following table presents a comparison among the percentages of people that were selected to participate, those who reached the end of Phase 1 and those belonging to this study's sample, divided by gender and function.
Table 2 - Percentage of interviewees per gender and per function
Reached the
Applications Sample
end of Phase 1
MBAs 33% 41 % 47%
Investigators 67% 59% 53 %
Males 71 % 76% 82%
The interview phase started six months after the events and lasted for two months. All the interviews were carried out in Portuguese language (only the quotations made in this text were translated to English).
As previously mentioned, the interviews were recorded and the subsequent transcription was made as accurately as possible, including pauses, hesitations and slang use, so that language type could be used as a dimension in the analysis.
Subsequently, the text from the transcripts was broken up into "semantic units" (answers, spontaneous statements, etc) and organized into a master table.
Also, a section covering participant's behavior/language during the interview, as seen from the interviewer's perspective, was included. Six variables were considered: use of slang words; use of emotive statements (not to be confused with reasoned descriptions of emotional behaviors during the project); use of racist, sexist or depreciative expressions; frequent use of "us" and "them"; how investigators refer to MBAs and how MBAs refer to investigators; effort
in articulating clear and concise answers to the interviewer's questions.
Next, relevant data from the master table was summarized into smaller tables, with different types of organization. Data that was considered irrelevant to this study was discarded.
Finally, results were visually inspected and patterns were identified and highlighted.
To ensure the anonymity of the project partiCipants, all the names in the transcripts were replaced by a four characters code. Since interviewees sometimes referred to people external to the teams, it was necessary to code their names as well. The meaning of each character is as follows:
1st
: Team [A-F] or Organization [0]
2nd : Intra-group sequential number [1-9]
3rd : Function [I: lnvestigator / G: manager (MBA) / P: Qrincipal / S: ~taff]
4th: Gender [M: male / F: female]
Examples:
C2(IF) -Team C; #2; investigator; female
01(PM) - Organization; #1; principal; male
Methodology 27
The following diagram sums up the data processing workflow:
,
-pattern detection
4 Results
The next three tables summarize the most relevant results. These tables derive from the master table that was developed from the transcripts, with all the data from the interviews.
Table 3 has the data that concerns the teams, as a unit of analysis. It includes results on perceptions of efficacy and success, structure, leadership and deciSion-making, attitude, conflicts and goals. Table 4 and Table 5 hold the data that concern team members, arranged, respectively, by team and by function. They include results on expectations, class differences, and interviewee behavior.
Initially, I had planned to study only Phase 1, but interviews' analysiS suggested that it might be interesting to include data from Phase 2, as well, in the research. Unfortunately, information from this second phase was not available for all the teams. Therefore I have decided to include results from Phase 2 only for team E, which revealed totally different structures, processes and results in each of the program phases. More specifically, relationship conflict showed up during Phase 2, after a new investigator joined the group.
Phese 1
I...
"r--
Pheso 2 -..jTeams: A B
l
c 0 E1 F E2,Emcacy and success
Wes considered a success by salfs and others ~ no no no no
G0
noWas considered a learn failure by salfs and others no
~
~
no no no~
Tearn structure
There were group structure changes no no yos yo. yos yes
Participants showed confusion aboulleam's structure and
no no yos yos yos yos
number of members
l
There were investigators' subgroups no yes yos no yo. yes
leadership and decision m.klng
There was a formally elecled te8m leader yes yo. yo . yo. yos yes N/A -I
Q/
Members ag reed on who the -the facto" 19am leader Was 110 yos y•• no no no no cr
There was a "de facto · team-leader yes no ii"
Decisions were taken moslly by discussion and consensus yes
~
yes ~ yeo yes ~ W;a
Attltudo ~
Arrogance (investigators) no
~
no~
no no~
CArrogance (MBA) no no no yes no no NlA
i1
"C
/D
Conflicts ~
Task conflict s yes yo. yes os
i
Q/
Rela tion ship conflicts no no no
~
3
Conflict escalalion no no no
Conflicts' respon sibility is attribuled to a sin gle, problematic.
no c : ; ; ) no no
person
Goals
There was a common goal. beyond producing the final
no no no no no
presentation
~
~
There were personal goals
OUH~rs
Teams with forced participation members no no vo. /lO vo. no
External irri\uences I hier;rchies
Int electual property problems y•• y o. y•• yo. fa., J 1
J
Success IAverage [ JFailure~
~
~
A slron g Iseder is good? no Y" yeo Y" yas Y83 l " yas l " yas
Expe c1:lulODS
Dl
~~9~ i;;~ ~ I,;: P ocla t jo n$ folloVlGd ( yes Ie. ~ el l OS ~IIS le. l"! xes r" i!! l " )! 8S lOS l ils ~ . ) C'
1D
Goals
Per eDna I goate changed ( ? 18 11 ~u:t I SS l ea 188 xes l eEi
...
) ,floConOitts ;1::1
~
.. comp.'. compeli
m
Conniel manag emoO! slyls (.omprum Clvold, 'lollabo' co1r.OOr ( c:::f~ .t. ~ conlpel. ) c:o mpfOlII "vOid. avolfJ. avoid. ayohl. c[!lIabor avoid. comprom avohJ CUnIl'''''') C
ii
Class
differences 'C
Forced participat ion no n, yes no Y" Y" Y"" Y" (1)
..,
9 10 5 work hours y·, " no l OS l " yas yas yea yes
Poor projecl manag8men1 skills yes no yss no no yes yeo ? ? no 3
Poor Bocial skills Y" Y"" yes y.' y.. Y" yas yo. (1)
Poor global vieion Y" yll yas Y" y" ? y fl ~ ? 3
i
bmgulJg8 alllJ
attitude .:"
(IntBrvlewt Ie
Usa of glen g yu y.' y·' y..
Displa y of emOlional behavior ~·"" .yes "
)__ - - - _______ - - - --;- ___ •
~a
dunng im eMeY'J ~
CV
CUsa of racial, se xist Of
deprec iative laoguag e ~ .~ ~
I
frequenl use of US and THEM ( Y" yeo yes ye. yeo Y" VOl Y" y • • V" yas y•• y.. yeo yes )
C' <
,--.
II;,., ,, ~OI .. I I" C ~ ~ ilf ~...
_
-.
.
~~ orsHow MBAtI COl . ' ,V881igalols ifl lr c~.QlII! (J' t .., ~ n 1 1(J41 ...~ scMftlsn
~ «111, -$ o; ~ ~ J( J IKtn olOl1s 15
i
How MBAs call MBA9 .- ""
..
/....
"'"
"'., ....,A., rfflAt 11.1"'''
How 1rM>5tie9tof9 ca ll l ~ : tt ! t'/I'tH!~ $
~S1IQI!II'(J" 1 tlVnUgooCol1: to::ctY'aOgl lt8~ W'I ~ $1 tJM( n ~ o ..-s I=~ ~ ~ estlg.:lll)r~ ~~ rw,.,'JrQfC':"" 3
invo sllgatori
,--,
,_.
-.
-.
...
"",.
How inVQsl igsl O{S call MBAlJ rABAF MEl AAI Jr ~ /.• J:l(p...
'"'"
Display of dlmcully in 1IIIcoiaiing
ya. y.' y••
c l .~ r ilnd coneiso an SIIlWer9
JSUCC". ~ Av.rag. L - - J Faliur.
=-:,
~
;.
~
••
-Members: A1(G/.1) D1(G~1) D7.(G/.1) C1 (G M) D1(GM) D2(GI.1) E1(GM) F1(GM) A2(1~1) 83(IM) C2(IFJ 03( 1f ~) 04(1M) E2(IF) E3~FJ F2~M) F3(IM)
Leadership and decision making
A sirong leadsr [0 gooo? no yes
,
..
yes Y·8 yes y.. no yes yes no y"Expectations
High inihal oxpec!alion6 followed
,,,
,,,
yes y.. yos
..
••
Y" 'os •• y· 'by frustration
Goals
Personal goats changed ( ~ Y" yo. yo. yos y•• yes y.. ? J
ConRlcts
Confllc\ managemont &lyle comprom collabor collabor. compeL comprom canaber ~C ~ !) C ~ S ~ ~ ~ @D Co mprom.
avoid. IIVO . avo .
Class dlffe,onces
Forced part icipation no no no no G!:) G!!:) G!!:)
"
9 to 5 wurk hours no no ~ no G!!::>~~~ no
Poor project management skills no no G!::>
§§
GD8;S
? ?no
Poor socia l skills no no
82 ..
8r3ffi
G0~
os
Poor global VIsion no no yos os 85 85 ~ ? yes
language alld a«ltudo (interview)
USB of slang yes yo, yas yo.
Display of emotional behavior
yo. y.. yas
dunng inlBM8w
Use of racist , sexist or
yo. yas yas yo.
depreciative language
Fre quent use o1US end THEM ( yo. yo. yo. y.' ya. y.. yo. yo. yes ye. y.. yo. yo. )
Ho... M8As call investigators
technl:bJisll
I r = s .-w-~ ::: I n:~:1 nvoftioMorahvesllgllotl
weltl$ls,."
~..
",."""
-How M8As call MBAs MBA.
...
MBA...."
..,.,
...
~"""
How investlgalors call
lectnoIoQIsts lr,yortig.MOI'S Lrtvest~or~ r."es !~o r s ICChnologbt.a .wOstlgMOI'S ~Ige(O(s
=:
I n ".ost~!t17"inves tig alors
MeAs
"".,
""
...
"'lA, MBA. MBAsHow investi ga10rs call M8.A.s
econorrists
,
_.
""'" Display of difficutty in anlculalingyo. yes yas
d ea' and concls a arUfl!Jl'8rs ~~ - ~~
--Q}
C"tD
VI~
cit
j..,
3 tD 3g
.....,
Iea
"[
cThe major results from the research project will now be divided by theme, to make the presentation more understandable.
4.1 Efficacy and success
In this study, there are not many measurable variables we can use to assess and compare team efficacy and team efficiency. All the six teams that reached the end of Phase 1 have produced roughly the same deliverables, including a business plan and a public presentation, in the same time period. Also, regarding team continuity and future viability, all the teams split up after the end of Phase 1, although for different reasons.
However, by looking at participants' statements, it appears that there is a somewhat subjective feeling of success or failure, both by team-members and by external people. As I stated in section 2.2.1, intangible variables like people's perception of success can be used to assess team value, as long as tangible variables like efficiency and efficacy are constant across teams.
Thus, before we can start asking why some groups were successful and others were not, we need to define success and failure, in the scope of this study.
Failure includes a sense of disappointment, a sense of wasted time and group dismemberment before the end of the project. As one of the participants stated,
Fl(GM) [talking about team
Xl
-
At some poin~ [ . .] there were fights, scream~ totalhysteria.. . the group broke up and it was over.
Refusal to participate in another project with the same team, as shown in the following excerpt, is also considered a sign of failure:
Interviewer -If you had to work with them again, how would you try to overcome the
conflicts? Dl(GM) -I would never work with them again!
Last but not least, one common characteristic of failed groups is the perception, by both its members and external people, that the team was unsuccessful. For example, one participant said:
Fl(GM) -I noticed those who were clearly the worst - group D. And there was another
Results
33
Success, in the context of this project, is characterized by a feeling of accomplishment, of a job well done; both team members and external people regard the group as successful, as we can see in the following statement:
Al(GM) - [.J I felt that we were probably the best team.
According to the abovementioned criteria, groups A and F were considered as successful; groups B, D and E2 were considered as failed. The remaining teams were considered as
average.
The only group that didn't make it to the end of Phase 1 (group X) is also an obvious example of failure. However, its members could not be reached for interviews, and so it was not included in this study.
4.2 Team structure and phases
of
formation
Several teams could not be plainly divided into merely MBAs' and investigators' subgroups. On the contrary, they had a number of subgroups, even in the investigators' side, as mentioned by one investigator from a successful team:
F3(IM) - This was not a homogeneous team. There were three different universities.
There were three distinct groups with distinct ideas.
By observing Table 3, it becomes clear that members from teams that suffered significant changes in their structures, during the project, showed an unexpectedly high level of confusion about the team's constitution. That confusion is palpable in the following statement, made by the aforementioned investigator:
F3(IM) - We were six investigators and two MBAs... [pause} ... no/ we were ten ... there
were two more investigators from the other. .. three more .... no/ we were ten or eleven.
Participants often talked about a feeling of uneasiness and discomfort regarding group fuzziness. However, no relationship between this discomfort and team failure was observed in this study.
The initial phase, in most groups, was marked by uncertainty about members' roles. The investigators' discomfort is exemplified in the following quotations:
C2(IF) - In the first place, we had never met before. We didn't know each other and
we had to elect a leader! I believe those things should be done later on!
F2(IM) - The chosen team leader was a MBA; we had no idea who he was.
In many groups, the separation process was not smooth. Even participants who had excellent personal relationships during the project lost contact with each other. Some of the investigators felt reluctant about discussing the subject openly, choosing silence over dialogue, which led to significant levels of investigators' distress and MBAs' resentment. This is manifest in the following testimonies:
E1(GM) - I didn't talk to anyone again, after the presentation. Not even a phone call
just to say "Thank you''l
E3(IF) - The MBAs left right after [the final presentation). They were discarded, the
poor guys. They were ignored, we never talked to them again. And that was horrible, it was a hideous attitude.
The abovementioned periods correspond, roughly, to Tuckman's "Forming" and "Adjourning" phases. Behaviors related to the other three phases, "Storming", "Norming" and "Performing" were not observed. As we have seen before, eFTs usually exist in a limited time-span. Therefore, we can expect their evolution to abide by different rules.
4.3 Leadership and decision-making
All the teams had a fonnally elected team leader. This was due to the project's methodology requirements, and had no relationship with day-to-day leadership and decision-making process.
Since there was no real leader imposed by an organizational hierarchy (the elected leader was just an inconsequential character), "de facto" leaders (often temporary) emerged from a complex set of team dynamics. Some of the relevant criteria mentioned by participants to explain the leader's emergence include subject knowledge, age and good social skills. Next, some pertinent quotations are presented:
E1(GM) - Then, there was a change in leadership ... not a formal one .. . it happened