Original article (short paper)
Tracking upper limbs fatigue by means of
electronic dynamometry
Fernando Max Lima
University Federal de Uberlândia, Uberlândia, Brazil
Luciane Fernanda Rodrigues Martinho Fernandes Dernival Bertoncello
Universidade Federal do Triangulo Mineiro, Uberaba, Brazil
Abstract—This study aimed to identify useful electronic grip dynamometry parameters to track differences between trained (TR) and untrained (UT) participants, and between dominant (DO) and non-dominant (ND) limbs as a consequence of upper limbs muscle fatigue following 10 RM tests of the brachial biceps. This experimental study with transversal design involved 18 young adult males, of whom 9 were untrained and 9 were experienced in resistance training.Isometric grip force was evaluated (30 seconds long) previous and after 10RM tests by means of a G200 Model grip dynamometer
with precision load cell (Biometrics®). Signiicant differences between initial and inal measurements were found only
for trained participants: Peak force for TR-DO (67.1 vs 55.5 kgf, p = .0277); Raw average for TR-DO (46.96 vs 42.22 kgf, p = .0464), and for TR-ND (40.34 vs 36.13 kgf, p = .0277). Electronic grip dynamometry eficiently identiied upper
limbs fatigue in trained participants, being raw average measurements the best parameter.
Keywords: muscle strength dynamometer, muscle fatigue, hand strength, resistance training.
Resumo—“Rastreamento de fadiga de membros superiores por meio da dinamometria eletrônica.” Objetivou-se
identiicar parâmetros da dinamometria eletrônica de preensão palmar úteis para monitorar diferenças entre indivíduos treinados (TR) e não treinados (UT) e entre membros dominantes (DO) e não dominantes (ND) após indução de fadiga pelo teste de 10RM para bíceps braquial. Tratou-se de estudo experimental, transversal, envolvendo 18 homens adultos jovens, 9 não treinados e 9 experientes em treinamento resistido. Avaliou-se a força isométrica de preensão palmar (por 30 segundos) antes e após o teste de 10 RM por dinamômetro de preensão com célula de carga de precisão modelo G200 (Biometrics®). Houve diferença signiicativa entre valores iniciais e inais somente para treinados: Pico de força para
TR-DO (67,1 vs 55,5 kgf, p = 0,0277); média bruta para TR-DO (46,96 vs 42,22 kgf, p = 0,0464) e para TR-ND (40,34
vs 36,13 kgf, p = 0,0277). A dinamometria eletrônica mostrou-se eicaz em identiicar a fadiga de membros superiores
nos participantes treinados, sendo a média bruta o melhor parâmetro.
Palavras-chave: dinamômetro de força muscular, fadiga muscular, força da mão, treinamento de resistência.
Resumen—“Seguimiento de fatiga de miembros superiores mediante dinamometría electrónica.” El objetivo fue iden
-tiicar los parámetros en la dinamometría electrónica de presión palmar para comprobar las diferencias en individuos entrenados (TR) y no entrenados (UT) y en miembros dominantes (DO) y no dominantes (ND) después de la fatiga inducida por la prueba de 10RM para bíceps braquial. Fue estudio experimental, transversal que incluyó 18 hombres adultos jóvenes, 9 no entrenados y 9 con experiencia en entrenamiento resistido. La fuerza isométrica de presión palmar (durante 30 segundos) después de la prueba de 10RM fue evaluada por dinamómetro de presión con célula de carga de precisión modelo G200 (Biometrics®). Fue encontrada signiicativa entre los valores iniciales y inales sólo para el grupo entrenados: fuerza máxima para TR-DO (67,1 vs 55,5 kgf, p = 0,0277); promedio bruto para TR-DO (46,96 vs 42,22 kgf, p = 0,0464) y para TR-ND (40,34 vs 36,13 kgf, p = 0,0277). El dinamómetro electrónico fue eicaz en la identii
-cación de la fatiga de los miembros superiores en los participantes entrenados, con el mejor parámetro promedio bruto. Palabras claves: dinamómetro de fuerza muscular, fatiga muscular, fuerza de la mano, entrenamiento de resistencia.
Introduction
Muscle fatigue is deined as an inability to maintain the force required for a speciic movement over an extended period,
although performance can usually be recovered following a
period of rest (Allen, Lamb, & Westerblad, 2008; dos Santos, Dezan, & Sarraf, 2003; Edwards, 1981; Enoka & Stuart, 1992; Fitts, 1994; Garcia, Magalhães, & Imbiriba, 2004; Green,
A more appropriate deinition would therefore be any decline in
performance associated with muscular activity conducted at the
initial intensity (Bigland-Ritchie, Cafarelli, & Vøllestad, 1985; Bogdanis, 2012; Simonson & Weiser, 1976).
Long-term exercise training can not only increase mus-cular strength, but also enhance the capacity of the muscle to resist fatigue, in both healthy and sick people (Bishop,
Girard, & Mendez-Villanueva, 2011; Bogdanis, 2012; Hurley, Hanson, & Sheaff, 2011). In contrast, poor itness or lack of exercise can increase susceptibility to fatigue (Bloomield, 1997; Rimmer, Schiller, & Chen, 2012). The correct mani -pulation of different variables during resistance training can
inluence speciic intracellular signalling pathways activa -tion, hormonal and immunological responses and protein
synthesis, hence determining inal outcomes in accordance
with the objectives of a training program (Spiering et al., 2008). These variables include intensity and load used in the training, rest period’s duration between different exercises sets, the exercises order, the muscular action speed and other nutritional considerations.
One way to gauge the strength of the upper limbs is to use grip dynamometers. They may be hydraulic, mechanical, pneumatic or electronic. The hydraulic type has been most widely discussed in the literature, and is extensively used by practitioners during rehabilitation of the upper limbs (Caixeta, 2008). The gold standard for measuring hand strength is the
Jamar hydraulic dynamometer, recommended by the American Society of Hand Therapists (ASHT) (Fernandes & Marins, 2011; Moreira, Godoy, & Junior, 2001). On the other hand,
electronic instruments provide larger amounts of data through time with greater precision, and efforts have been made to com-bine different sources of information during measurements of
muscular endurance (Oliveira, 2011; Reuter, Massy-Westropp, & Evans, 2011).
As one of the most relevant and well-studied muscle of
the upper limbs, the brachial biceps is responsible for the movement of the hand towards upper trunk and head, and also
participates in forearm supination, directly inluencing spatial
positioning of hand as well as affecting grip strength. Since many routine activities and postures involving grip tasks also
require a synergic action of elbow lexor muscles, functional
changes due to strength training and fatigue may affect hand strength and endurance.
In the light of the presented information, this research study aimed to identify useful electronic grip dynamometry parameters to track differences between trained and untrained participants, and between dominant and non-dominant limbs as a consequence of upper limbs muscle fatigue following 10 Repetition Maximum (RM) tests.
Methods
Characterization of the study
This was a randomized controlled study, approved by
the Committee of Ethics in Research with Humans of the
Federal University of Triangulo Mineiro (protocol number 2062 / 2011).
Participants
Participants consisted of 23 males aged 18-30 years, of whom 11 were untrained (control group) and 12 were practitio-ners of resistance training (trained group). They tested popula-tion consisted of university students and members of local gyms and sports clubs. The inclusion criteria employed were either (1) to have practiced weightlifting or other resistance exercises for the upper limbs for at least one year, and at least twice weekly (trained group), or (2) not to have practiced resistance exercises or weight training during the last six months or for more than six consecutive months in the last two years (untrained group). The exclusion criteria were: functional changes in the upper limbs, cardiopulmonary diseases or any other effects that might com-promise the performance of diverse physical exercises; the use of
hormonal supplements, having speciic dietary requirements or
being restricted in the intake of any particular energy substrate.
Procedures
The research was split into two phases. In an initial evalua-tion, the participants consented to voluntary participaevalua-tion, and completed a questionnaire with personal details, information on any previous personal or family morbidity, and any previous practice of physical activity, detailing the period, duration, and nature of the training undertaken. The volunteers were submitted to physical assessment including measurements of vital signs, total body mass, stature and skin fold thickness test. The 10 RM test was used to determine the local muscular
strength and endurance involved in the lexion movement of
the elbow and to induce upper limbs fatigue, and instrumental measurements were used to determine hand strength and
endu-rance. During the last two tests, volunteers were familiarized
with the employed procedures.
The second evaluation, conducted ive to seven days af
-ter the irst one, began with a warm-up procedure, followed
(in sequence) by dynamometer grip measurements, 10 RM test, a further dynamometer grip measurement, and a
relaxa-tion procedure. A coin toss was used to randomize the irst
participant limb order assessment of each group (heads for dominant and tails for non-dominant limb). The following participants of each group alternated limb assessment order opposite to the latest one.
Prior to the 10 RM tests, volunteers were instructed verbally and visually on how the tests should be correctly performed. Du-ring the tests, intense verbal reminders and encouragement were
provided by the researcher, always using the same standardized
Anthropometrics
According to the recommendations of the American Society of Exercise Physiologists (ASEP), on the irst day of the tests
the participants were submitted to stature, total body mass, and skin fold measurements (Heyward, 2001). Evaluation of body composition employed an equation based on the sum of the tricipital, suprailiac, and abdominal folds, proposed for young
Brazilian males (Guedes & Guedes, 1991).
Electronic grip dynamometry
Isometric hand strength and endurance were determined using an H500 Hand Kit that included a G200 Model dynamometer with precision load cell, and E-Link software (Biometrics Ltd). Two measurements of maximum isometric strength maintained for 30 seconds were made for each hand, separately, with the hand grip
in position 2. The irst measurement was performed prior to the
10 RM test, and the second after its completion. The volunteer remained seated, with shoulders adducted parallel to the trunk,
elbows lexed at 90°, and forearms and ists in a neutral position, as recommended by ASHT (Fernandes, Bertoncello, Pinheiro, &
Drumond, 2011). The following variables were determined: Peak
force (kgf); Raw average (kgf); Peak-normalized Average Force
(%), and Endurance (kgf/s). The endurance (or muscular resistance) was determined from the slope of the linear regression curve for the data obtained over 30 seconds, and therefore represented the
amount of tension lost per time unit. A steeper curve was therefore
indicative of greater loss of tension and lower muscular endurance.
10 repetition maximum test (10 RM)
The 10 RM test for lexion of the elbow was performed
using the seated concentration curl movement for free
wei-ghts, as described elsewhere (Evans, 2007). The participant remained seated, with legs half apart, and supported the distal posterior portion of the exercised arm on the inner face of the ipsilateral thigh, with shoulder aligned vertically and the elbow and forearm in supination. The volunteer was then required to raise the dumbbell in the direction of the
shoulder. The standardized procedure was to perform a luid movement, accompanied by the beat of a metronome at 1 Hz,
with one movement cycle every three beats, hence allowing one second for the concentric action and two seconds for the eccentric return movement.
A general warm-up was performed for five minutes using
a cycle ergometer, followed by a specific warm-up consis-ting of three series of 10 repetitions with increasing loads equivalent to 30, 50, and 75% of the estimated load for the
10 RM test. After that, a maximum of five attempts were
conduced to 10 RM load identification, using increasing loads, and intervals of three to five minutes between each
attempt, as suggested elsewhere (Brown & Weir, 2001).
The 10 RM load was reached when participant performed not more than 10 fluid movements without any observable biomechanical compensation, at a speed that was in
ac-cordance with the frequency of the metronome. A slightly
decrease in movement velocity was accepted in the last two repetitions, as long as the participant could perform each of them in less than 5 seconds without visible changes in the
movement biomechanics. When participant tried heavier
loads, but could not finish the 10 repetitions, we considered the former heaviest load properly performed as the 10 RM load. The 1, 2, and 5 kg dumbbells used were previously calibrated using a commercial mechanical balance (0.05 kg precision). Four measurements were made of each dumbbell and the bar with clips, and the value used was either the mode of the four attempts or the arithmetic mean (when there were two readings with one value and two readings with another value).
Group UT Group TR
p* Median Upper
quartile
Lower
quartile Median
Upper quartile
Lower quartile
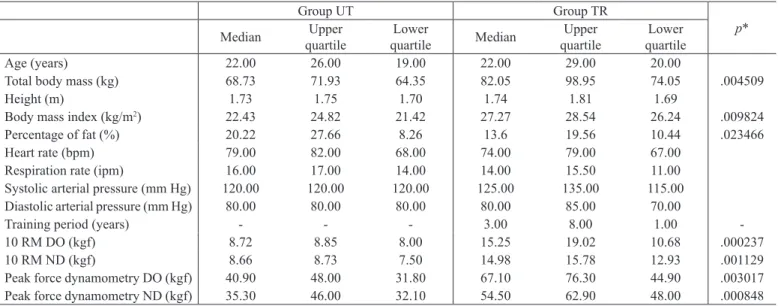
Age (years) 22.00 26.00 19.00 22.00 29.00 20.00
Total body mass (kg) 68.73 71.93 64.35 82.05 98.95 74.05 .004509
Height (m) 1.73 1.75 1.70 1.74 1.81 1.69
Body mass index (kg/m2) 22.43 24.82 21.42 27.27 28.54 26.24 .009824
Percentage of fat (%) 20.22 27.66 8.26 13.6 19.56 10.44 .023466
Heart rate (bpm) 79.00 82.00 68.00 74.00 79.00 67.00
Respiration rate (ipm) 16.00 17.00 14.00 14.00 15.50 11.00 Systolic arterial pressure (mm Hg) 120.00 120.00 120.00 125.00 135.00 115.00 Diastolic arterial pressure (mm Hg) 80.00 80.00 80.00 80.00 85.00 70.00
Training period (years) - - - 3.00 8.00 1.00
-10 RM DO (kgf) 8.72 8.85 8.00 15.25 19.02 10.68 .000237
10 RM ND (kgf) 8.66 8.73 7.50 14.98 15.78 12.93 .001129
Peak force dynamometry DO (kgf) 40.90 48.00 31.80 67.10 76.30 44.90 .003017 Peak force dynamometry ND (kgf) 35.30 46.00 32.10 54.50 62.90 48.00 .000848
Table 1. Initial characterization of the participants.
Data analysis
The normality of the data was evaluated using the Shapiro
-Wilk test. The total sample set was divided into 4 subgroups:
untrained dominant (UT-DO), untrained non-dominant (UT -ND), trained dominant (TR-DO), and trained non-dominant
(TR-ND). Due to the sample size and the fact that most of the variables presented non-normal distributions, Mann-Whitney U
-test was used to analyze inter-group differences, while Wilcoxon
matched pairs test was used in the case of intra-group
differen-ces. Spearman rank correlation coeficient (ρ) was employed to
determine the similarity between the pre-test values, obtained
on the irst day of the trial, and the values obtained during the
main tests on the second day for the 10 RM loads and the Peak
force values obtained in grip dynamometry. A signiicance level
less than 5% was used, and the analyses were performed using Statistica 8.0 software (StatSoft Inc).
Results
From the 23 participants evaluated in a irst moment, 18 were
included in the study (9 UT and 9 TR). Of the TR participants, two desisted from continuing assessments in the second phase, and one was excluded due to recent lesion in one limb. In UT,
one was excluded due to pain in the right ist during the 10 RM
test, and one was excluded because he had practiced weight-training for 3 weeks, two months prior to the trial.
The groups were homogeneous in terms of age, vital signs (pulse rate, respiration rate, systolic pressure, and diastolic
pressu-re), and height. However, there were signiicant differences for the
variables: total body mass, body mass index (BMI), and percentage of subcutaneous fat. TR group presented greater body mass and higher BMI, which was probably due to a greater muscle mass,
since they had smaller percentages of subcutaneous fat. Signiicant
differences between them were also observed for 10 RM and Peak force values obtained for both hemi sides (DO and ND) (Table 1).
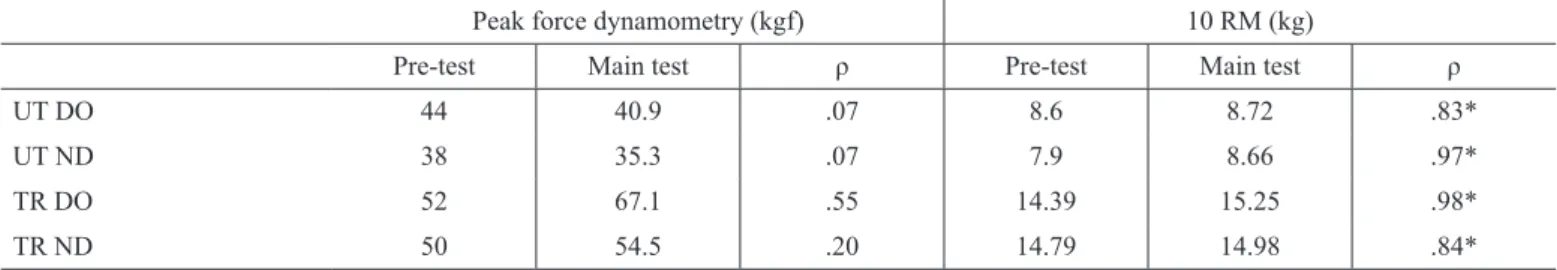
Spearman rank correlation coeficient was used to compare
the results of the preliminary and main experiments in terms of the 10 RM and Peak force values. Ten RM results showed
correlation coeficients greater than .83 for both groups, while
dynamometry values showed greater variability, especially in the case of UT group (Table 2).
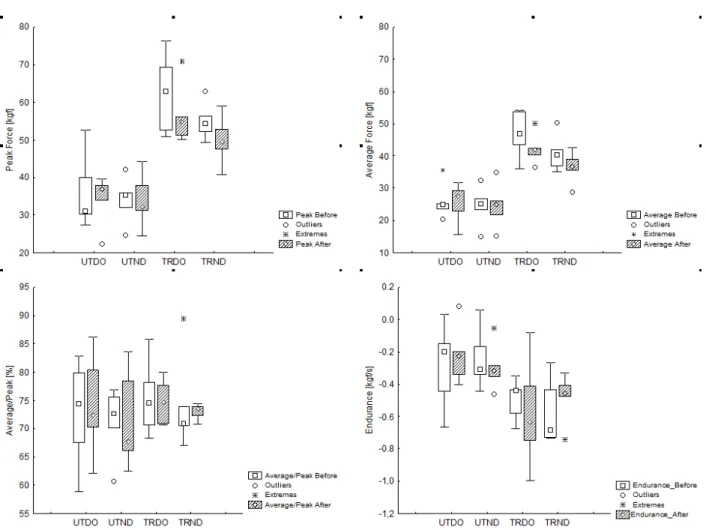
Final values were signiicantly lower than initial values in
the case of the Peak force of TR-DO group and the Raw ave-rage of TR-DO and TR-ND groups. The TR group presented higher values for the Peak force and the Raw average, both before and after 10 RM test, and for both DO and ND limbs. Prior to 10 RM test, UT-ND group showed better endurance
than TR-ND group, but no signiicant differences were ob -served after the test. No differences were ob-served between
groups, before or after 10 RM tests, for the Peak-normalized
30s average value (Figure 1).
Discussion
Grip strength and Peak force behaviour have been exten-sively studied using a variety of different dynamometer types; however, the evaluation of endurance indicators obtained using
grip dynamometry has not yet been standardized, which hinders
comparisons between various studies. In addition, no previous studies were found comparing grip strength and endurance measurements obtained before and after 10 RM tests applied to the upper limbs, considering dominant and non-dominant sides
as well as the inluence of resistance training.
It has been found previously that there is no need to perform
three repetitions (as recommended by ASHT for evaluation of
maximum grip strength), instead of a single repetition. The use of a single repetition was found to be reliable, and also helps
to minimize the effects of fatigue and discomfort, as well as optimizing the required evaluation time (Coldham, Lewis, & Lee, 2006; Lagerstrom & Nordgren, 1998; Massy-Westropp, Rankin, Ahern, Krishnan, & Hearn, 2004). For this reason, only a single attempt was used here (after prior familiarization
with the technique).
Initially, TR participants presented greater levels of strength, compared to the UT individuals, and neither group showed any
differences between the DO and ND sides. Signiicant reductions
in strength parameters (Peak force and Raw average) after the 10 RM test were only observed in the case of the TR volunteers (groups TR-DO and TR-ND). Reductions in Raw average values were observed for both subgroups, while the Peak force values were lower for subgroup TR-DO. It was also observed that performance of 10 RM tests did not alter endurance values, and that prior to the 10 RM tests there was difference only between TR and UT in the case of ND side.
Peak force dynamometry (kgf) 10 RM (kg)
Pre-test Main test ρ Pre-test Main test ρ
UT DO 44 40.9 .07 8.6 8.72 .83*
UT ND 38 35.3 .07 7.9 8.66 .97*
TR DO 52 67.1 .55 14.39 15.25 .98*
TR ND 50 54.5 .20 14.79 14.98 .84*
Table 2. Median values and statistical correlation between the values obtained in the preliminary and main tests for maximum grip dynamometry and the 10 RM test applied to the brachial biceps muscle.
The lower Raw average for the TR-ND group, without changes in Peak force, could be indicative of greater endurance deterioration in this group, compared to DO group, in which there were reductions in both Peak force and Raw average, although maximum strength remained unchanged.
The lack of any difference between initial and inal values for
UT could be explained by the fact that less well-trained muscles have greater propensity for sub maximal activation, compared to trained muscles, resulting in a smaller number of fatigued
ibres, and the ability to maintain a similar load at the end of the test (Behm, Whittle, Button, & Power, 2002; Bogdanis, 2012; Nordlund, Thorstensson, & Cresswell, 2004; Racinais et al., 2007). This behaviour could suggest that TR group, and especially the dominant limb, might be better adapted to load activities, rather than those requiring endurance when compared to the UT group.
Differences between DO and ND sides were not found for either UT or TR group. The DO side is generally stronger than the ND side, even after effort. However, here only the TR group exhibited this trend [p = 0.095965 (before) and 0.078170 (after)]. Most studies have reported differences in grip strength on the order of 3.2-10%, especially in the case of right-handed
people, while left-handed have shown differences of only around 1%, or have even shown greater strength in the right-hand limb
(Adedoyin et al., 2009; Amosun, Moyo, & Matara, 1995; Crosby & Wehbé, 1994; Hanten et al., 1999; Petersen, Petrick,
Con-nor, & Conklin, 1989; Roberts et al., 2011; Schmidt & Toews, 1970; Shechtman, Davenport, Malcolm, & Nabavi, 2003). The
present study did not consider handedness, but rather dominant and non-dominant limbs, while only two volunteers of the UT group were left-handed. Bohannon (1997) and Günther, Bürger,
Rickert, Crispin, and Schulz (2008) did not ind any signiicant
differences in grip strength when the effect of laterality was taken into consideration, which corroborates with the present
indings. The right-hand limb was generally stronger than the
left-hand, although participants presented somewhat higher values for the dominant side. The hypothesis that there might be a difference between the DO and ND limbs, and that this might be reduced following resistance training (especially employing
simultaneous bilateral exercises), could not be conirmed be
-cause UT group showed no signiicant difference.
Studies comparing the effect of fatigue on grip strength have
often considered the rest period inluence between successive attempts (Bechtol, 1954; Fairfax, Balnave, & Adams, 1997;
Figure 1. Analysis of the four dynamometry variables evaluated among the four subgroups before and after induced fatigue in upper limbs. UT: untrained; TR: trained; DO: dominant; ND: non-dominant; Signiicant intragroup differences: Peak force TRDO (p = .027709); Raw average TRDO (p = .046400) and TRND (p = .027709). Signiicant intragroup differences before fatigue: Peak force TRDO / UTDO (p = .003017) and TRND / UTND (p = .000848); Raw average TRDO / UTDO (p = .005031) and TRND / UTND (p = .005031); Endurance TRND / UTND (p = .017236).
Hanten et al., 1999; Mathiowetz, 1990; Montazer & Thomas,
1991; Reddon, Stefanyk, Gill, & Renney, 1985; Shechtman et al., 2003; Trossman & Li, 1989). A wide range of methodo -logies has been employed, but the validity and reliability of these measurements have been little discussed. Measurements commonly employed include the ability to sustain sub maximal loads, between 20 and 80% of maximum strength, for the longest time possible, as well as strength deterioration indices measured
before and after consecutive contractions (Jones, Robertson, &
Figoni, 2009; Reuter et al., 2011; Wallström & Nordenskiöld, 2001). In the present work, the slope of the regression curve was used to represent the deterioration in the force produced during a single measurement.
Using 10 s contractions, Massy-Westropp et al. (2004) found that left-handed people presented fatigue indices that were more similar between the two sides, and also showed greater enduran-ce in both hands, compared to right-handed individuals. Using three isometric resistance maximum attempts, Luna-Heredia,
Martín-Peña, and Ruiz-Galiana (2005) found that the non-do -minant limb showed greater reduction in maximum strength,
compared to the dominant limb. Desrosiers, Bravo, and Hébert
(1997) showed that in an elderly population there was a tendency for the dominant limb to show greater endurance, compared to the non-dominant limb, in tests where measurements were made of the number of seconds that participants could maintain 50% of maximum grip strength. They were provided with verbal stimulation and feedback, and the measurements employed a hydraulic Jamar dynamometer. Chatterjee and Chowdhuri (1991) compared the endurance of men of different ages, and demonstrated that the right hand was more resistant than the left hand in tests where identical loads were required to be sustained for the longest possible time. In relative terms, the weaker left hand was therefore required to maintain a greater tension than
the right hand. As in the present work, the sample population
was mainly composed of right-handed individuals.
The work of Nicolay and Walker (2005) was one of the
reported studies most similar to the present investigation. The static endurance during 30 s was evaluated for the dominant and non-dominant limbs of healthy non-sedentary young individu-als (although no reports of physical activities were provided). Endurance measure considered the ratio between the forces
measured during the last and irst seconds. It was found that
the dominant side presented worse endurance than the
non-do-minant side, which partially conlicts with the present indings,
where no difference was observed between the endurance of the dominant and non-dominant sides, according to the slope of the linear regression curve obtained over a period of 30 s. Here, after exhaustive testing, the TR-ND group only showed a reduction in the Raw average, while the TR-DO group showed reductions in the maximum strength, as well as the Raw average, suggesting that the ND side became less resistant than the DO side after strenuous exercise.
No studies describing the effect of training on grip en-durance were found in the literature. Jakobsen, Rask, and Kondrup (2010) evaluated the muscular endurance of healthy individuals and hospital patients, using 70% maximum of grip force maintained for as long as possible. It was found that
the endurance of patients was lower than that of the healthy individuals, and that healthy men showed lower endurance, compared to healthy women, probably due to greater participa-tion in high-intensity activities, such as resistance training. In
the present work, only the UT-ND group showed a signiicant
difference (greater endurance) relative to the TR-ND group.
The lack of any difference between initial and inal values
obtained for the Peak force and the Raw average was also indicative of better relative endurance of individuals in the UT group, compared to the TR group.
It was expected that young trained men would show greater grip endurance compared to the untrained volunteers due to the necessity of forearm muscles to sustain isometric actions to sta-bilise free-weights and bars during resistance training protocols (only one participant in the TR group reported the occasional
performance of speciic exercises for forearm muscles). Other
studies have also found no differences in endurance between
stronger and weaker individuals, although no speciic types of
training were considered, and some of the investigations
em-ployed hospitalized patients (Chatterjee & Chowdhuri, 1991;
Desrosiers et al., 1997; Nwuga, 1975; Robertson, Mullinax,
Brodowicz, & Swafford, 1996).
A limitation of this investigation was that the researchers
had no direct control over training variables undertaken by the participants. Information was obtained by means of inter-views, and was sometimes subjective, as in the case of speed of movement and perceived load. Since there is no consensus concerning endurance tests performed using electronic dy-namometers, endeavours were made to clearly and precisely describe all procedures. In this sense, it is also important to
summarize the positive aspects of the present study. Using
portable devices, the combination of 10RM tests and electro-nic grip dynamometry may be especially advantageous in the design and evaluation of athletes training and rehabilitation programs, providing an easy way to assess patients’ physical
itness, to monitor rehabilitation improvements or fatigue-re -lated changes during different tasks.
Nonetheless, further studies are recommended to compare the behaviours of the evaluated parameters, with more vo-lunteers (larger samples), as well as other variables that have
been described in the literature, in the light of speciic training
protocols whose purpose is to increase muscular strength, en-durance, or motor skills.
Conclusions
Resistance training seems to induce observable changes in electronic grip dynamometry readings. Few differences were
found regarding dominance. As expected, trained participants
are stronger. But they also showed great decrements in grip tension after the 10RM protocol used to induce fatigue.
Elec-tronic grip dynamometry was capable to eficiently identify
fatigue-related upper limbs changes in trained participants, and raw average measurements were the best parameter
com-pared to peak force, peak-normalized average or endurance
of hand grip strength: a methodological analysis and normative data in athletes. Fisioterapia e movimento, 24, 567-578.
Fernandes, L., Bertoncello, D., Pinheiro, N.M., & Drumond, L.C. (2011). Correlações entre força de preensão manual e variáveis antropométricas da mão de jovens adultos (Correlations between
grip strength and manual hand anthropometric variables of young adults). Fisioterapia e Pesquisa, 18, 151-156.
Fitts, R. (1994). Cellular mechanisms of muscle fatigue. Physiological Reviews, 74, 49-94.
Garcia, M.A.C., Magalhães, J., & Imbiriba, L.A. (2004). Temporal
behavior of motor units action potential velocity under muscle fatigue conditions. Revista Brasileira de Medicina do Esporte, 10, 299-303.
Green, H. (1995). Metabolic determinants of activity induced muscular fatigue. Exercise Metabolism, 211-256.
Guedes, D.P. (2006). Manual prático para avaliação em educação física (Practical handbook for evaluation in physical education).
São Paulo: Manole.
Guedes, D.P., & Guedes, J.E.R.P. (1991). Proposição de equações para predição de quantidade de gordura corporal em adultos jovens
(Proposition of equations for prediction of amount of body fat in young adults). Semina: Ciências Biológicas e da Saúde, 12, 61-70.
Günther, C.M., Bürger, A., Rickert, M., Crispin, A., & Schulz, C.U.
(2008). Grip strength in healthy caucasian adults: reference values. The Journal of Hand Surgery, 33, 558-565.
Hanten, W.P., Chen, W.-Y., Austin, A.A., Brooks, R.E., Carter, H.C., Law, C. A.,…Vanderslice, A.L. (1999). Maximum grip strength
in normal subjects from 20 to 64 years of age. Journal of Hand Therapy, 12, 193-200.
Heyward, V. (2001). ASEP methods recommendation: body composi -tion assessment. J Exercise Physiology, 4, 1-12.
Hurley, B.F., Hanson, E.D., & Sheaff, A.K. (2011). Strength training
as a countermeasure to aging muscle and chronic disease. Sports Medicine, 41, 289-306.
Jakobsen, L.H., Rask, I.K., & Kondrup, J. (2010). Validation of han -dgrip strength and endurance as a measure of physical function and quality of life in healthy subjects and patients. Nutrition, 26, 542-550.
Jones, D., Robertson, L., & Figoni, S. (2009). A strength-endurance
index for power grip. Journal of Occupational Rehabilitation, 19, 56-63.
Lagerstrom, C., & Nordgren, B. (1998). On the reliability and use -fulness of methods for grip strength measurement. Scandinavian Journal of Rehabilitation Medicine, 30, 113-119.
Luna-Heredia, E., Martín-Peña, G., & Ruiz-Galiana, J. (2005).
Handgrip dynamometry in healthy adults. Clinical Nutrition, 24, 250-258.
Massy-Westropp, N., Rankin, W., Ahern, M., Krishnan, J., & Hearn,
T.C. (2004). Measuring grip strength in normal adults: reference ranges and a comparison of electronic and hydraulic instruments. The Journal of Hand Surgery, 29, 514-519.
Mathiowetz, V. (1990). Effects of three trials on grip and pinch strength
measurements. Journal of Hand Therapy, 3, 195-198.
Montazer, M.A., & Thomas, J.G. (1991). Grip strength as a function of
repetitive trials. Perceptual and Motor Skills, 73, 804-806.
Moreira, D., Godoy, J., & Junior, W.S. (2001). Estudo sobre a realização da preensão palmar com a utilização do dinamômetro: Conside
-rações anatômicas e cinesiológicas (Study on the realization of
the palmar prehension with using dynamometer: anatomical
Con-siderations and cinesiológicas). Fisioterapia Brasil, 2, 295-300.
Nicolay, C.W., & Walker, A.L. (2005). Grip strength and endurance: Inluences of anthropometric variation, hand dominance, and gen -der. International Journal of Industrial Ergonomics, 35, 605-618.
References
Adedoyin, R.A., Ogundapo, F.A., Mbada, C.E., Adekanla, B.A., John
-son, O.E., Onigbinde, T.A., & Emechete, A.A. (2009). Reference
values for handgrip strength among healthy adults in Nigeria. Hong Kong Physiotherapy Journal, 27, 21-29.
Allen, D.G., Lamb, G., & Westerblad, H. (2008). Skeletal muscle
fatigue: cellular mechanisms. Physiological Reviews, 88, 287-332.
Amosun, S.-L., Moyo, A., & Matara, G. (1995). Trends in hand grip
strength in some adult male Zimbabweans. British Journal of Occupational Therapy, 58, 345-348.
Bechtol, C.O. (1954). Grip test the use of a dynamometer with ad-justable handle spacings. The Journal of Bone & Joint Surgery, 36, 820-832.
Behm, D., Whittle, J., Button, D., & Power, K. (2002). Intermuscle
differences in activation. Muscle & Nerve, 25, 236-243.
Bigland-Ritchie, B., Cafarelli, E., & Vøllestad, N. (1985). Fatigue of
submaximal static contractions. Acta physiologica Scandinavica. Supplementum, 556, 137-148.
Bishop, D., Girard, O., & Mendez-Villanueva, A. (2011). Repeated-S
-print Ability—Part II. Sports Medicine, 41, 741-756.
Bloomield, S.A. (1997). Changes in musculoskeletal structure and
function with prolonged bed rest. Medicine and Science in Sports and Exercise, 29, 197-206.
Bogdanis, G.C. (2012). Effects of physical activity and inactivity on muscle fatigue. Frontiers in Physiology, 3, 142. doi:10.3389/ fphys.2012.00142
Bohannon, R.W. (1997). Reference values for extremity muscle stren -gth obtained by hand-held dynamometry from adults aged 20 to 79 years. Archives of Physical Medicine and Rehabilitation, 78, 26-32.
Brown, L.E., & Weir, J.P. (2001). ASEP procedures pecommendation I: Accurate assessment of muscular strength and power. Profes-sionalization of Exercise Physiology, 4.
Caixeta, A.P.L. (2008). A inluência do posicionamento do cotovelo na avaliação da força de preensão palmar (The inluence of the posi -tion of the elbow in the evalua-tion of grasping force). (Retrieved from RIUnB: http://hdl.handle.net/10482/1357).
Chatterjee, S., & Chowdhuri, B.J. (1991). Comparison of grip strength
and isomeric endurance between the right and left hands of men and their relationship with age and other physical parameters. Journal of Human Ergology, 20, 41.
Coldham, F., Lewis, J., & Lee, H. (2006). The reliability of one vs. three
grip trials in symptomatic and asymptomatic subjects. Journal of Hand Therapy, 19, 318-327.
Crosby, C.A., & Wehbé, M.A. (1994). Hand strength: normative values.
The Journal of Hand Surgery, 19, 665-670.
Desrosiers, J., Bravo, G., & Hébert, R. (1997). Isometric grip endurance
of healthy elderly men and women. Archives of Gerontology and Geriatrics, 24, 75-85.
dos Santos, M.G., Dezan, V.H., & Sarraf, T.A. (2003). Bases metabó -licas da fadiga muscular aguda (Metabolic basis of acute muscular fatigue). Revista Brasileira de Ciência e Movimento. Brasília, 11, 07-12.
Edwards, R.H. (1981). Human muscle function and fatigue. Human muscle fatigue: physiological mechanisms, 1-18.
Enoka, R.M., & Stuart, D.G. (1992). Neurobiology of muscle fatigue.
Journal of Applied Physiology, 72, 1631-1648.
Evans, N. (2007). Bodybuilding anatomy. Champaign, IL: Human Kinetics.
Fairfax, A.H., Balnave, R., & Adams, R. (1997). Review of sincerity
of effort testing. Safety Science, 25, 237-245.
Nordlund, M.M., Thorstensson, A., & Cresswell, A.G. (2004). Cen -tral and peripheral contributions to fatigue in relation to level of activation during repeated maximal voluntary isometric plantar
lexions. Journal of Applied Physiology, 96, 218-225.
Nwuga, V. (1975). Grip strength and grip endurance in physical the -rapy students. Archives of Physical Medicine and Rehabilitation, 56, 297-300.
Oliveira F.B. (2011). Força de preensão palmar em idosos institucio-nalizados do município de Goiânia, Goiás, Brasil: características gerais e relação com índice de Massa Corporal(Palmar prehension force in institutionalized elderly of the city of Goiânia, Goiás, Brazil: General characteristics and relationship with body mass index). (Retrieved from RIUnB: http://hdl.handle.net/10482/6454)
Petersen, P., Petrick, M., Connor, H., & Conklin, D. (1989). Grip stren -gth and hand dominance: challenging the 10% rule. The American Journal of Occupational Therapy, 43, 444-447.
Racinais, S., Bishop, D., Denis, R., Lattier, G., Mendez-Villaneuva, A., & Perrey, S. (2007). Muscle deoxygenation and neural drive to
the muscle during repeated sprint cycling. Medicine and Science in Sports and Exercise, 39, 268.
Reddon, J.R., Stefanyk, W.O., Gill, D.M., & Renney, C. (1985). Hand
dynamometer: effects of trials and sessions. Perceptual and Motor Skills, 61, 1195-1198.
Reuter, S.E., Massy-Westropp, N., & Evans, A.M. (2011). Reliability
and validity of indices of hand-grip strength and endurance. Aus-tralian Occupational Therapy Journal, 58, 82-87.
Rimmer, J.H., Schiller, W., & Chen, M.-D. (2012). Effects of disabi -lity-associated low energy expenditure deconditioning syndrome. Exercise and Sport Sciences Reviews, 40, 22-29.
Roberts, H.C., Denison, H.J., Martin, H.J., Patel, H.P., Syddall, H.,
Cooper, C., & Sayer, A.A. (2011). A review of the measurement
of grip strength in clinical and epidemiological studies: towards a standardised approach. Age and Ageing, 40, 423-429.
Robertson, L.D., Mullinax, C.M., Brodowicz, G.R., & Swafford, A.R.
(1996). Muscular fatigue patterning in power grip assessment. Journal of Occupational Rehabilitation, 6, 71-85.
Santos, M.C.A., Semeghuini, T.A., Azevedo, F.M.d., Colugnati, D.B., Negrão Filho, R. D.F., Alves, N., & Arida, R.M. (2008). Análise da fadiga muscular localizada em atletas e sedentários através de parâmetros de freqüência do sinal eletromiográico; Analysis of localized muscular fatigue in athletes and sedentary subjects
through frequency parameters of electromyographic signal ( Analy-sis of muscle fatigue in athletes and sedentary through frequency parameters of the electromyographic signal; Analysis of localized muscular fatigue in athletes and sedentary subjects through fre-quency parameters of electromyographic signal).Revista Brasileira de Medicina do Esporte, 14, 509-512.
Schmidt, R.T., & Toews, J. (1970). Grip strength as measured by the
Jamar dynamometer. Archives of Physical Medicine and Rehabi-litation, 51, 321-327.
Shechtman, O., Davenport, R., Malcolm, M., & Nabavi, D. (2003).
Reliability and validity of the BTE-Primus grip tool. Journal of Hand Therapy, 16, 36-42.
Simonson, E., & Weiser, P.C. (1976). Psychological aspects and phy-siological correlates of work and fatigue. Springield, IL: Charles C Thomas.
Spiering, B.A., Kraemer, W.J., Anderson, J.M., Armstrong, L.E., Nindl, B.C., Volek, J. S., & Maresh, C.M. (2008). Resistance Exercise
Biology. Sports Medicine, 38, 527-540.
Trossman, P., & Li, P. (1989). The effect of the duration of intertrial rest
periods on isometric grip strength performance in young-adults. Occupational Therapy Journal of Research, 9, 362-378.
Wallström, Å., & Nordenskiöld, U. (2001). Assessing hand grip en -durance with repetitive maximal isometric contractions. Journal of Hand Therapy, 14, 279-285.
Authors’ note
Fernando Max Lima is a PhD student, Faculty of Electrical Engine-ering, graduate program in electrical engineEngine-ering, Federal University of Uberlandia (FEELT / PPGEE / UFU) (University Federal de
Uber-lândia).
Luciane Fernanda Rodrigues Martinho Fernandes and Dernival Ber-toncello are adjunct professors, Health Sciences Institute, Department
of Applied Physical Therapy, Graduate Program in Physical Education,
Federal University of Triangulo Mineiro (ICS / DFisio / PPGEF / UFTM) (Universidade Federal do Triangulo Mineiro, Uberaba).
Acknowledgments
CAPES, CNPq, FAPEMIG and FUNEPU. This paper is part of a
dissertation.
Corresponding author
Dernival Bertoncello
Departamento de Fisioterapia Aplicada, Universidade Federal do Triângulo Mineiro
Av. Getúlio Guaritá, 159, Bairro Abadia, Uberaba/MG, 38025-440, Brazil
Phone: 55 34 3318-5950 Fax: 55 34 3312-1487
Phone: +55 34 3318-5950 / Fax: +55 34 3312-1487
E-mail : [email protected] (Bertoncello, D)
Manuscript received on November 15, 2014 Manuscript accepted on May 2, 2015