Article
Printed in Brazil - ©2015 Sociedade Brasileira de Química0103 - 5053 $6.00+0.00A
*e-mail: [email protected]
Determination of Parabens in Surface Water from Mogi Guaçu River (São Paulo,
Brazil) Using Dispersive Liquid-Liquid Microextraction Based on Low Density
Solvent and LC-DAD
Carlos A. Galinaro,*,a Fabiana M. Pereirab and Eny M. Vieiraa
aInstituto de Química de São Carlos (IQSC), Universidade de São Paulo (USP),
Avenida do Trabalhador São Carlense, 400, CP 780, 13560-970 São Carlos-SP, Brazil
bDepartamento de Engenharia de Materiais (SMM), Escola de Engenharia de São Carlos (EESC),
Universidade de São Paulo (USP), Avenida João Dagnone, 1100, 13563-120 São Carlos-SP, Brazil
A method using dispersive liquid-liquid microextraction (DLLME) based on low density solvent (LDS) combined with liquid chromatography with diode array detection (LC-DAD) has been developed for determination of parabens. Some DLLME parameters such as kind and volumes of extraction and disperser solvents, pH of the aqueous samples, ionic strength, extraction, centrifugation and speed time, were investigated. The method exhibits good linearity (0.9990 to 0.9993), limits of detection (0.5-0.8 µg L-1), and limits of quantification (1.3-2.4 µg L-1). In optimum conditions, enrichment factors and recoveries of studied parabens obtained were 38.9 to 88.4% and 30.3 to 68.0%, respectively. Surface water samples collected from Mogi Guaçu River (São Paulo state, Brazil) were analyzed, showing average contents of methyl-, ethyl-, propyl-, and
n-butylparaben of 8.0, 5.8, 13.1 and 15.1 µg L-1, respectively. This is the first study on parabens
in a Brazilian River, in a long stretch of river (ca. 300 km of extension).
Keywords: dispersive liquid-liquid microextraction, low density solvent, Mogi Guaçu River,
paraben, sample preparation
Introduction
Parabens are widely used as antibacterial, antifungal and preservative agents in food and beverages, pharmaceutical and personal care products. Often these products contain two or more parabens as part of a preservative system.1-8
However, this group exhibit estrogenic activity and possible effects on the endocrine system of humans, aquatic and wildlife.1-6,8,9 It is believed that contamination of aquatic
ecosystems by parabens depends on the geographical location (rural, urban or industrial region),6,8,10-12 weather
conditions (dry or wet season),13 as well as proximity
and efficiency, or inefficiency, of wastewater treatment plants.6,7,14,15 Most parabens are frequently found in river
water at concentrations reaching from ng L-1 to µg L-1,6-8,10-15
and their levels depend mainly on the extent of water dilution resulting from rainfall.11
The Mogi Guaçu River16 is located in Brazil, belonging to
São Paulo and Minas Gerais states, covering approximately
377.5 km in São Paulo state, totaling 473 km in length. Near this river are located 43 cities, 38 in São Paulo state, with an estimated population of 1.43 million inhabitants. This river is dominated by agricultural activities like growth of maize, beans, potatoes, cotton, citrus, coffee, extensive plantations of sugar cane, as well as livestock and poultry. The main industries in this river region are food, pulp and paper, metallurgical, sugar mills, alcohol, distilleries, tanneries, ceramic industries and mining of sand.16 Like
other rivers around the world,6-8,10-15 the water quality of the
Mogi Guaçu River has been affected due to the discharge of treated and untreated wastes from industries and residences, throughout its stretch.
Due to low levels of parabens in solid and liquid samples, the extraction and enrichment techniques are essential for the analysis of them.17 So, many methods
have been developed for the extraction of parabens, such as dispersive liquid-liquid microextraction,4,18 supercritical
fluid extraction,19 solid phase extraction,12,14,15,20,21 solid
phase microextraction,22 stir bar sorptive extraction,23 among
been used for determining trace concentrations of parabens in water, foods, pharmaceutical and personal care products like capillary electrophoresis,16,21 liquid chromatography
(LC),1,4,11,12,21 and gas chromatography (GC).3-5,9,14,18,19,22-24
Currently, special attention is devoted to the development of analytical methods for extraction and concentration of samples that is fast, efficiency and environmental friendly. Thus, in 2006, Rezaee et al.25 proposed dispersive
liquid-liquid microextraction (DLLME). DLLME is an extraction and pre-concentration technique to prepare samples, based on miniaturization, low cost, high speed and low consumption of solvents and reagents.25 It is based on a
dispersion of an extraction solvent (immiscible with water) and a dispersing solvent (miscible with water and extracting solvent) in an aqueous solution (sample), providing a large contact area between the aqueous phase and the extraction solvent.25 The extraction efficiency (EF) of DLLME
is influenced by several factors, as types and volumes of extraction1-5,18,24-28 and disperser solvents,1,3,5,25,27,28
extraction1,4,18,24,25,28,29 and speed time,18 sample volume,3,18,28
pH,1,3-5,18,24,25 and salt addition.1,3,4,18,25-29 The DLLME has
been applied to the extraction of various organic1-5,18,24-30 and
inorganic pollutants,9,31,32 both in aqueous samples3,4,9 as in
solid samples.9,18,33 Among these pollutants are parabens,
which are esters of p-hydroxybenzoic acid.1-5,9
The aim of this work is report an application of a dispersive liquid-liquid microextraction (DLLME) based on low density solvents (LDS) combined with liquid chromatography with diode array detector (LC-DAD) method for the simultaneous separation and determination of four parabens (methyl-, ethyl-, propyl-, and n-butylparaben)
in river water samples. This method was applied in surface water samples, collected from Mogi Guaçu River, in São Paulo state, Brazil. No data are available in literature about chemical pollution by parabens in Brazilian rivers.
Experimental
Materials and methods
Chemical and reagents
The parabens studied were methyl- (MP, HOC6H4CO2CH3,
purity ≥ 99%), ethyl- (EP, HOC6H4CO2C2H5, 99%),
propyl- (PP, HOC6H4CO2C3H7, ≥ 99%) and butyl- (BP,
HOC6H4CO2C4H9, ≥ 99%), purchased from Sigma-Aldrich
Co. (Steinheim, Germany). Sodium chloride (NaCl, 99.8%) was purchased from J.T. Backer (Xalostoc, Mexico); 1-octanol (C8H18O, 99.5%), chloridric acid (HCl, 37%),
and sodium hydroxide (NaOH, 97%) by Synth (Diadema, Brazil) and chlorobenze (C6H5Cl, 99%) from Merck
(Darmstadt, Germany). The LC grade solvents used
were acetonitrile (CH3CN, 99.9%) purchased from Tedia
(Fairfield, USA); acetone (CH3COCH3, ≥ 99.9%) and
methanol (CH3OH, 99.9%) both from Panreac Química
S.L.U. (Barcelona, Spain). Water was previously distilled and further deionized using a Milli-Q system Millipore (Millipore, Bedford, MA, USA).
The stock solutions (20000 µg L-1) were prepared by
dissolving each paraben in methanol. The working solution (1000 µg L-1) containing them was prepared from stock
solutions in methanol, and stored in amber flasks at 4 oC.
Samples
Fourteen surface water samples were collected from Mogi Guaçu River (São Paulo state, Brazil), covering 300 km of extension. The cities where the samples were taken were: Guatapará, Rincão, Porto Ferreira, Cachoeira de Emas, Pirassununga, Martinho Prado, Mogi-Guaçu, and Itapira. Sampling sites and location details are shown in Figure S1 and Table S1 (Supplementary Information). Sites were selected to represent both rural and urban environments, avoiding sampling in the immediate effluent from any local discharges, thus allowing discharges to mix with river water.
All samples (250 mL) were collected using a dark glass bottle, with subsequent addition of 0.5 mL of methanol (to avoid microbial activity) and sent to the laboratory. In the laboratory, the samples were filtered (removal of sand grains)3 through qualitative paper filter (Unifil,
80 g m-2) and then with a nylon membrane filter (Millipore,
0.45 µm × 47 mm), and stored at 4 oC in dark glass bottle
until extraction.
Dispersive liquid-liquid microextraction
The procedure of DLLME started with 10.0 milliliters of standard solution (containing 50 µg L-1 of each paraben)
or real surface water sample been transferred into a 15.0 mL Falcon tube. Subsequently, 1.0 g of NaCl was added and the tube was shaken until the complete dissolution of the salt. Then a mixture of 0.1 mL of 1-octanol (extraction solvent) and 1.0 mL of acetone (disperser solvent) was rapidly injected into the solution using a 2.0 mL syringe (BD-Becton, Dickinson and Company, São Paulo, Brazil). The solution obtained was shaken by a vortex mixer (Ika, MS 3 Digital, Germany) for 2 minutes (2000 rpm) and then centrifuged for 5 minutes at 2000 rpm (Eppendorf Centrifuge 5702, Hamburg, Germany). The 1-octanol (density 0.82 g mL-1) with some aqueous phase,
microsyringe (Hamilton, Nevada, USA) until the end of all organic phase and transferred to a 0.25 mL polypropylene insert (Agilent, USA). From the two phase solution in the insert, approximately 0.09 mL of pure organic phase was collected and stored for further analysis by LC-DAD.34
Next, the lower aqueous phase was discarded. The DLLME steps are illustrated in Figure S2 (Supplementary Information).
Calculation of enrichment factor and extraction recovery
The enrichment factor (EF) and extraction recovery (ER) were calculated according to Rezaee et al.25 EF is
defined as the ratio between the analyte concentration in the collected phase (Ccoll) and the initial concentration of
analyte (Ci) in the sample solution (equation 1).Ccoll was
obtained from calibration graph of direct injection of parabens standard solution in 1-octanol at the concentration range of 0.5 to 50 µg L-1.
(1)
The extraction recovery (ER, equation 2) is defined as the percentage of the total analyte amount (ni) which was
extracted to the collected phase (ncoll).25
(2)
Vcoll and Vaq are the volumes of the collected phase
and the aqueous solution respectively. The volume of the collected phase was determined using 0.025 mL glass microsyringe (Hamilton, Nevada, USA).
Instruments
The chromatography analysis was performed by Agilent 1200 series LC (Santa Clara, CA, USA) consisting of a 1311A Agilent quaternary pump, Agilent G1322A degasser, Agilent G1329A autosampler and linked to a Agilent 1315D diode array detector. The analytical methodology was adapted from Agilent Solutions Guide.34 The LC separation
was achieved by means of an Agilent Zorbax SB-C8 reverse phase column (250 mm × 4.6 mm internal diameter (i.d.) and a 5 µm particle size) and an Agilent HC-C18 guard column (12.5 mm × 4.6 mm i.d.), with deionized water-acid acetic (99:1%, v/v) and methanol as the mobile phase. The isocratic elution mode was employed: 35% deionized water/acid acetic and 65% of methanol, in 9 minutes, at a constant rate flow of 1.0 mL min-1. The injection volume
was 0.02 mL, using wavelength of 258 nm to detected parabens, and the column temperature was 25 °C.
The pH measurements were performed using a pHmeter (model 8010, Qualxtron, Jundiaí, Brazil).
Results and Discussion
There are a lot of parameters that affect the DLLME performance and efficiency, such as sample volume,3,18,28
types and volumes of extraction1-4,18,24-29,33 and disperser
solvents,1,3,5,25,27 pH of the aqueous samples,1,3-5,18,24,25,28 salt
addition,1,3,4,18,25-29 extraction,1,4,18,24,25,28,29 centrifugation and
speed time.18 In order to obtain the maximal enrichment
factor, all these parameters were first optimized using deionized water as a sample solvent, spiked with 50 µg L-1 of
parabens. All the experiments were carried out in triplicate.
Optimization of DLLME-LDS conditions
Selection of the extraction solvent
The selection of the extraction solvent in dispersive liquid-liquid microextraction is one of the most important parameters that affect the efficiency of extraction. This solvent must be compatible with the chromatographic conditions, higher or lower dense than aqueous phase, insoluble in water, and have a large extraction capacity of the analytes.2,25,28,30
Most of the applications of DLLME described in literature involve the use of high density chlorinated solvents such as chloroform, dichloromethane, carbon tetrachloride and chlorobenzene.1,3,24,25,27,28,30 However,
these solvents are extremely toxic and environmentally inappropriate.4,18
Extracting solvents such as ionic liquids9,29,33 or
long-chain alcohols4,18,28,30 have been used for their lower toxicity
to ecosystems. The long-chain alcohols, such as 1-octanol, 1-decanol, 1-undecanol, 1-dodecanol and 2-dodecanol are solvents of low density, floating on the aqueous phase.4,18
Initially, this study aimed to evaluate the efficiency of chlorobenzene (density 1.11 g L-1) as extraction solvent.27
However, there were some difficulties to see and collect the chlorinated solvent from the biphasic solution, resulting on less than 65% of chlorobenzene collected from the sediment phase. Besides, this solvent is not compatible with the reverse-phase LC mobile phase (high density) and an extra step would be needed to evaporate it before final analysis.30
As described previously,4,18 the use of 1-octanol in
DLLME has provide good results as an extraction solvent lighter than water.28 Thus, using 1-octanol (density of
0.82 g mL-1)4,18 as extracting solvent, an average of 90% of
and due to its low toxicity, ease of observation and recovering, this alcohol was chosen as extraction solvent.
Effect of volume of extraction solvent
In DLLME the volume of extraction solvent can influence the formation of the dispersion,1,4,24-26,28 and have
to be optimized. In order to study the effect of extraction solvent on the EF, the volumes of 0.05 to 0.11 mL of 1-octanol (increment 0.01 mL) were added to samples of deionized water containing parabens. By increasing the volume of 1-octanol from 0.05 to 0.10 mL, the volume of collected phase increased from 68% (0.034 mL) to 95% (0.095 mL). However, when 0.11 mL of 1-octanol was utilized, the volume collected decreased to 88% (0.097 mL). As shown in Figure S3 (Supplementary Information), the best EF of parabens was observed when 0.10 mL of 1-octanol was used. Therefore, this was the volume selected in order to obtain higher EF and ER.
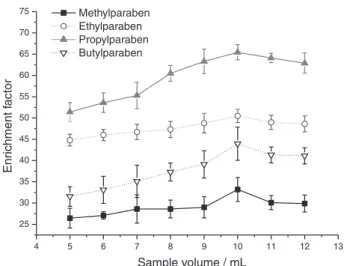
Effect of sample volume
In DLLME an increase in sample volume can enhance the amount of analytes transferred to the organic solvent, which improves the detectability (analytical signal increase).1,18,28 To examine this effect, the sample volumes
tested for the extraction of parabens were 5.0 to 12.0 mL (increment 1.0 mL). The results indicate that when sample volume increases from 5.0 to 10.0 mL (Figure 1) the EF of parabens increases. However, raising the sample volume from 11.0 to 12.0 mL resulted in a small decrease of the EF, probably due to decrease in the volume ratio of organic phase/aqueous phase.1,18,28 It was found that the largest EF
was obtained when 10.0 mL of water sample solution was
used, because the equilibrium between the analytes and the organic phase (0.10 mL of 1-octanol) was achieved. On basis of these results, 10.0 mL was selected as the optimum sample volume.
Effect of the type and volume of disperser solvent
The miscibility of disperser solvent, either in aqueous or extraction phase, is the main characteristic to obtain a good EF.1,3,5,25,27,28 Consequently, in this work, the ability
of acetone, acetonitrile and methanol as disperser solvent was investigated. According to Figure S4a (Supplementary Information), when acetonitrile and methanol were used as dispersive solvent, the EF were lower than using acetone. So, the best EF of parabens was obtained when acetone was used as disperser solvent, and, besides its capacity of high recovery of analytes, this solvent is also low cost and eco friendly.
The volume of disperser solvent is a parameter that also has to be optimized when using the DLLME.1,3,5,25,27,28
The variation of the volume of dispersive solvent can affect the formation of emulsion system (water/1-octanol/ acetone), which can influence the dispersion conditions of the extraction solvent in aqueous phase.25 So, the effect
of the disperser solvent was tested for five volumes of acetone ranging from 0.25 to 1.25 mL (increment 0.25 mL, Figure S4b, Supplementary Information). With small volumes of dispersive solvent, the EF was not satisfactory, because the extractant cannot disperse uniformly in the aqueous phase. Thus the volume of 1.00 mL was chosen for the dispersive solvent.
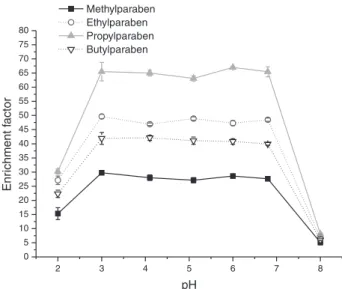
Effect of sample pH
The pH of aqueous solution is an important parameter that might affect the EF in the DLLME.1,3-5,18,24-26,28,29
The charge and the lipophilic character of parabens can be affected by changing the pH, which can cause the protonation of the oxygen atom (pH < 3) or deprotonation of the hydroxyl group (pH > 7).11 Therefore, the effect
of sample pH on the EF of the parabens from aqueous samples by DLLME was studied ranging from 2.0 to 8.0 (pH increment 1.0).
The adjustment of the pH of the samples was made with 0.05 mol L-1 of HCl or 0.05 mol L-1 of NaOH. As
shown in Figure 2, the EF remained nearly constant from pH 3.0 to 6.8. Below pH 3.0, a decrease of EF occurs due to the hydrolysis of ester group of parabens.2 On the other
hand, at pH > 7 the EF decrease because the parabens (pKa from 8.17 to 8.37) are in ionic forms and cannot be extracted by organic solvents.7,18 The original pH of
all the collected river water samples was approximately 6.8 ± 0.2. So, for these experiments, there was no need for pH adjustment.
Figure 1. Effect of sample volume. Extraction condition: parabens concentration = 50 µg L-1; volume of 1-octanol = 0.1 mL; volume
Effect of salt addition
In general, the salt addition to the solution decreases the solubility of analytes in the aqueous phase and enhances their extraction into organic phase.1,4,18,25,26,28,29
To evaluate the ionic strength effect on EF of parabens in the DLLME, experiments were conducted at different NaCl concentrations in the water sample solutions. NaCl content was increased from 0 to 20% (m/v), with increments of 5% (Figure 3).
The results given in Figure 3 indicate that the increase in salt concentration, from 0 to 15%, rise the EF of four
parabens and it also increased the volume of organic phase collected from 50% to 92%, respectively. Increase of NaCl concentration above 15% caused a gradual decrease in the EF and, consequently, in the volume of the organic phase collected. On basis of these results, 10% of NaCl was chosen in subsequent experiments.
Effect of extraction time
The extraction time is the time interval between the injection of the disperser and extraction solvents mixture and the centrifugation.The influence of the extraction time in the DLLME depends on the analytes and solvent system.1,3-5,18,24,25,28,29 So, this parameter was studied in the
extraction of parabens. After the addition of the mixture of 1-octanol (extraction solvent) and acetone (disperser solvent), the sample solution was shaken by a vortex mixer for a series of extraction times, ranging from 0 to 5 min (increment 1 min). The results demonstrated that the extraction time increased the EF (Figure S5, Supplementary Information), where greatest quantities of parabens were transported into the organic phase and the equilibrium was achieved within 2 minutes. So, the samples were shaken for 2 minutes before being centrifuged.
Effect of centrifugation time and speed
Centrifugation step is necessary to make the complete separation of the aqueous phase from the organic phase.5,18
Thus, the influence of centrifugation time in the DLLME was tested in the range of 1 to 10 minutes (1, 3, 5, 8 and 10 minutes). Figure S6a (Supplementary Information) shows that the EF increases slightly with the increasing centrifugation time and remains practically constant after 5 minutes. This is because, after complete separation of organic phase from sample solution, longer centrifugation time cannot play any effect.2 Therefore, 5 minutes
centrifuging time was selected in the experiments. The centrifugation speed was evaluated, with speed ranging from 1000 to 4000 rpm (Figure S6b, Supplementary Information). The results reveal that the EF increases with increasing of speed and reach a plateau in 2000 rpm. So, 2000 rpm was therefore selected as the optimum centrifugation speed.
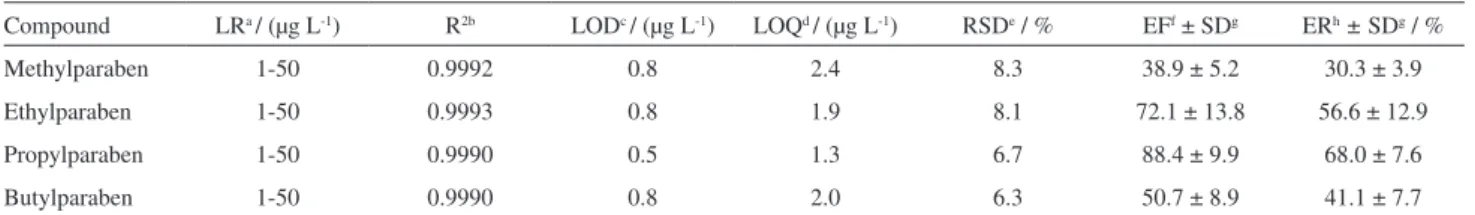
Analytical figures of merit
The analytical figures of the proposed method for all studied parabens were evaluated under the optimized condition, following the ICH guideline.35 The
characteristics analyzed were linear range (LR), square of correlation coefficient (R2), limit of detection (LOD), limit
of quantification (LOQ), relative standard deviation (RSD), F i g u re 2 . Effect of pH. Extraction condition: parabens
concentration = 50 µg L-1; water sample volume = 10.0 mL; volume of
1-octanol = 0.1 mL; volume of acetone = 1.0 mL; NaCl concentration = 10% (m/v); extraction time = 2 minutes; centrifugation time = 5 minutes; speed = 2000 rpm.
Figure 3. Effect of ionic strength. Extraction condition: parabens concentration = 50 µg L-1; water sample volume = 10.0 mL; volume
enrichment factor (EF), and extraction recovery (ER, %). The results are summarized in Table 1. Square of correlation coefficients (R2) ranged from 0.9990 to 0.9993. The LOD
and LOQ were determined based on the signal-to-noise (S/N) ratio being 3:1 and 10:1,35 respectively, where the
LOD ranged from 0.5 to 0.8 µg L-1 and LOQ ranged from
1.3 to 2.4 µg L-1. The RSD was studied in three replicate
analyses of the spiked water sample, ranging from 6.3 to 8.3%, showing good repeatability of the method. The EF and ER ranged, respectively, from 38.9 ± 5.2 for MP to 88.4 ± 9.9 for PP, and from 30.9% ± 3.9 for MP to 68.0% ± 7.6 for PP (Table 1).
Comparison of proposed method with other methods
The performance of DLLME-LDS and LC-DAD method is summarized in Table 2 and compared with literature data. Comparing the LOD and LOQ values obtained with different analytical techniques, the proposed method showed improved sensitivity in relation to LODs obtained in dispersive liquid-liquid microextraction based on low density solvent liquid chromatography with diode array detection (DLLME/GC-FID),18 supercritical fluid
extraction on-line headspace solid-phase microextraction combined with gas chromatography-mass spectrometry (SFC-HS-SPME-GC-MS),19 and stir-bar sorptive extraction
combined with gas chromatography-mass spectrometry (SBSE/GC-MS)23 methods, and was comparable to that
achieved in dispersive liquid-liquid microextraction combined with liquid chromatography with ultraviolet detection (DLLME/LC-UV).4 Moreover, the results show
that extraction time in DLLME is very short (2 minutes) and also that extraction equilibrium is achieved very quickly. That’s becausethe abundant contact surface of fine droplets and analyte speeds up mass transferring processes of analytes from aquatic phase to organic phase.17
However, the recoveries in DLLME were lower than those of other methods.14,19,23 This may be caused by the use
of dispersive solvent, which usually decreases the partition coefficient of analytes into the extraction solvents.17 Despite
this,the method is very simple, does not need any complex
or expensive instrument, like SPE,14 SFC-HS,19 SPME,22
and SBSE,23 and requires a small amount of sample. Thus,
the DLLME is a promising sensitive, rapid, repeatable and suitable alternative to the traditional techniques for sample preparation when analyzing parabens.
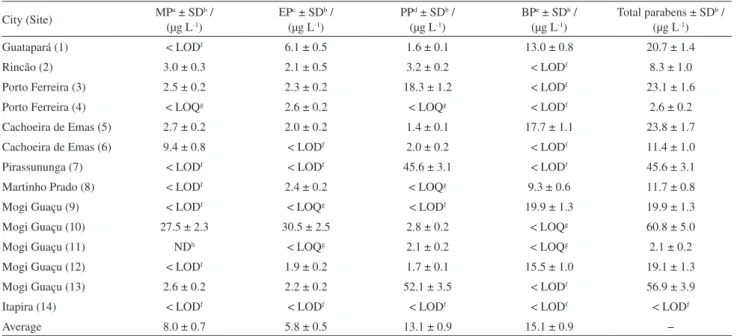
Real sample analysis
The proposed method was applied to determine MP, EP, PP and BP in the 14 surface water samples collected from Mogi Guaçu River (São Paulo state, Brazil). Figure 4 shows a typical chromatogram, obtained by DLLME-LDS and LC-DAD, for the target analytes in the unspiked and in the spiked (250 µg L-1) real surface water samples. It can
be noted by the chromatograms (Figure 4) that there is a good separation between studied parabens (MP, EP, PP and BP), and no interfering compounds were observed in surface water samples.
The samples were quantified using calibration curve (external calibration), constructed following the ICH guideline,35 using solutions of deionized water
spiked with 0.5 to 50.0 µg L-1 of parabens, which were
previously extracted by DLLME-LDS, according to procedure described in Experimental section. Table 3 shows the city (site), contents, average contents and the sum of the concentrations of methyl-, ethyl-, propyl- and
n-butylparaben, in all 14 surface water samples analyzed.
The highest sums of concentrations were found in the following sampling sites: Mogi Guaçu 10 (60.8 µg L-1), Mogi
Guaçu 13 (56.9 µg L-1) and Pirassununga 7 (45.6 µg L-1).
In other sampling sites, the sum of the concentrations were below 24.0 µg L-1, ranging from < LOD (Itapira 14) to
23.8 µg L-1 (Cachoreira de Emas 5).
Like this, some studies already have reported the presence of parabens in aquatic environments (Table S2, Supplementary Information).6-8,10-15 In this study (Table 3),
the average concentrations of parabens were 8.0 µg L-1 for
MP, 5.8 µg L-1 for EP, 13.1 µg L-1 for PP and 15.1 µg L-1
for BP, and these values are higher than in some manuscripts previously reported (Table S2, Supplementary Information). Probably, these higher parabens levels reflect Table 1. Quantitative features of the proposed method for analysis of parabens in water sample
Compound LRa / (µg L-1) R2b LODc / (µg L-1) LOQd / (µg L-1) RSDe / % EFf ± SDg ERh± SDg / %
Methylparaben 1-50 0.9992 0.8 2.4 8.3 38.9 ± 5.2 30.3 ± 3.9
Ethylparaben 1-50 0.9993 0.8 1.9 8.1 72.1 ± 13.8 56.6 ± 12.9
Propylparaben 1-50 0.9990 0.5 1.3 6.7 88.4 ± 9.9 68.0 ± 7.6
Butylparaben 1-50 0.9990 0.8 2.0 6.3 50.7 ± 8.9 41.1 ± 7.7
aLR = linear range; bR2 = square of correlation coefficient; cLOD = limit of detection (S/N = 3); dLOQ = limit of quantification (S/N = 10); eRSD = relative
the different economic activities along the Mogi Guaçu River (agribusiness, vegetable oils, drinks, meatpacking, pulp and paper industry) as well as disposal of treated or untreated sewage and wastewaters from the cities and industries, located near or on the edges of the river. In addition, it is believed that the drought period, that reached the São Paulo state in 2014,36 may have contributed to
the low volume of water in the Mogi Guaçu River, and consequently letting the river water less diluted, showing parabens contents in the order in µg L-1.
Conclusions
A DLLME-LDS and LC-DAD procedure was developed and applied in the extraction and analysis of four parabens (MP, EP, PP and BP) in surface river water samples. The Table 2. Comparison of the proposed DLLME-LDS and LC-DAD method with other methods used in determination of parabens
Method Compound (µg LLODa-1 / ) (µg LLOQb-1 / ) amount / mLSample Recovery / % EFc Extraction
time / min Reference
DLLME/GC-FIDd
methylparaben 15 50
10
25 100
10 18
ethylparaben 5 20 52 202
propylparaben 5 20 72 276
DLLME/LC-UVe
methylparaben 0.046 0.15
5
25 27
1 4
ethylparaben 0.043 0.14 48 50
propylparaben 0.022 0.07 67 70
butylparaben 0.021 0.07 86 90
SPE/GC-MSf
methylparaben 0.0005 −
1000
81.1 −
− 14
ethylparaben 0.0006 − 90.9 −
propylparaben 0.0005 − 91.2 −
butylparaben 0.0006 − 97.6 −
SFC-HS-SPME-GC-MSg
methylparaben 0.5 1.7
−
97.6 −
15 19
ethylparaben 2.0 6.6 90.6 −
propylparaben 8.3 27.5 91.2 −
butylparaben 8.3 27.7 99.6 −
SPME-GC-MSh
methylparaben 0.00170 −
10
86 −
12 22
ethylparaben 0.00088 − 91 −
propylparaben 0.00040 − 85 −
butylparaben 0.00057 − 88 −
SBSE/GC-MSi
methylparaben 1.06 3.22
−
102 −
240 23
propylparaben 0.74 1.56 110 −
butylparaben 0.08 2.26 104 −
DLLME-LDS/DADj
methylparaben 0.8 2.4
5
30.3 38.9
2 this work
ethylparaben 0.8 1.9 56.6 72.1
propylparaben 0.5 1.3 68.0 88.4
butylparaben 0.8 2.0 41.1 51.7
aLOD = limit of detection; bLOQ = limit of quantification; cEF = enrichment factor; ddispersive liquid-liquid microextraction combined with gas
chromatography-flame ionization detection; edispersive liquid-liquid microextraction combined with liquid chromatography with ultraviolet detection; fsolid phase extraction combined with gas chromatography-mass spectrometry; gsupercritical fluid extraction on-line headspace solid-phase microextraction
combined with gas chromatography-mass spectrometry; hsolid phase extraction combined with gas chromatography-mass spectrometry; istir-bar
sorptive extraction combined with gas chromatography-mass spectrometry; jdispersive liquid-liquid microextraction based on low density solvent liquid
chromatography with diode array detection.
DLLME using 1-octanol as the extraction solvent shows many advantages like being simple, fast, environmental-friendly, cost-effective, have very little solvent consumption in extraction, use of small sample volume and short analysis time. In optimum conditions, enrichment factors and recoveries of studied parabens were obtained in the range of 38.9 to 88.4% and 30.3 to 68.0%, respectively. The DLLME-LDS and LC-DAD method was applied in real surface river water samples collected on Mogi Guaçu River (São Paulo state, Brazil), showing average contents of 8.0, 5.8, 13.1 and 15.1 µg L-1, for MP, EP, PP, and BP,
respectively. The high levels of parabens in waters from Mogi Guaçu River can probably be explained by contamination from household sewage, industrial effluents and for the long period of drought. By our knowledge, this is the first report of these parabens in a long stretch of a Brazilian River (ca. 300 km of extension).
Supplementary Information
Supplementary Information is available free of charge at http://jbcs.sbq.org.br as PDF file.
Acknowledgements
This work was supported by Conselho Nacional de Desenvolvimento Científico e Tecnológico (CNPq). C. A. Galinaro thanks CNPq for the postdoc fellowship (process number 150540/2013-2). We are indebted to Tiago S.
Pinto for helping with the construction of a map of Mogi Guaçu River.
References
1. Hou, F.; Deng, X.; Jiang, X.; Yu, J.; J. Chromatogr. Sci. Adv.
2013, 1.
2. Wei, H.; Yang, J.; Zhang, H.; Shi, Y.; Chem. Res. Chinese Univ.
2014, 30, 368.
3. Prichodko, A.; Janenaite, E.; Smitiene, V.; Vickackaite, V.; Acta Chromatogr.2012, 24, 589.
4. Çabuk, H.; Akyüz, M.; Ata, Ş.; J. Sep. Sci.2012, 35, 2645. 5. Jain, R.; Mudiam, M. K. R.; Chauhan, A.; Ch, R.; Murthy, R. C.;
Khan, H. A.; Food Chem.2013, 141, 436.
6. Benijts, T.; Lambert, W.; de Leenheer, A.; Anal. Chem.2004, 76, 704.
7. Jonkers, N.; Sousa, A.; Galante-Oliveira, S.; Barroso, C. M.; Kohler, H. P. E.; Giger, W.; Environ. Sci. Pollut. Res.2010, 17, 834.
8. Jonkers, N.; Kohler, H. P. E.; Dammshäuser, A.; Giger, W.; Environ. Pollut.2009, 157, 714.
9. Saçmacı, Ş.; Kartal, S.; Dural, S.; J. Braz. Chem. Soc.2012,
23, 1033.
10. Kasprzyk-Hordern, B.; Dinsdale, R. M.; Guwy, A. J.; Water Res.2008, 42, 3498.
11. Peng, X.; Yu, Y.; Tang, C.; Tan, J.; Huang, Q.; Wang, Z.; Sci. Total Environ.2008, 397, 158.
12. Renz, L.; Volz, C.; Michanowicz, D.; Ferrar, K.; Christian, C.; Lenzner, D.; El-Hefnawy, T.; Ecotoxicology2013, 22, 632.
Table 3. City, contents, average contents and the sum of concentrations of parabens obtained in the analysis of real surface water samples
City (Site) MPa ± SDb /
(µg L-1)
EPc ± SDb /
(µg L-1)
PPd ± SDb /
(µg L-1)
BPe ± SDb /
(µg L-1)
Total parabens ± SDb /
(µg L-1)
Guatapará (1) < LODf 6.1 ± 0.5 1.6 ± 0.1 13.0 ± 0.8 20.7 ± 1.4
Rincão (2) 3.0 ± 0.3 2.1 ± 0.5 3.2 ± 0.2 < LODf 8.3 ± 1.0
Porto Ferreira (3) 2.5 ± 0.2 2.3 ± 0.2 18.3 ± 1.2 < LODf 23.1 ± 1.6
Porto Ferreira (4) < LOQg 2.6 ± 0.2 < LOQg < LODf 2.6 ± 0.2
Cachoeira de Emas (5) 2.7 ± 0.2 2.0 ± 0.2 1.4 ± 0.1 17.7 ± 1.1 23.8 ± 1.7
Cachoeira de Emas (6) 9.4 ± 0.8 < LODf 2.0 ± 0.2 < LODf 11.4 ± 1.0
Pirassununga (7) < LODf < LODf 45.6 ± 3.1 < LODf 45.6 ± 3.1
Martinho Prado (8) < LODf 2.4 ± 0.2 < LOQg 9.3 ± 0.6 11.7 ± 0.8
Mogi Guaçu (9) < LODf < LOQg < LODf 19.9 ± 1.3 19.9 ± 1.3
Mogi Guaçu (10) 27.5 ± 2.3 30.5 ± 2.5 2.8 ± 0.2 < LOQg 60.8 ± 5.0
Mogi Guaçu (11) NDh < LOQg 2.1 ± 0.2 < LOQg 2.1 ± 0.2
Mogi Guaçu (12) < LODf 1.9 ± 0.2 1.7 ± 0.1 15.5 ± 1.0 19.1 ± 1.3
Mogi Guaçu (13) 2.6 ± 0.2 2.2 ± 0.2 52.1 ± 3.5 < LODf 56.9 ± 3.9
Itapira (14) < LODf < LODf < LODf < LODf < LODf
Average 8.0 ± 0.7 5.8 ± 0.5 13.1 ± 0.9 15.1 ± 0.9 −
aMethylparaben; bSD: standard deviation (n = 3); cethylparaben; dpropylparaben; ebutylparaben; fLOD = limit of detection (S/N = 3); gLOQ = limit of
13. Loraine, G. A.; Pettigrove, M. E.; Environ. Sci. Technol.2006, 40, 687.
14. Ramaswamy, B. R.; Shanmugam, G.; Velu, G.; Rengarajan, B.; Larsson, D. G. J.; J. Hazard. Mater.2011, 186, 1586. 15. Blanco, E.; Casais, M. D. C.; Mejuto, M. D. C.; Cela, R.; Anal.
Chim. Acta2009, 647, 104.
16. http://www.sigrh.sp.gov.br/cbhmogi/apresentacao, accessed in August 2015.
17. Piao, C.; Chen, L.; Wang, Y.; J. Chromatogr. B2014, 969, 139. 18. Farajzadeh, M. A.; Djozan, D.; Bakhtiyari, R. F.; Talanta2010,
81, 1360.
19. Yang, T. J.; Tsai, F. J.; Chen, C. Y.; Yang, T. C. C.; Lee, M. R.; Anal. Chim. Acta2010, 668, 188.
20. González-Mariño, I.; Quintana, J. B.; Rodríguez, I.; Cela, R.; Water Res.2011, 45, 6770.
21. Maijó, I.; Borrull, F.; Aguilar, C.; Calull, M.; Electrophoresis
2013, 34, 363.
22. Regueiro, J.; Becerril, E.; Garcia-Jares, C.; Llompart, M.; J. Chromatogr. A2009, 1216, 4693.
23. Ferreira, A. M. C.; Möder, M.; Laespada, M. E. F.; J. Chromatogr. A2011, 1218, 3837.
24. Han, Y.; Jia, X.; Liu, X.; Duan, T.; Chen, H.; Chromatographia
2010, 72, 351.
25. Rezaee, M.; Assadi, Y.; Milani Hosseini, M.-R.; Aghaee, E.; Ahmadi, F.; Berijani, S.; J. Chromatogr. A2006, 1116, 1. 26. Farajzadeh, M. A.; Djozan, D.; Khorram, P.; Anal. Chim. Acta
2012, 713, 70.
27. Prichodko, A.; Šakočiūtė, V.; Vičkačkaitė, V.; Chemija2010, 21, 112.
28. Farajzadeh, M. A.; Seyedi, S. E.; Shalamzari, M. S.; Bamorowat, M.; J. Sep. Sci.2009, 32, 3191.
29. Yang, P.; Ren, H.; Qiu, H.; Liu, X.; Jiang, S.; Chem. Pap.2011, 65, 747.
30. Rezaee, M.; Yamini, Y.; Faraji, M.; J. Chromatogr. A2010, 1217, 2342.
31. Escudero, L. B.; Berton, P.; Martinis, E. M.; Olsina, R. A.; Wuilloud, R. G.; Talanta2012, 88, 277.
32. Zhang, Y.; Duan, J.; He, M.; Chen, B. H.; Talanta2013, 115, 730.
33. Asensio-Ramos, M.; Hernández-Borges, J.; Borges-Miquel, T. M.; Rodríguez-Delgado, M. Á.; J. Chromatogr. A2011, 1218, 4808.
34. Agilent Technologies; Agilent Solutions Guide2006, 19.
35. United States Department of Health and Human Services, Food and Drug Administration, Guidance for Industry. Q2B Validation of Analytical Procedures: Methodology; Rockville, MD Nov, 1996, 1.
36. http://www.tribunadopovo.com.br/saema-nao-descarta-racionamento-caso-nao-chova/, accessed in August 2015.
Submitted: May 7, 2015
Published online: August 18, 2015