Article
Printed in Brazil - ©2015 Sociedade Brasileira de Química0103 - 5053 $6.00+0.00A
*e-mail: gkhayatian@uok.ac.ir, gkhayatian@yahoo.com, shahed_hassanpoor110@yahoo.com
Optimization of Auxiliary Solvent Demulsification Microextraction for
Determination of Cyanide in Environmental Water and Biological Samples by
Microvolume UV-Vis Spectrophotometry
Shahed Hassanpoor,* Gholamreza Khayatian,* Raouf Ghavami and Elham Safaei
Department of Chemistry, Faculty of Science, University of Kurdistan, Sanandaj, Iran
A new, simple, rapid and efficient solvent terminated-auxiliary solvent-dispersive liquid-liquid microextraction (ST-AS-DLLME) technique for determination of cyanide ions by microvolume UV-Vis spectrophotometry was developed. Effective parameters on the extraction and absorbance of cyanide were optimized using two optimization methods: fractional factorial design (FFD) and central composite design (CCD). Zinc(II) tetraphenylporphyrine (ZnTPP) was used as a selective cyanide receptor agent. Methyl isobutyl ketone (MIBK), ethanol and 1-butanol were used as extraction solvent, dispersive solvent and demulsifier solvent, respectively. The method shows very good selectivity in presence of other species. The analytical curve was linear in the range of 4.0-130 µg L-1 with a limit of detection of 1.0 µg L-1. Relative standard deviation (RSD) of the method for ten replicate measurements of 100 µg L-1 of cyanide was 1.1%. The method was successfully applied for determination of cyanide in natural water and plasma samples with good spike recoveries.
Keywords: cyanide, demulsification microextraction, spectrophotometry, experimental
design, ZnTPP
Introduction
Cyanide is an important environmental contaminant that occurs in surface and ground waters as a result of the discharge of industrial wastes.1 The mechanism of cyanide
toxicity demonstrated that it binds to iron in cytochrome oxidase and prevents it from entering the mitochondrial electron-transport chain. Consequently, cyanide is extremely toxic and even relatively small amounts of this species are lethal to humans. The World Health Organization (WHO) has set the maximum contaminant level of 70 µg L-1
of cyanide in drinking water.2 Furthermore, one of the major
cyanide source in daily human activity is the inhaled smoke by cigarette smokers.3 Anoxia, headache, enlargement of
the thyroid glands and convulsions with the paralysis of the respiratory center in the brain are some of the symptoms associated with cyanide poisoning.4 Cyanide occurs in
water as hydrocyanic acid (HCN), the cyanide ion (CN–),
simple cyanides, metallocyanide complexes, and as simple chain and complex ring organic compounds. Free cyanide is defined as the sum of the cyanide present as HCN and
CN–, and the relative concentrations of these two forms
depend mainly on pH and temperature. Due to the pH of most natural waters, free cyanide in the form of HCN predominates. The apparent toxicity to aquatic systems of most simple cyanides and metallocyanide complexes is due mainly to the presence of HCN derived from dissociation, photodecomposition and hydrolysis.5 Therefore, free
cyanide is a much more reliable index of toxicity than total cyanide because total cyanide can include nitriles (organic cyanides) and relatively stable metallocyanide complexes. A variety of methods and techniques have been developed for the determination of cyanide, including chromatography,6 voltammetry,7 amperometry,8 fluorometry,9
ion selective electrode,10 mass spectrometry,11 capillary
electrophoresis,12 atomic absorption spectrometry1 and
UV-Vis spectrophotometry.4 Although some of these
years, many research efforts have been oriented towards the development of efficient, miniaturized and environmentally friendly sample preconcentration methods, such as solid-phase microextraction (SPME)13-15 and liquid-phase
microextraction (LPME).16-21 The main disadvantage of
LPME techniques is that most of them have a centrifugation step, which is the extra time-consuming step in the extraction. Recently, Li and co-workers22 developed solvent
terminated-dispersive liquid-liquid microextraction (ST-DLLME) which avoided centrifugation step, thereby simplifying operation and sped up the extraction procedure. At the same time, Kocúrová et al.23 devised an auxiliary solvent-dispersive
liquid-liquid microextraction (AS-DLLME) to adjust the density of the extraction solvent-auxiliary solvent mixture so that it reaches a higher density than water and it can be easily separated from the aqueous sample by centrifugation. In the present work, we combine the advantage of both solvent terminated and auxiliary solvent methods for invention of new method with solvent lighter than water for easy extraction and phase separation. However, most of the studies for extraction and determination of cyanide have been done with the traditional one factor at a time (OFAT) method, which is not a confident method for finding real optima. OFAT only gives a local knowledge of the phenomenon and often requires a much larger experimental effort.24 Thus, there
is now increasing attention replacing the traditional OFAT by chemometrics methods.25
In the present study, a novel solvent terminated-dispersive liquid-liquid microextraction based on auxiliary solvent (ST-AS-DLLME) technique was developed for determination of trace amounts of cyanide in environmental waters and plasma samples for the first time. The experimental variables in the extraction of cyanide were optimized using fractional factorial design (FFD) and central composite design (CCD). The determination of cyanide was done using microvolume UV-Vis spectrophotometric method at 618 nm.
Experimental
Instrumentation
The spectra were recorded using a double beam UV-Vis spectrophotometer (model SPECORD 250) equipped with a quartz microcell with black sidewalls (1 cm path length, 400 µL). Data collection was done by a single beam Jenway spectrophotometer (model 6320D) with the mentioned microcell. All pH measurements were achieved using a Metrohm E-691 digital pH meter with a combined glass electrode. Stirring of the sample solutions was carried out by a magnetic stirrer (Rodwell, Monostir).
Reagents and solutions
Nitric acid, phosphoric acid, propionic acid, sodium hydroxide, nitrobenzene, toluene, methyl isobutyl ketone (MIBK), acetone, ethanol (EtOH), methanol (MeOH), acetonitrile (ACN), 1-butanol, ethyl acetate, chloroform, potassium cyanide (KCN), and zinc acetate from Merck were used as received. The stock solution (1000 mg L-1)
of cyanide was prepared by dissolving appropriate amount of KCN in 0.001 mol L-1 NaOH to prevent the
formation of HCN vapor. Working solutions were made by sequential dilution of the stock solution with 0.001 mol L-1
sodium hydroxide. A solution of 0.001 mol L-1 zinc(II)
tetraphenylporphyrine (ZnTPP) was prepared by dissolving appropriate amounts of ZnTPP in extraction solvent as complexing agent. Phosphate buffer solution (0.05 mol L-1,
pH 12.0) was prepared by addition of an appropriate amount of sodium hydroxide (1.0 mol L-1) to phosphoric acid
solution. Other metal salts and solvents were analytical grade and also purchased from Merck.
Synthesis of ZnTPP
The porphyrin was synthesized according to previously reported methods by condensation of aromatic aldehyde and pyrrole.26-31 For synthesis of H
2TPP, 10 mmol benzaldehyde,
35 mL propionic acid and 15 mL nitrobenzene were added to a round-bottomed flask and 10 mmol pyrrole were added to this solution, then the mixture was refluxed for 2 h. The solution was allowed to crystallize overnight. The spectral data of H2TPP are as follows: UV-Vis (CH2Cl2) λmax / nm 418
(Soret band) and 516, 550, 590, 646 (Q bands); 1H nuclear
magnetic resonance (NMR) (400 MHz, CDCl3) d –2.76 (s,
2H, N–H), 7.75-7.77 (t, 8H, meta), 7.75-7.77 (d, 4H, para),
8.21-8.24 (d, 8H, ortho), 8.85 (s, 8H, β); Fourier transform infrared spectroscopy (FTIR) (KBr) νmax / cm-1 3320
(N–H). For synthesis of ZnTPP, a solution containing 1 mmol zinc acetate in 17 mL of methanol was prepared. Then, 0.75 mmol H2TPP were dissolved in 50 mL of CH3Cl
and both solutions were added to a round-bottomed flask and were refluxed for 8 h. The spectral data of ZnTPP are as follows: UV-Vis (DMF) λmax / nm 418 (Soret band), 590 (Q band); 1H NMR (400 MHz, CDCl
3) d 7.75-7.77 (t, 8H, meta), 7.75-7.77 (d, 4H, para), 8.21-8.24 (d, 8H, ortho),
8.85 (s, 8H, β). Figure 1 shows a scheme of the structure of ZnTPP and its interaction with cyanide ions.
Preparation of the environmental water samples
water (Zam Zam, Iran) and drinking water (Lahijan, Iran) were collected in polyethylene bottles. The sea and river water samples were immediately filtered using cellulose filter paper (Whatman, grade 42, 2.5 µm) to remove any suspended and colloidal particulate matter. All water samples were stored in the refrigerator when not in use. In order to determine the free cyanide, 20 mL samples were treated under the optimized method.
Preparation of the plasma samples
Careful sample preparation and storage of biological samples containing cyanide or its metabolites are key elements to produce accurate results. Because of various metabolic reactions of cyanide from biological samples, the analysis of the sample should be made as soon as possible.32
For separation of plasma from whole blood, freshly drawn heparinized blood was used for cyanide determination. The blood was transferred to a centrifuge tube, and after centrifugation for 10 min, the plasma was removed from the top of the tube.33 For cyanide determination in plasma
by the proposed method, 4.0 mL of the samples were immediately placed into a 25.0 mL volumetric flask, and after addition of 16.0 mL distilled water, the samples were treated under the optimized method.
General procedure
In a 25 mL volumetric flask, 20.0 mL of 100 µg L-1
cyanide solution or real sample, 1.0 mL of 0.05 mol L-1
phosphate buffer pH 12.0 and 100 µL of ligand and extraction solvent mixture (0.001 mol L-1 ZnTPP in
MIBK) were added. Then, 0.50 mL of disperser solvent (ethanol) were rapidly injected into the sample solution using a 1.00 mL syringe. The flask was put on the stirrer for 10 min at speed of 1000 rpm. A cloudy emulsion (water, extraction solvent and disperser solvent) was formed in the flask. After this, 2.5 mL of demulsifier solvent (1-butanol) were injected on the surface of the
stirred mixture. Then, the emulsion was broken and two clear phases appeared immediately. The floating green extractant (ca. 270 µL) was collected with a 1.00 mL syringe and diluted to 400 µL with ethanol. Next, the final solution was injected into the quartz microcell and the absorbance of the solution was measured against a blank by UV-Vis spectrophotometer at 618 nm. The blank solution was run under the same condition as well.
Results and Discussion
In order to evaluate high recovery and absorbance for cyanide, the composition of solvents (extraction, disperser and demulsifier) for extraction of cyanide was investigated as a substantial parameter in the first step. For searching the optimal experimental conditions of other main factors affecting the recovery of cyanide, such as volume of extraction solvent, volume of dispersive solvent, volume of demulsifier solvent, pH, concentration of ligand, stirring rate, stirring time and salt addition, a design with two steps (screening and optimization) was used. For this purpose, the Minitab 16.2.2 (Minitab Inc., LEAD Technologies, Inc.) statistical package was used to generate the experimental matrix and to evaluate the results.
There are some studies that used ZnTPP for determination of cyanide, such as ion selective electrodes and colorimetric sensors.10,34,35 In the present work, a novel
dispersive liquid-liquid microextraction technique was developed for determination of trace amounts of cyanide for the first time. Figure 2 shows the absorption spectra for the cyanide-ZnTPP complex and ZnTPP against a reagent blank as reference. The results indicate that maximum absorbance of cyanide-ZnTPP complex is at 618 nm, thus this wavelength was chosen for colorimetric determination of cyanide ions.
N
N N
N Zn CN
-Figure 1. Structure of ZnTPP and its interaction with cyanide ions.
0 0.05 0.1 0.15
0.2 0.25 0.3
580 600 620 640 660 680
Absorbance
Wavelength / nm
(a) (b)
Figure 2. (a) Absorption spectrum of ZnTPP after extraction in the absence of cyanide (MIBK as blank), and (b) absorption spectrum of the cyanide-ZnTPP complex after extraction (extracted cyanide-ZnTPP to be used as blank).
0 0.05 0.1 0.15
0.2 0.25 0.3
580 600 620 640 660 680
Absorbance
Wavelength / nm (a)
Selection of composite of solvents
The type of extraction solvent is critical for developing an efficient DLLME procedure since the physicochemical properties of extraction solvent control the emulsion conditions and consequently, the extraction efficiency.36,37
Five low-density solvents (toluene, cyclohexane, n-hexane,
octanol and MIBK) differing in polarity and water solubility were tested for this purpose. In the same experimental condition, the absorbance results for toluene and MIBK were better than other extraction solvents and these solvents were selected for subsequent optimization experiments. The organic solvent disperses into the aqueous bulk as tiny droplets, which enhance the contact between both entities, achieving rapid extraction. The miscibility of disperser in both organic solvent and water is the main point of effective emulsion formation.22 Therefore, acetone, acetonitrile,
methanol and ethanol were investigated as disperser solvents. In ST-AS-DLLME, instead of a ternary component solvent system, a quaternary system consisting of an aqueous sample, an extraction solvent, an auxiliary solvent and a disperser solvent is employed. The auxiliary solvent was used to adjust the density of organic phase for easy phase separation. The benefits of this approach are: (i) it
does not require the use of special homemade devices; (ii) it enables separation of phases without centrifugation;
and (iii) it can be applied to the extraction of analyte
with the subsequent UV-Vis detection. For this reason,
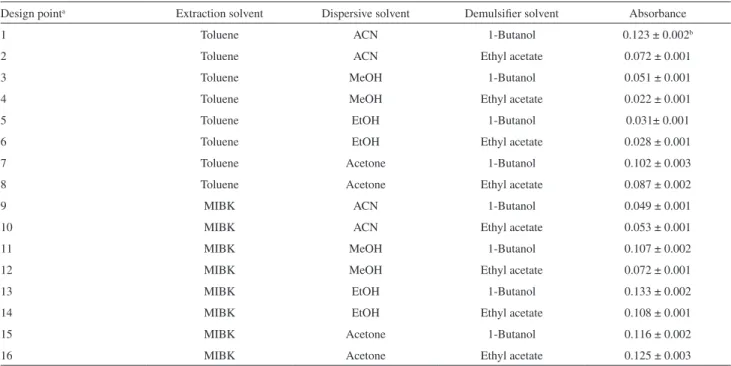
1-butanol, ethyl acetate, octanol, acetonitrile, acetone, ethanol and methanol were studied as auxiliary solvents for the demulsification stage. Among these solvents, the absorbance with 1-butanol and ethyl acetate were higher than the others, and these solvents were selected for subsequent optimization experiments. Table 1 shows the experimental results obtained for indicating the best solvent composition for extraction of cyanide. As can be seen, the maximum absorbance for cyanide was obtained with the employment of MIBK, ethanol and 1-butanol, as extraction solvent, disperser solvent and demulsifier solvent, respectively.
Experimental design
In this study, the optimization involved the maximization of the absorbance, which assumed to be a function of several independent variables. Many methods have achieved this purpose. Among these methods, the most commonly utilized by chemists is the technique of experimental design.38-40
Fractional factorial design (FFD)
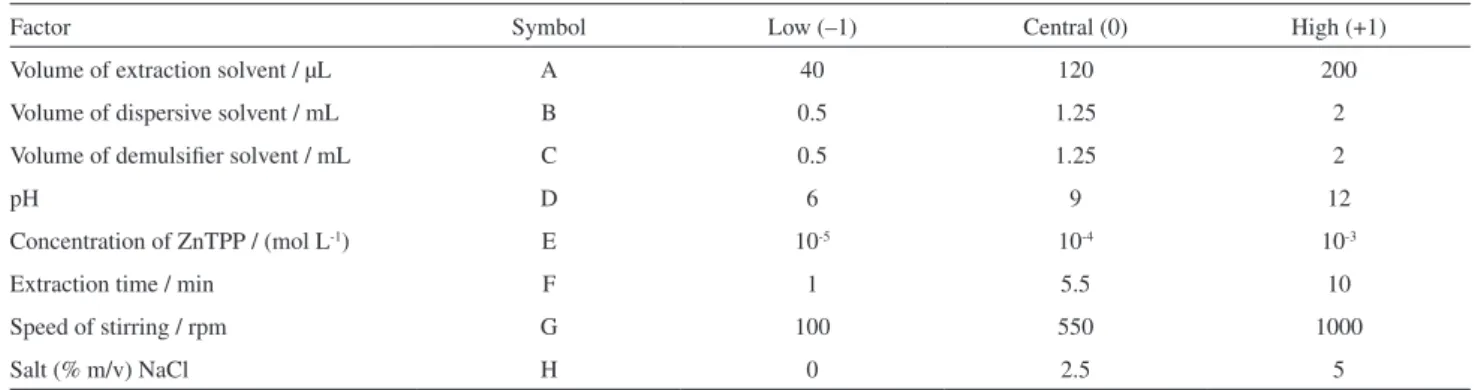
In the first step, the main factors affecting the extraction and absorbance of cyanide were determined. The main factors, their symbols and levels are shown in Table 2.
As can be seen in Table 2, each variable was set at two possible levels, high and low, thus there are 256 (28) Table 1. Experimental results for the selection of the best extraction, disperser and demulsifier solvent composition (n = 3)
Design pointa Extraction solvent Dispersive solvent Demulsifier solvent Absorbance
1 Toluene ACN 1-Butanol 0.123 ± 0.002b
2 Toluene ACN Ethyl acetate 0.072 ± 0.001
3 Toluene MeOH 1-Butanol 0.051 ± 0.001
4 Toluene MeOH Ethyl acetate 0.022 ± 0.001
5 Toluene EtOH 1-Butanol 0.031± 0.001
6 Toluene EtOH Ethyl acetate 0.028 ± 0.001
7 Toluene Acetone 1-Butanol 0.102 ± 0.003
8 Toluene Acetone Ethyl acetate 0.087 ± 0.002
9 MIBK ACN 1-Butanol 0.049 ± 0.001
10 MIBK ACN Ethyl acetate 0.053 ± 0.001
11 MIBK MeOH 1-Butanol 0.107 ± 0.002
12 MIBK MeOH Ethyl acetate 0.072 ± 0.001
13 MIBK EtOH 1-Butanol 0.133 ± 0.002
14 MIBK EtOH Ethyl acetate 0.108 ± 0.001
15 MIBK Acetone 1-Butanol 0.116 ± 0.002
16 MIBK Acetone Ethyl acetate 0.125 ± 0.003
possible combinations in full factorial designs. This full factorial design is too large to carry out experimentally. For this reason, 28–4 fractional factorial designs were used
in our experiments and these runs were done in a random manner to minimize the effect of uncontrolled variables. For investigation of error estimate and curvature in the response, three center points were added to the design matrix. The design matrix and the responses are shown in Table S1 (in the Supplementary Information (SI) section). The analysis of variance (ANOVA) calculated with Minitab software package is shown in Table S2. In this table, values of p < 0.05 indicate that the model terms are significant.
Therefore, the main effects of A, C, D, E, F, G and H are large and the two factor interactions AE, AF, AG, and AH also appear to be important. Normal plot of these effects also shows that they are the only ones to influence the absorbance of cyanide-ZnTPP complex (Figure 3).
The negative effect of salt (H) on the absorbance of cyanide was distinguished in the normal plot, thus the subsequent experiments were done without salt addition. ZnTPP (E) concentration, extraction time (F) and speed
of stirring (G) have positive effects (0.01188, 0.01362 and 0.01987, respectively) so, high levels of these factors (10-3 mol L-1, 10 min and 1000 rpm, respectively) were
selected in the further experiments. With these results and screening, the three important factors in extraction and determination of cyanide were volume of extraction solvent (A), volume of demulsifier solvent (C) and pH (D). Thus, for a more accurate investigation, central composite design was used for optimization of these factors in the next step.
Central composite design (CCD)
It is clear from Table S2 that the curvature of the fractional factorial design model is significant. Therefore, a design is needed with more levels. Two-level designs can only lead to linear models of responses and so cannot give information about maxima or any non-linear relationships. Central composite designs require 2k factorial points (also
called cube points) + 2k axial points (also called star points) + nc center points run of experiments.24,39,40 The
factors, their levels, symbols and design matrix for central composite designs are shown in Tables S3 and S4. The central composite designs allow estimation of the constant, the linear terms, the interactions between variables and the quadratic terms, according to the following model (equation 1):
j k 1− − i k i k
2 0 i i ij i j ii i
i 1 i 1 j i 1
R β β x β x x β x ε
i k=
i
= =
− = − =
= +
∑
+∑ ∑
+∑
+ (1)In this equation, R is the response value and ε is random variance. For this study, equation 2 shows the relation between cyanide absorbance and factors in coded value:
Absorbance = 0.146018 + 0.001682A+ 0.034232C + 0.019693D – 0.012144A2 – 0.011957C2 – 0.004832D2 –
0.003125AC – 0.002875AD + 0.003625CD + ε (2)
Table 2. Factors, their levels and symbols for fractional factorial design
Factor Symbol Low (–1) Central (0) High (+1)
Volume of extraction solvent / µL A 40 120 200
Volume of dispersive solvent / mL B 0.5 1.25 2
Volume of demulsifier solvent / mL C 0.5 1.25 2
pH D 6 9 12
Concentration of ZnTPP / (mol L-1) E 10-5 10-4 10-3
Extraction time / min F 1 5.5 10
Speed of stirring / rpm G 100 550 1000
Salt (% m/v) NaCl H 0 2.5 5
Factors: 8; resolution with blocks: IV; runs: 19; replicates: 1; fraction: 1/16; blocks: 1; center points (total): 3.
50 40 30 20 10 0 -10 -20 -30 -40 99
95
90
80 70 60 50 40 30 20
10
5
1
Standardized effect
Percent
AH
AG
AF
AE
H
G
F E
D
C
A
Figure 3. Normal plot obtained from the results of fractional factorial design (alpha = 0.05, not significant, and significant).
50 40 30 20 10 0 -10 -20 -30 -40 99
95 90
80 70 60 50 40 30 20
10 5
1
Standardized effect
Percent
AH
AG
AF
AE
H
G
F E
D
C
In the absorbance equation, the volume of demulsifier solvent is the most important factor. The analysis of variance (ANOVA) calculated with Minitab software package is shown in Table S5. In this table, the p value of
regression of the model was significant and the lack-of-fit of the model was not significant. From these results, the efficiency of the model was inferred.
Response surface and selection of optimum condition The obtained regression model was used to calculate the three dimensional (3D) two-factor response surface, when one of the variables is fixed at the central point and the others are allowed to vary (Figure 4).
This Figure shows the existence of maximum in the absorbance and interaction between the factors. Figures 4a and 4b show that the maximum absorbance was obtained at 100 µL volume of extraction solvent. In higher and lower volumes of extraction solvent, the absorbance decreases. Therefore, in the subsequent studies, 100 µL were selected as an optimum volume of the extraction solvent. Figures 4a and 4c show the great importance of demulsifier solvent volume in the absorbance of cyanide complex. The absorbance increases by increasing the volume of demulsifier solvent up to 2.50 mL and then decreases. The increase in cyanide absorbance by increasing the volume of demulsifier is due to a more efficient phase separation, and the decrease in absorbance in high volume of demulsifier is probably due to an increase in ZnTPP-CN complex solubility in the aqueous phase. As can be seen in Figures 4b and 4c, pH is an important factor in extraction of cyanide and the maximum absorbance is obtained in alkaline media, being probably due to protonation of HCN (pKa 9.1) at acidic pH that decreases the amount of CN– ion in the
sample solution. At higher pH values, the absorbance signal gradually increases, due to formation of free cyanide at these pH. On the other hand, no interference from OH– was
observed even at pH 12.0. In 2012, Chen et al.10 reported
that the zinc(II) tetraphenylporphyrin-based CN–-selective
electrodes exhibited the best discrimination of CN– over
OH– that is probably due to high binding affinity CN– to
ZnTPP over OH–. Therefore, pH 12.0 was chosen for
subsequent experiments and the pH adjustment was carried out by addition of 1.00 mL of 0.05 mol L-1 phosphate
buffer at pH 12.0 to the sample solution. Therefore, according to the screening, optimization study and global solution of Minitab software response optimizer, 100 µL of extraction solvent, 0.50 mL of dispersive solvent, 2.50 mL of demulsifier solvent, pH 12.0, 10-3 mol L-1 solution of
ZnTPP in MIBK, 10 min extraction time, stirring rate of 1000 rpm and 0.00% of salt were selected as the optimum values for determination and extraction of cyanide.
Effect of diverse ions
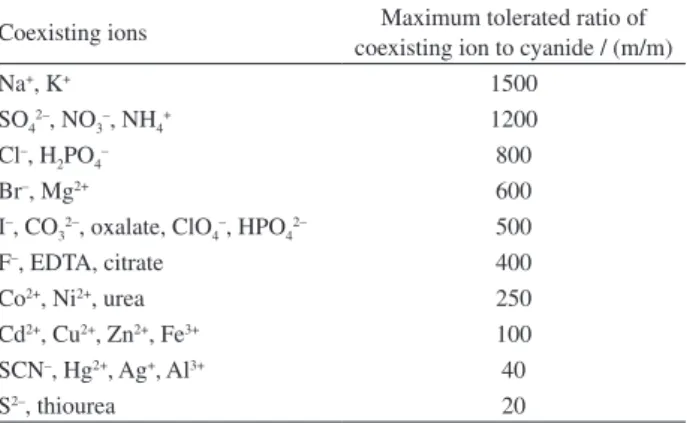
The effects of common potentially interfering ions on the extraction of cyanide were also studied. In these experiments, 20.00 mL of solutions containing cyanide (100 µg L-1) and
various amounts of diverse ions were treated according to the recommended procedure under optimum condition. A given species was considered to interfere if it resulted in a ±5% variation of the absorbance signal. As shown in Table 3, most of the cations, anions and organic species have minimal or no obvious influence on the determination of cyanide under the selected conditions and the proposed method is 2.8
0.0 1.4
0.1
0.00 0.2
0.13 0.0
0.26 Abs
C
A
14 10 0.0
0.1
0.00 0.2
6 0.13
0.26 Abs
D
A
14 10 0.0
0.1
0.0 0.2
6 1.4
2.8 Abs
D
C
(a)
(b)
(c)
Figure 4. 3D Central composite design plots for the effects of variables on recovery of cyanide.
2.8
0.0 1.4
0.1
0.00 0.2
0.13 0.0
0.26 Abs
C
A
14
10 0.0
0.1
0.00 0.2
6 0.13
0.26 Abs
D
A
14
10 0.0
0.1
0.0 0.2
6 1.4
2.8 Abs
D
C
(a)
(b)
highly selective in the presence of different species, such as SCN–, NO
3– and S2– that strongly interfere in determination
of CN– in many reported methods.1,2 This may be due to
formation of a highly stable complex between zinc in the ZnTPP and cyanide ions in the experimental conditions.41
Chen et al.10 confirmed that the selectivity of ZnTPP toward
cyanide is much greater than other ions (log K1:1 (mol kg-1)-1
for CN–, OH– and S2– are 6.4, 5.6 and 4.7, respectively). Thus,
it is not surprising that other cations and or anions cannot significantly interfere in the extraction of cyanide from aqueous solution in the appropriate condition.
Analytical figures of merit
The analytical characteristics of the proposed method, including linear dynamic range (LDR), limit of detection (LOD), limit of quantification (LOQ), relative standard deviation (RSD), coefficient of determination (R2) and
enrichment factor were obtained. Under the optimum
experimental conditions, the analytical curve was achieved by analyzing 20.00 mL of cyanide standard solution containing a known amount of target ion in the range of 1.0-170 µg L-1. The analytical curve was
linear in the range of 4.0-130 µg L-1 with a correlation
coefficient (R2) of 0.998 (n = 9). The regression equation
was A = (3.69 ± 0.05)C – (0.002 ± 0.003), where A is the absorbance and C is the concentration of cyanide in µg mL-1. The limit of detection (n = 10, LOD = 3σ
blank / m)
and limit of quantification (n = 10, LOQ = 10σblank / m), where m is the slope of the analytical curve in accordance to IUPAC recommendation, were 1.0 and 3.4 µg L-1,
respectively. RSD for ten replicate measurements of 100 µg L-1 of cyanide ions was 1.1%. The recovery
of extraction was 97.6%, calculated according to: (Co Vo) / (Ca Va) × 100, where Co and Ca are the concentrations of cyanide in organic and aqueous phase solution, and Vo
and Va are the volumes of the organic and aqueous phase, respectively. The enrichment factor based on the ratio of cyanide ion concentration in 400 µL final organic solution to that in the initial bulk phase is 50.
Applications
The recommended method was successfully applied for the determination of cyanide in different samples such as water and plasma. Since there is not a certified reference material with certified concentrations of CN– ions, which
could be considered as a representative sample, a spike recovery study seems to be suitable to estimate the accuracy of the proposed method. The results with the recovery for the spiked samples are given in Table 4. As can be seen, the added CN– was quantitatively recovered from all samples.
Table 4. Application of proposed method for analysis of environmental water and plasma samples (n = 3)
Sample Cyanide added / (µg L-1) Cyanide found / (µg L-1) Recovery / % Tap water
(Lahijan)
0.00 20.0 100.0
5.73 ± 0.20a 25.14 ± 0.30 104.58 ± 1.30
– 97.1 98.9 Mineral water
(Zam Zam)
0.00 20.0 100.0
7.15 ± 0.10 28.06 ± 0.30 105.83 ± 0.90
– 104.5
98.7 River water
(Sepid Rood)
0.00 20.0 100.0
12.69 ± 0.10 31.63 ± 0.20 111.54 ± 1.60
– 94.7 98.9 Sea water
(Caspian sea)
0.00 20.0 100.0
21.71 ± 0.50 42.12 ± 0.70 124.37 ± 1.50
– 102.1 102.7 Plasma
(Non-smoker specimen)
0.00 70.0
n. d.b 67.25 ± 1.20
– 96.1 Plasma
(Smoker specimen)
0.00 70.0
n. d.b 68.54 ± 1.10
– 97.9 aMean ± standard deviation; bn. d.: not detected.
Table 3. Effect of coexisting ions on the extraction of 100 µg L-1 cyanide
Coexisting ions Maximum tolerated ratio of coexisting ion to cyanide / (m/m)
Na+, K+ 1500
SO42–, NO3–, NH4+ 1200 Cl–, H
2PO4– 800
Br–, Mg2+ 600
I–, CO
32–, oxalate, ClO4–, HPO42– 500
F–, EDTA, citrate 400
Co2+, Ni2+, urea 250
Cd2+, Cu2+, Zn2+, Fe3+ 100 SCN–, Hg2+, Ag+, Al3+ 40
These results indicate the validity of the recommended methodology for analysis of cyanide in real samples. According to the results for plasma sample analysis, the cyanide values in plasma were below the limit of detection and not significantly different in the two smoker and nonsmoker groups. These may be due to existence of cyanide in blood in erythrocytes (red blood cells) by binding to methemoglobin and formation of cyanomethemoglobin that was reported in previous studies.32,33 As can be seen, the
added CN– was quantitatively recovered from both plasma
samples. These results indicate the validity of the proposed methodology for analysis of cyanide in real samples.
Comparison with the other methods
The developed method was compared with the other reported cyanide determination methods in Table 5. As can be seen, the proposed procedure shows a very good limit of detection, wide linear dynamic range and good precision, which are better in most cases or are comparable with other reported methods. Likewise, easy sample preparation, good preconcentration factor, low detection time, simplicity, high selectivity and low cost of spectrophotometric detection system makes this method suitable for measuring the concentration of cyanide in various environmental and biological samples.
Conclusions
It can be concluded from the results that the new ST-AS-DLLME was successfully used for preconcentration and determination of trace amounts of cyanide in different samples, even from complex matrices, like biological ones,
with acceptable accuracy and recovery. The determination is also successful in solutions containing sulfide and thiocyanate in which other methods fail. On the other hand, the determination of cyanide in alkaline solution causes many cations, such as Fe3+, Co2+, Ag+, Zn2+, Cu2+ and Hg2+,
which form cyanide complexes, to not interfere in this pH range. In this method, the optimization of extraction was done based on chemometric methods such as design of experiments (DOE) that evaluate the interactions of possible influencing factors on treatment efficiency with a limited number of experiments. As a result, applying an experimental design method to a microextraction technique can save time, lower consumption of hazardous reagents and also decreases the analytical cost.
Supplementary Information
Supplementary information is available free of charge at http://jbcs.sbq.org.br as PDF file.
References
1. Gurkan, R.; Yılmaz, O.; J. Iran. Chem. Soc. 2013, 10, 631. 2. Jain, A.; Pillai, A. K. K. V.; Sharma, N.; Verma, K. K.; Talanta
2010, 82, 758.
3. Themelis, D. G.; Tzanavaras, P. D.; Anal. Chim. Acta2002, 452, 295.
4. Agrawal, O.; Sunita, G.; Gupta, V. K.; J. Chin. Chem. Soc.2005, 52, 51.
5. United States Environmental Protection Agency (US EPA);
Ambient Water Quality Criteria for Cyanide; Office of Water Regulations and Standards Criteria and Standards Division: Washington, D. C., January, 1985.
Table 5. Characteristic performance data obtained by using the proposed and other reported methods for cyanide determination
Analytical technique LOD / (µg L-1) LDR / (µg L-1) RSD / % Reference
CPE-FAASa 3.75 20-8500 3.8-5.6 1
UV-Vis 4.3 25-500 3.9 2
SDME-CEb 2.08 6.5-520 4.3-6.8 12
FIc-amperometry 0.2 1-100 1.5 42
UV Vis 16 50-2000 2.3 43
SPME-GC-MSd 6 10-10000 < 8 44
LC-MS-MSe 10 26-2600 0.7-2.6 45
SPE-DPPf 40 60-480 9 46
GC-MS 20 260-520 < 9 47
ST-AS-DLLME-UV-Vis 1.0 4-130 1.1 This work
6. Sumiyoshi, K.; Yagi, T.; Nakamura, H.; J. Chromatogr. A1995,
690, 77.
7. Sousa, M. F. B.; Godinho, O. E. S.; Aleixo, L. M.; Electroanalysis 1995, 7, 1095.
8. Polta, J. A.; Johnson, D. C.; Anal. Chem. 1985, 57, 1373. 9. Miralles, E.; Prat, D.; Compano, R.; Granados, M.; Analyst
1997, 122, 553.
10. Chen, L. D.; Zou, X. U.; Buhlmann, P.; Anal. Chem. 2012, 84,
9192.
11. Minakata, K.; Nozawa, H.; Gonmori, K.; Yamagishi, I.; Suzuki, M.; Hasegawa, K.; Watanabe, K.; Suzuki, O.; Anal. Bioanal. Chem.2011, 400, 1945.
12. Jermak, S.; Pranaityte, B.; Padarauskas, A.; Electrophoresis 2006, 27, 4538.
13. Sarafraz-Yazdi, A.; Amiri, A.; TrAC, Trends Anal. Chem.2010,
29, 1.
14. Aguinaga, N.; Campillo, N.; Vinas, P.; Hernández-Córdoba, M.;
Anal. Chim. Acta 2007, 596, 285.
15. Hii, T. M.; Basheer, C.; Lee, H. K.; J. Chromatogr. A2009,
1216, 7520.
16. Khayatian, G.; Hassanpoor, S.; J. Chin. Chem. Soc.2012, 59, 659.
17. Berijani, S.; Assadi, Y.; Anbia, M.; Hosseini, M. R. M.; Aghaee, E.; J. Chromatogr. A2006, 1123, 1.
18. Jahromi, E. Z.; Bidari, A.; Assadi, Y.; Hosseini, M. R. M.; Jamali, M. R.; Anal. Chim. Acta 2007, 585, 305.
19. Rivas, R. E.; Lopez-Garcia, I.; Hernandez-Cordoba, M.;
Spectrochim. Acta, Part B2009, 64, 329.
20. Khayatian, G.; Hassanpoor, S.; J. Iran. Chem. Soc.2013, 10, 113.
21. Khayatian, G.; Hosseini, S. S.; Hassanpoor, S.; J. Iran. Chem. Soc.2013, 10, 1167.
22. Chen, H.; Chen, R.; Li, S.; J. Chromatogr. A2010, 1217, 1244. 23. Kocúrová, L.; Balogh, I. S.; Škrlíková, J.; Posta, J.; Andruch, V.;
Talanta 2010, 82, 1958.
24. Leardi, R.; Anal. Chim. Acta2009, 652, 161.
25. Panagiotou, A. N.; Sakkas, V. A.; Albanis, T. A.; Anal. Chim. Acta2009, 649, 135.
26. Adler, A. D.; Longo, F. R.; Shergalis, W.; J. Am. Chem. Soc. 1964, 86, 3145.
27. Adler, A. D.; Sklar, L.; Longo, F. R.; Finarelli, J. D.; Finarelli, M. G.; J. Heterocycl. Chem.1968, 5, 669.
28. Adler, A. D.; Longo, F. R.; Finarelli, J. D.; Goldmacher, J.; Assour, J.; Korsakoff, L.; J. Org. Chem.1967, 32, 476.
29. Sun, Z.; She, Y.; Zhou, Y.; Song, X.; Li, K.; Molecules2011,
16, 2960.
30. Falvo, R. E.; Mink, L. M.; Marsh, D. F.; J. Chem. Educ.1999,
76, 237.
31. He, C.; He, Q.; Deng, C.; Shi, L.; Zhu, D.; Fu, Y.; Cao, H.; Cheng, J.; Chem. Commun.2010, 46, 7536.
32. Logue, B. A.; Hinkens, D. M.; Baskin, S. I.; Rockwood, G. A.;
Crit. Rev. Anal. Chem.2010, 40, 122.
33. Lundqulst, P.; Rosllng, H.; Sorbo, B.; Clin. Chem. 1985, 31, 591.
34. Xu, Z.; Chen, X.; Kim, H.; Yoon, J.; Chem. Soc. Rev.2010, 39, 127.
35. Yoon, H.; Lee, C.; Jeong, Y.; Gee, H.; Jang, W.; Chem. Commun. 2012, 48, 5109.
36. Xia, Y.; Cheng, M.; Guoa, F.; Wanga, X.; Cheng, J.; Anal. Chim. Acta 2012, 724, 47.
37. Kokya, T. A.; Farhadi, K.; J. Hazard. Mater. 2009, 169, 726. 38. Morgan, E. D.; Chemometrics: Experimental Design, Analytical
Chemistry by Open Learning; John Wiley & Sons: Chichester, 1991.
39. Hibbert, D. B.; J. Chromatogr. B2012, 910, 2.
40. Araujo, P.; Couillard, F.; Leirnes, E.; Ask, K.; Bøkevoll, A.; Frøyland, L.; J. Chromatogr. A2006, 1121, 99.
41. Chatterjee, S.; Sengupta, K.; Bhattacharyya, S.; Nandi, A.; Samanta, S.; Mittra, K.; Dey, A.; J. Porphyrins Phthalocyanines 2013, 17, 210.
42. Solujic, L.; Milosavljevic, E. B.; Straka, M. R.; Analyst1999,
124, 1255.
43. Hamza, A.; Bashammakh, A. S.; Al-Sibaai, A. A.; Al-Saidi, H. M.; El-Shahawi, M. S.; Anal. Chim. Acta 2010, 657, 69.
44. Frison, G.; Zancanaro, F.; Favretto, D.; Ferrara, S. D.; Rapid. Commun. Mass Spectrom.2006, 20, 2932.
45. Lacroix, C.; Saussereau, E.; Boulanger, F.; Goullé, J. P.; J. Anal. Toxicol. 2011, 35, 143.
46. Bohrer, D.; Nascimento, P. C.; Pomblum, S. G.; Seibert, E.; Carvalho, L. M.; Fresenius’ J. Anal. Chem. 1998, 361, 780.
47. Bhandari, R. K.; Oda, R. P.; Youso, S. L.; Petrikovics, I.; Bebarta, V. S.; Rockwood, G. A.; Logue, B. A.; Anal. Bioanal. Chem. 2012, 404, 2287.
Submitted: October 25, 2014