319
Integrity of fluvial fish communities is subject to environmental gradients in
mountain streams, Sierra de Aroa, north Caribbean coast, Venezuela
Douglas Rodríguez-Olarte*, Ahyran Amaro*, Jorge Coronel*
and Donald C. Taphorn B.**
We examined physical habitat and fish assemblages in rivers of the Aroa Mountains (Venezuela) with different levels of environmental protection due to the creation of Yurubí National Park within the drainage. We developed an Index of Biotic Integrity (IBI) and evaluated it using principal components analysis (PCA) and canonical correspondence analysis (CCA). Tributary rivers were divided into classes according to their origin (protected by the park) and physical characteristics of each, including substrate. Fishes were captured using standardized electrofishing. Fish communities showed greater species rich-ness in heterogeneous habitat and protected rivers but overall abundance was higher in unprotected and impacted rivers. The IBI was sensitive to these differences and the scores were higher in protected rivers. The IBI detected degree of disturbance of fish communities without direct consideration of habitat parameters measured. The PCA revealed a gradient in substrate heterogeneity. Similarly, CCA revealed differences in fish assemblage composition along the environmental gradient and that varied with protection status of the river. The relationship between PCA and IBI scores was highly significant (r2 = 0.61, P < 0.0001). The PCA and CCA analysis moderately validated the structure and predictability of IBI; but it is still necessary to refine the model and to extend its application for more time and over a wider area.
Foram avaliados o ambiente físico e as assembléias de peixes em rios das montanhas Aroa (Venezuela) com diferentes níveis de proteção ambiental devido a criação do Parque Nacional Yurubí nesta drenagem. Foi desenvolvido um Índice de Integridade Biótica (IBI), avaliado através da análise de componentes principais (PCA) e análise de correspondência canônica (CCA). Rios tributários foram divididos em classes, de acordo com sua origem (proteção pelo Parque) e características físicas, incluindo o substrato. Peixes foram capturados utilizando-se pesca-elétrica padronizada. As comunidades de peixes mostraram maior riqueza de espécies em habitats heterogêneos e rios protegidos, porém a abundância foi maior em áreas não protegidas e rios não impactados. O IBI foi sensível a estas diferenças e os escores foram mais elevados em rios protegidos. O IBI detectou o grau de distúrbio nas comunidades de peixes sem a consiedração direta dos parâmetros de habitat medidos. O PCA revelou um gradiente de heterogeneidade no substrato. De modo similar, a CCA revelou diferenças na composição da assembélia de peixes ao longo do gradiente ambiental que variou com o estatus de proteção do rio. A relação entre os escores de PCA e IBI foi altamente significativa (r2 = 0.61, P < 0.0001). As análises de PCA e CCA validaram moderadamente a estrutura e a previsibilidade do IBI; porém, é necessário refinar o modelo e estender este aplicativo por mais tempo e área mais abrangente.
Key words: Index of Biotic Integrity, Habitat characterization, Multivariate analysis, National Park.
* Colección Regional de Peces. CPUCLA. Laboratorio de Ecología. Departamento de Ciencias Biológicas. Decanato de Agronomía. Universidad Centroccidental Lisandro Alvarado, UCLA. Barquisimeto, Estado Lara, Venezuela. Dirección Actual: Museo Nacional de Ciencias Naturales, CSIC. Departamento de Ecología Evolutiva. C/. José Gutiérrez Abascal, 2. ES-28066 Madrid. España. e-mail: douglasrodriguez@ucla.edu.ve
**Museo de Ciencias Naturales Guanare. MCNG. Vice-Rectorado de Producción Agrícola. UNELLEZ. Mesa de Cavaca, Portuguesa. Venezuela. e-mail: taphorn@gmail.com
Introduction
The conservation status of a watershed has direct and mea-surable effects on the fluvial ecosystem and fish communities. Colonization and residence of organisms are determined by a physical and biological gradient in the hydrosystem continuum
and by local habitat conditions. The assemblage of species that make up fish communities is attributed mostly to substrate composition, water type and velocity, but also, the degree of conservation and land use in the basin (Roth et al., 1996; Naiman
& Decamps, 1997; Johnson et al., 2005). In contrast to basins
na-tional parks or riparian forest) are known to act as buffer re-gions that reduce the entry of sediment into the channels, provide allochthonous organic material and permit the persis-tence of diverse communities (Berkman & Rabeli, 1987; Poff et al., 1997; Lammert & Allan, 1999; Growns et al., 2003).
Further-more, point disturbances (e.g. dredging, sand or gravel
extrac-tion, etc.), even in pristine environments, can impede migra-tion corridors thus reducing populamigra-tions of sensitive species. These regional and local effects are considered the principal forces influencing the biotic integrity of aquatic ecosystems. The changes in species richness and composition of fish communities in rivers with different levels of environmental impact can be determined in multiple ways. Attributes of com-munities (e.g. species richness and diversity) provide basic
information about qualitative changes (Magurran, 2003), but the recognition of emergent attributes (structure, composi-tion and organizacomposi-tion) permit better assessments of environ-mental effects on communities (Karr, 1981). The combination of these attributes is used to predict the biotic integrity of aquatic ecosystems.
A pioneer model to estimate the health or biotic integrity is the IBI (index of biotic integrity) proposed by Karr et al.,
(1986). The IBI considers variation in attributes of fish commu-nities in rivers with different degrees of perturbation relative to a regional baseline or reference system with minimal exposure to anthropogenic perturbations. This model was originally developed in the midwestern United States and has been tested successfully in different regions and ecological situations, for example in Africa (Toham & Teugels, 1999), Mexico (Lyons et al., 2000), Belgium (Belpaire et al., 2000) and Argentina (Hued
& Bistoni, 2005). Other methods, such as multivariate or mul-tidimensional analysis, explain how variation in species as-semblages are associated with environmental gradients (Bond & Lake, 2003; Gerhard et al., 2004), and how these relate to the
conservation status or integrity of hydrosystems.
The effective understanding of the attributes in fish com-munities and their consequent biotic integrity require data with spatial and temporal amplitude (e.g. complete annual
hydro-logic cycle) in order to recognize the changes and the relations in the communities respect to disturbance gradients, but these still are limited. However, it is possible that the IBI or multivari-ate analyses applied on a smaller scale (e.g. dry season) can
reflect major changes in fish communities associated with spe-cific gradients of disturbance. Such approaches may not ex-plain all effects on fish communities, but can contribute useful information for management and conservation of natural re-sources. Most neotropical regions still suffer the disadvan-tage of only having short term historical databases to docu-ment variation in the freshwater ecosystems and their organ-isms, which limits research and the application of conserva-tion programs. This situaconserva-tion is well known in protected areas and their buffer zones which are usually threatened by human impacts. For this reason there is an urgent need for short term evaluation techniques that identify the main effects of major disturbances on freshwater biological communities. This pa-per presents a comparative analysis of the biotic integrity of
fish communities using an index developed for piedmont rivers and multivariate analysis of parameters that describe environ-mental gradients and apparent conservation status in rivers of the Aroa Mountains, Caribbean versant of Venezuela. Study area. The Aroa river basin (2450 km2) drains the
west-ern Caribbean coast of Venezuela (Fig. 1). Most tributaries originate in the Aroa Mountains and are protected by the Yurubí national park (YNP, 23,670 h; Gaceta Oficial de Ven-ezuela 26210, March 1960). In the piedmont, climate is sea-sonal with rainfall (800 - 1500 mm) concentrated in July-Au-gust (Lentino y Bruni, 1994), and the driest period from Janu-ary-April. In the mountains, humid and cloud forest predomi-nate, and in the lowland plains there are still remnants of tropical deciduous forest (Huber 1997). Vegetation in the ar-eas bordering the park has been extensively modified by co-lonial and current human intervention, principally in the pied-mont transition zone between mountains and the plains, where deforestation, extensive farming and urbanized areas have dramatically modified both terrestrial and aquatic ecosystems (Rodríguez-Olarteet al., 2006).
Agricultural expansion is extensive even in areas border-ing the national park and generates social pressure for the use and administration of natural recourses. The different degrees of conservation (park-protected vs. unprotected watersheds) is manifest in the low percentage of remaining riparian forest, the large amount of water extracted for irriga-tion, extensive dredged areas of riverbed, and urban pollu-tion. Some tributaries, for example the Tupe river, have inter-mittent flow in the lower course due to water extraction, whereas others (e.g. Crucito) are dredged to remove
exces-sive sediments to prevent flooding.
Methods and Materials
The sampling stations located in the tributaries originating in the Yurubí National Park were classified as group 1 (G1, n = 14): which includes the following rivers Crucito (Cr: stations Gy and Pt), Tesorero (Te), Guarataro (Gu: stations Gu and Tt), Zamuro (Za) and Carabobo (Ca). Rivers lacking protection: Tupe (stations Ta, Tb and Tu), Cumaraguas (Cu) and Oro (Or) were included in group 2 (G2, n = 10). All stations of G1 were located no more than 2 km from the limits of the park, except for the Crucito river (~ 3 km). We sampled in two reaches in each river, except for the Guarataro (n = 4), Crucito (n = 4) and Tupe rivers (n = 6). Samples were separated by > 200 m and located within the piedmont region of geomorphological transition between mountains and lowland plains. The degree of distur-bance associated with each river was estimated as low: (Zamuro and Carabobo rivers), medium (Guarataro, Tesorero and Oro), high (Cumaragua and Tupe) and very high (Crucito) based on visual evaluation of the intervention on the riparian vegeta-tion, channel and human activities.
electrofishing gear consisting of a portable electrical generator and hand nets with fine mesh (< 5 mm). Captures were made in river sections (~ 50 m) at depths < 1.5 m and from all available mesohabitats (riffle, pool). The temporal effort for collecting each sample (35 min) was determined based on successive captures and accumulative species curve. Most fishes were identified at the time of capture, recorded and returned alive, except for a few individuals that were preserved in formalin [10%] for taxonomic confirmation in the laboratory.
Channel depth (cm) and width (m) of each sample site was measured. For the substrate characterization, we estimated the percent coverage of components inside 1 m2 squares
ar-ranged along transects in the beginning, middle and end of each survey station. We used the classification system pro-posed by Bain & Stevenson (1999) for the granulometry [sand (0.1-1 mm), fine gravel (0.1-5 cm), coarse gravel (5-25 cm), stones (25-100 cm) and rocks (> 100 cm)]. In addition, we estimated the cover of leaves, branches and logs. Also, the concentration of total dissolved solids (TDS, mg/l) was mea-sured for each river, according to APHA (1985).
Analysis
To normalize the environmental data, the percent cover of substrate was expressed as a ratio before being transformed using arcsine square-root (p0.5), and the width, depth and total
dissolved solids variables were log(X) transformed (Sokal &
Rohlf, 1995). Because some species had differences in their abundance, this variable was square-root transformed to nor-malize the data. This reduced the impact of the extremes in species abundances for a better interpretation of the data (Pegg & McClelland, 2004; Gratwicke & Speight, 2005). We used one-way ANOVA tests to detect differences in means for habitat and fish variables between river groups. The Pearson coeffi-cient was used to correlate the habitat variables and fish com-munity descriptors (Helms & Feminella, 2005). The abundance variable was not transformed for the IBI procedures.
We classified the fishes according to their known life his-tory attributes or, for poorly known taxa, those of related spe-cies. Trophic guilds (omnivores, herbivores and carnivores) were assigned following Winemiller & Taphorn (1989), Taphorn (1992), Rodríguez-Olarte & Taphorn (1995), Arrington et al.
(2002) and Keith (2003). The assignments of habitat of occur-rence were based on capture data and field observations. Base-line information for each species is presented in appendices. Index of biotic integrity. The general IBI model is expressed using categories based on metrics (e.g. species richness and
composition) and other numerical values obtained by mea-suring different parameters of the fish community present in each river classified. To permit comparison, the maximum possible value for each parameter evaluated is applied to the optimal condition of that metric (e.g. the highest possible
species richness) and a minimum value is assigned the poor-est situation encountered in rivers with the most deteriorated condition. The final result is a sum of all the metrics consid-ered and these are then related to a specific biotic integrity class (Karr et al. 1986, Fausch et al. 1984). The rivers of the
Aroa Mountains lack detailed information on taxonomy and ecology of several fish species, and because of this we modi-fied the IBI model. We also eliminated the metrics about mor-phological anomalies and hybridization, the first because they are extremely uncommon, the latter for lack of information.
The baseline conditions considered optimum for species and others metrics were obtained from rivers with the best conservation values (group G1). The Crucito river was ex-cluded from this analysis because it has high levels of impact even though its headwaters are protected by the park. The tolerance class (tolerant, medium tolerant and intolerant) was assigned in concordance with Rodríguez-Olarte y Taphorn (1995) and refined by the reference values determined for a comparison of abundances according to the coincidence of interquartile ranges in box plot diagrams (Silveira et al., 2005).
The coincidence, or lack of coincidence, for these ranges was tested for statistical significance to develop a base list of species and to determine the confidence intervals for the IBI metrics (Table 1 and appendices):
Fig. 1. A: The Aroa River basin. The Yurubí National Park (YNP) is indicated by the shaded polygon. B: each circle indi-cates one or more sample localities. The white circles de-noted tributaries in group 1 (G1) and black circles are tributar-ies in group 2 (G2).
10° N
Caribbean sea
68° W
Orinoco river
i
N
10° N
Caribbean sea
68° W
Orinoco river
i
N
YARA CUY R
IVER B ASIN
TOCU
YORI
VER
BASI
N
Aroa river
6
9
°
0
0
´
W
10°20´ N
10°50´ N
6
8
°
3
0
´
W
0 10 km
0 10 km
A
Cru
cit o
Tesorero Guarataro Car
ab obo
Cumaraguas
Tu pe
Oro
Zam uro
B
Species richness and fish composition category:
1.Sample fish richness: the total number of species in sample; this included the amphidromous species.
2.Diversity: (complementary to richness). Although usually the richness shows positive association and redundancy with the diversity index, the disturbance gradient produces changes in relative abundance when comparing diverse com-munities to simple assemblages (Fausch et al., 1990; Harrison
& Whitfield, 2004). We used the Simpson index (D)
accord-ing to Magurran (2003). This index emphasizes dominance by heavily weighting the most abundant species in the sample, but is less sensitive to species richness.
3.Richness of intolerant species: considered taxa with spe-cialized diets (e.g. invertivorous) and with requirements for a
clean substrate for feeding or reproduction. A species could be considered intolerant if its abundance or distribution has been drastically reduced or if it is restricted to high quality habitat sites (Hued & Bistoni, 2005).
4.Richness of long lived species: included species with an-nual reproduction and/or long life (e.g. Hoplias malabaricus).
Trophic composition and habitat use category:
5.Proportion of Loricariidae fishes: These catfish are benthic and their diets include autochthonous (algae, roots) and allochthonous (wood) materials. Chaetostoma anomalum
was excluded from this metric because it is tolerant to ad-verse conditions based on the only slight variation in its abundance (see appendices).
6.Proportion of invertivores: several fishes feed on benthic invertebrates, but others select drifting aquatic invertebrates and/or those of riparian (terrestrial) origin.
7. Proportion of piscivores: included fish predators (e.g. Crenicichla geayi, Roeboides dientonito) that feed on fishes
as adults.
8.Proportion of drift-feeding omnivores: species associated with currents and that feed on allochthonous materials (Astyanax spp, Hemibrycon jabonero and Pimelodella odynea).
9.Proportion of tolerant species: dominant, generalists and/ or omnivorous species (e.g. Creagrutus lassoi) with increase
or maintenance of its abundance in degraded rivers could be considered tolerant.
Fish abundance category:
10.Density of fishes per sample (individuals /m2): was esti-mated for the sample area and compared with the mean width of river in each locality. The fish with lowest abundance (< 5%) were excluded for the IBI (see appendices).
The sum of these ten metrics multiplied by two gives the final result for the IBI, a value that falls within an interval 0-100, according with Ganasan & Hughes (1998). The numerical value thus obtained for the IBI was then assigned to a biotic integrity class (Karr et al. 1986), but modifying their intervals: poor (< 20
points), bad (20-40), regular (>40-60), good (>60-80) and excel-lent (>80). The IBI values for groups G1 and G2 were compared using the non-parametric Kruskal-Wallis test.
We applied principal component analysis (PCA) to detect environmental gradients among river stations. The PCA tech-niques reduce the dimensionality of the habitat variables and examine initially the influence of habitat characteristics (Legendre & Gallagher, 2001). Cross-products matrix in PCA were centered and standardized by standard deviation. We retained the first three by the Brocken-Stick criteria (eigen-value > 1) and the variables with their highest loadings in this axis. Since the ordination of samples and species is con-strained by their relationships to environmental variables, we applied canonical correspondence analysis (CCA) to con-trast the relationships between the fish community composi-tion and fluvial habitat. In the CCA the total amount of varia-tion in species and sampling stavaria-tions that can be explained by the environmental variables is calculated by dividing the sum of canonical eigenvalues by the sum of all unconstrained eigenvalues (Ter Braak, 1994). We tested the statistical sig-nificance in CCA analysis using the Monte Carlo test with 999 permutations. For the joint plots only variables with r
values > 0.500 (cut-off level = 0.5) were shown. The PCA and DCA axes were correlated with primary attributes of fish com-munities and IBI values to determine and to validate the rela-tionships between the biotic integrity and environmental gra-dients. Statistical tests were done using STATISTICA ver-sion 6 (StatSoft, 2004). For the multivariate analysis we used PC-ORD, Version 4.25 (McCune & Mefford, 1999).
Results
The mean width of rivers was higher in G1 sites (ANOVA,
F1,22= 21.95, P = 0.0001), as well as the percent sand cover
(F= 9.85, P = 0.0048). Similarly, percent fine gravel was higher
in G2 sites (F= 47.42, P < 0.0001) and also total dissolved
solids (F= 70.78, P < 0.0001). Other components of substrate
did not show significant statistical differences. Species rich-ness (37 species) showed relevant correlation with fine gravel (r2 = -0.57, P = 0.0037) and the total dissolved solids (r2 = 0.55,
POINTS
CATEGORIES AND METRICS
5 3 1 Species richness and fish composition category:
Sample fish richness > 14 9-13 < 8
Diversity > 80 60-80 < 60
Richness of intolerant species > 4 1-3 0
Richness of long lived species > 6 3-5 < 2
Trophic composition and habitat use category (%):
Loricariidae fishes > 30 10-30 < 10
Invertivorous fishes > 30 10-30 < 10
Piscivorous carnivores fishes > 15 5-15 < 5
Proportion omnivorous fishes < 40 40-20 > 60
Proportion of tolerant species < 40 40-20 > 60
Fish abundance category:
Density of fishes per sample < 0.30 0.30-0.90 > 0.90
P < 0.0001). The species richness was significantly greater (F
= 24.53, P = 0.0006) in the better conserved rivers of G1 (mean
= 14.3 spp, max = 19 spp, n = 14) than the G2 (mean = 8.4 spp, max = 13 spp, n = 10). Absolute abundance was greater in rivers of G2 sites (F= 7.89, P = 0.01). Most species (76%) had
a lower abundance in all G2 group tributaries, and 58% were not captured in these rivers. The only species not reported in the G1 was Trichomycterus arleoi. Several species (e.g. Creagrutus lassoi,Chaetostoma anomala) showed a notable
increase in abundance in the G2 sites.
The IBI model identified a gradient in values related to conservation and protection status of the rivers (Fig. 2). IBI values were lower in unprotected rivers with obvious impacts. Biotic integrity class for all protected rivers except the Crucito was good. Mean IBI was higher in group G1 and it was sig-nificantly different from the mean for group G2 (Kruskall-Wallis = 16.19, P < 0.0001). The IBI showed high positive correlation
only with river width (r2 = 0.60, P < 0.0001) and negative cor-relation with total dissolved solids (r2 = 0.71, P < 0.0001) and fine gravel substrate (r2 = 0.38, P = 0.0024).
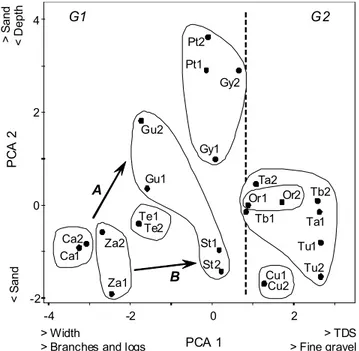
Principal component analysis for habitat variables pro-duced three significant axes and explained 69.29% percent of accumulated variance (Table 2). The PCA 1 axis represented 32.56% of the explained variance and described a gradient determined positively by fine gravel and total dissolved sol-ids, and negatively by width and branches and logs. For the second axis (22.71%) the gradient was dominated by sand, coarse gravel and stones. The third axis was determined by rocks and leaves. The recognized gradients (Fig. 3) demon-strate that in protected and better conserved rivers the pres-ence of total dissolved solids, sand and fine gravel were smaller. These rivers were wider and deeper. The distur-bance gradient was dominated mainly by the increase in the sand cover, fine gravel and total dissolved solids, better rec-ognized in Crucito and Tupe stations.
CCA analysis showed a functional relationship between fish species, habitat variables and localities. The correlation species-habitat was significant (P = 0.0010) and elevated for all
axes (Table 3). The three axes in CCA accounted for 40.3% of the variation in species abundances and habitat variables. The CCA 1 resumed 20% of the variance and was determined by the substrate particle size expressed as the sand and fine gravel, as well as by depth and total dissolved solids. In the rest of the axes the substrate particle size also predominated (sand and fine gravel) but their explained variances were low (CCA 2: 11.9%; CCA 3: 8.5%). The CCA plots (Fig. 4) can be associated with the geographic location of many rivers and localities. The diagram indicated a probable separation between rivers ac-cording to protection status (G1 and G2 groups) and the de-gree of watershed disturbance estimated initially. In the CCA the width, depth, fine gravel and total dissolved solids defined the fish assemblages. A gradient in the complexity of the aquatic habitat determined the composition of fish communities; that is, from communities with greater richness and environments dominated by more components (e.g. Zamuro river), to less
complex communities with low richness and homogenous
sub-strates (e.g. Tupe river). Nevertheless, intermediate assemblages
also were detected; for example, the rivers Crucito and Guarataro showed communities with extremes in richness but with altered substrates. These results show that the habitat variables contribute moderately to the interpretation of the species richness and distribution.
The relationships between the environmental gradient with fish attributes were evident but only the axis PCA1 could par-tially explain species richness (r2 = 0.34, P = 0.0030, Fig. 5A). The geographic location and protection status (G1 and G2 groups) for the rivers were associated with the PCA and CCA axes (Fig. 5B and 5C), indicating an association between the
Cr Te Gu Za Ca Cu Tu Or
Rivers 20
30 40 50 60 70 80 90
IBI
G1 G2
Table 2. Eigenvalues and percent explained variance of the first three principal component axes associated with habitat parameters.
Principal Components VARIABLES
PCA 1 PCA 2 PCA 3
Eigenvalue 3.256 2.271 1.402
% explained variance 32.557 22.707 14.019
Variance accumulated 32.557 55.265 69.284
Variables
Mean width -0.4880 -0.0036 -0.0207
Depth -0.1645 0.4182 0.1942
Sand -0.2919 -0.4834 -0.2142
Fine gravel 0.4061 0.1717 0.3388
Coarse gravel 0.1132 0.4545 -0.2242
Stones -0.2322 0.4548 -0.0672
Rocks -0.1551 0.3820 -0.3274
Leaves -0.2108 0.0065 0.6931
Branches and logs -0.3954 0.0405 0.3643
Total dissolved solids 0.4394 -0.0296 0.1615
degree of conservation and protection status for the rivers. Thus, the greater positive values of the PCA 1 and CCA 1 were recognized in rivers without protection by the national park.
Variations in IBI scores were significantly attributable (r2 = 0.61, P < 0.0001, Fig 6A) to the variations in the
environ-mental gradient shown by PCA analysis, suggesting that the IBI model could discriminate the changes in the fish commu-nities and that it was independent of the environmental physi-cal characteristics. The graphiphysi-cal interpretation suggests greater scores of the IBI associated with substrates with little cover of fine gravel and low concentration of total dissolved solids. On the other hand, smaller values of IBI were associ-ated with a reduction in the river width and the presence of abundant wood (branches and logs). Even though the com-parison of the IBI with the CCA (Fig. 6B) could be redundant, the correlation was only moderate. Our data indicate that the biotic integrity index and it the differences detected among studied fish communities are attributable to substrate hetero-geneity and composition in fluvial environments.
Discussion
Differences observed among habitat variables and primary fish attributes from rivers in the Aroa Mountains were detected by simple comparisons, demonstrating differences in groups respect to habitat heterogeneity, fish assemblages, protection status and the degree of watershed disturbance associated with each locality. Also, the differences among fish communi-ties were recognized with better refinement using both the IBI and multivariate analysis. Some fish community attributes (e.g.
richness) were most sensitive to habitat variables, but the IBI
were most responsive to overall gradients. The effect of envi-ronmental gradients and the degree of disturbance of the aquatic habitat on the IBI was evident in the rivers of the Aroa Mountains. The relationship between the IBI and habitat dis-turbance gradients have been demonstrated by many authors; for example, Toham & Teugels (1999) showed that variation in the IBI in relation to a gradient of human impacts, showed a reduction of intolerant taxa where major impacts were present. The IBI was applied only in the dry season, when rivers have low water volume, lower sediment concentrations and higher transparency. Although this limits evaluation of the complete annual cycle, dry season sampling (apart from prac-tical logistic limitations) should be the most appropriate time to apply the IBI because at low flow the parameters evaluated are more sensitive to changes in habitat variables (Pinto et al., 2006). The drastic variation of the rivers during the rainy
season reduces the access to the sampling stations and the use of electrofishing standardized in time and space.
The IBI evaluates several attributes of fish communities but its main limitation is the sensitivity of the metrics mea-sured. Some parameters have been shown to be poor or am-biguous predictors of habitat quality (Reynoldson et al., 1997).
In the absence of detailed information on life histories for many species, the baseline values used for with the IBI metrics must be obtained from local streams with low or no human Table 3. Canonical correspondence values and percent
ex-plained variance associated with the first three axes for habi-tat and substrate variables measured.
Canonical Correspondence VARIABLES
CCA 1 CCA 2 CCA 3
Eigenvalue 0.394 0.236 0.169
% explained variance 19.9 11.9 8.5
Variance accumulated 19.9 31.8 40.3
Monte Carlo Test for eigenvalues (999 permutations)
Mean 0.186 0.236 0.118
Pearson correlation 0.877 0.923 0.953
P = 0.0010 0.0010 0.0010
Variables
Mean width -0.612 -0.342 -0.565
Depth 0.220 0.547 0.326
Sand 0.028 1.010 0.520
Fine gravel 0.386 0.614 0.558
Coarse gravel 0.214 0.454 -0.361
Stones 0.074 0.412 -0.181
Rocks 0.048 0.290 0.092
Leaves 0.143 0.823 -0.463
Branches and logs 0.057 -0.334 0.427
Total dissolved solids 0.220 -0.408 -0.549
Fig. 3. PCA analysis for the habitat variables in selected rivers. The graph includes all stations for each river. From environ-ments with greater habitat heterogeneity (Carabobo and Zamuro rivers) the gradient is expressed A) towards rivers with greater sand cover and minor depth (e.g. Crucito: Pt stations) and B)
towards rivers with greater total solid dissolved concentration and fine gravel (e.g. Tupe). Stations of a same river showed a
varied composition of the substrate with respect to the distur-bance gradient (e.g. Guarataro: Gu and St stations).
A
B G1
Pt1 Pt2
Gy1 Gy2
Te1 Te2
St1
St2 Gu1
Gu2
Za1 Za2 Ca1
Ca2
Cu1 Cu2
Ta1 Ta2
Tb1
Tb2
Tu1
Tu2
Or1 Or2
-4 -2
-2 0 2
0 2 4
PCA 1
PC
A
2
G2
> Width
> Branches and logs
> TDS > Fine gravel
< S
a
n
d
> S
a
n
d
<
D
ept
disturbances. Minimally disturbed rivers should be indepen-dently identified, preferably using habitat criteria; however a lack of basic information limits the verification or association with biological indicators. The consideration of local species abundance from protected ecosystems (e.g. national parks)
is a useful reference condition for the construction of an IBI. Besides complementing the IBI, multivariate techniques permit incorporation of multiple gradients into the analysis of integrity (Gauch, 1982; Meffe & Sheldon, 1988; Reynoldson et al., 1997; Anderson & Willis, 2003). These provide a better
understanding of biotic responses in the fluvial habitats. Many techniques are successfully used to measure or validate the IBI models, such as cluster analysis or discriminant function analysis. The principal component analysis is useful to recog-nize the environmental gradients but the canonical correspon-dence analysis is a robust technique to know the relationships between the habitat variables and fish communities. However, the IBI in this situation has the advantage to obtain similar predictive values with less information. For the purpose of natural resource management, IBI has greater utility, lower costs and is more easily appreciated, because the values of the IBI can be used with greater facility in biomonitoring programs.
Among the landscape factors that have been shown to influence the integrity of aquatic ecosystems, land use and
riparian forest are good predictors of substrate and water quality (Bojsen & Barriga, 2004; Allan, 2004; Novotny et al.,
2005). Among anthropogenic impacts, sedimentation is prob-ably the most detrimental to fluvial habitats. Sutherland et al.
(2002) and Casatti (2004) reported decreased fish species rich-ness and changes in local abundance associated with in-creased sediment loads in rivers. At the local level (tributary or reach) other factors are critical to maintain the fish commu-nities, such as depth and substrate composition (Schlosser, 1991) or the variability and fluctuations in the physical and chemical characteristics (Tejerina-Garro et al., 2005).
Protected areas, such as Yurubí National Park, help main-tain flows and substrate heterogeneity but do not guarantee conservation of biota beyond their boundaries. Local distur-bances (e.g. dredging, mining, deforestation) have strong and Pt1
Pt2
Gy1 Gy2
Te1,2 St1
St2 Gu1 Gu2
Za1
Za2 Ca1
Ca2
Cu1,2 Ta1
Ta2 Tb1 Tb2 Tu1
Tu2 Or1
Or2
WI
DE
TDS
SA
FG
-2.0 -2.5
-1.0 0.0 1.0 2.0
-1.5 -0.5 0.5 1.5
CCA 1
CC
A
2
G2 G1
> Width > Fine gravel> TDS
>
S
and
<
S
and
>
Depth
Fig. 4. Pattern in fish assemblages distribution among envi-ronmental variables based on canonical correspondence analysis ordination. Labeled arrows indicate the direction along which each variable changes most. The arrows were doubled in length for visual purposes. The gradient is domi-nated by the variations of depth (DE), fine gravel (FG), total dissolved solids (TDS), sand (SA) and width (WI). Each symbol represents a sampling location and degree of distur-bance: open circle (low disturbance), gray circle (medium), black circle (high) and triangle (very high).
Fig. 5. Relationships between the PCA 1 and CCA 1 axes with the species richness and rivers stations. The richness (A) was moderately explained, but the multivariate (B) and canonical (C) analyses showed functional relationships with the geographical location of the rivers.
-4 -3 -2 -1 0 1 2 3
PCA 1 5
10 15 20
Richness
r2 = 0.34, p = 0.0030
A
Cr Te Gu Za Ca Cu Tu Or
Rivers -4
-3 -2 -1 0 1 2 3
PCA 1
B
Cr Te Gu Za Ca Cu Tu Or
Rivers -2
-1 0 1 2 3
CCA 1
lasting effects on aquatic ecosystems. Our study sites show this is the case in the Crucito River, which is protected in its headwaters, but highly deteriorated in the lowlands. Bond & Lake (2003) and Lake (2003) demonstrated how stream fish abun-dance was limited by insufficient habitat availability at a small spatial scale, a situation that applies to rivers that are dredged. The flexibility and robustness of this IBI make it an effective tool for management of hydrobiological resources. IBIs are al-ready used in the regulatory arena in some countries (e.g. U.S.
EPA, 2000). The European Community is considering biomonitoring as a fundamental part of management of hydro-graphic basins to develop a continental conservation strategy (Parlamento Europeo, 2000). In South America, a few preliminary studies using biotic integrity to estimate river conservation sta-tus have been published (see for example Rivera & Marrero, 1995; Rodríguez-Olarte & Taphorn, 1995; Hued & Bistoni, 2005; Silveiraet al., 2005), but knowledge of taxonomy and ecology of
the ichthyofauna is still incomplete. In the same context, several disturbances act on the fluvial ecosystems and their study and understanding are still developing, and the environmental ef-fects on functional metrics of IBI have yet to be completely understood. In time, we can expect biomonitoring to play a greater role in natural resource conservation in the Neotropics.
Acknowledgements
This manuscript is a partial result of Research Project 043-AG-2001, Consejo de Desarrollo Científico, Humanístico y Tecnológico (CDCHT) of the Universidad Centroccidental Lisandro Alvarado (UCLA) and promoted by the Colección Regional de Peces CPUCLA in Laboratorio de Ecología (Departamento de Ciencias Biológicas, Decanato de Agronomía UCLA). H. Rivera, R. Sivira, A. Trógolo and E. Aguirre helped with the field work. Scientific collecting permits were given by INAPESCA (Ministerio de Producción y Comercio) and INPAR-QUES (Ministerio del Ambiente y los Recursos Naturales). We thank J. Lobón-Cerviá, Kirk Winemiller and the anonymous reviewers for their useful comments to improve the manuscript.
Literature Cited
[APHA] American Public Health Association. 1995. Standard Methods for the Examination of Water and Wastewater. 19th edition. A. E. Greenberg, L.S. Clesceri, and A. D. Eator, editors. American Public Health Association. Washington, D. C.
Allan, J. D. 2004. Landscapes and riverscapes: the influence of land use on stream ecosystems. Annual Review of Ecology and Systematics, 35: 257-84.
Anderson, M. J. & T. J. Willis. 2003. Canonical analysis of principal coordinates: a useful method of constrained ordination for ecology. Ecology 84: 511-524.
Arrington, A., K. Winemiller, W. Loftus, & S. Akin. 2002. How often do fishes “run on empty”? Ecology, 83: 2145-2151.
Bain, M. B. & N. J. Stevenson. 1999. Aquatic Habitat Assessment Common Methods. American Fisheries Society, Bethesda, Maryland. 136p. Belpaire, C., R. Smolders, I. V. Auweele, D. Ercken, J. Breine, G. Van
Thuyne & F. Ollevier. 2000. An Index of Biotic Integrity characterizing fish populations and ecological quality of Flandrian water bodies. Hydrobiologia, 434: 17-33.
Berkman, H. & C. Rabeli. 1987. Effect of Siltation on Stream Fish Communities. Environmental Biology of Fishes, 18(4): 285-294. Bojsen, B. H. & R. Barriga. 2002. Effects of deforestation on fish
community structure in Ecuadorian Amazon streams. Freshwater Biology, 47: 2246-2260.
Bond, N. R. & P. S. Lake. 2003. Characterizing fish-habitat associations in streams as the first step in ecological restoration. Austral Ecology, 28: 611-621.
Casatti, L. 2004. Ictiofauna of two streams (silted and referent) in the upper Paraná river basin, southeastern Brazil. Brazilian Journal of Biology, 64(4): 757-765.
Fausch, K. D., J. Lyons, J. R. Karr & P. L. Angermeier. 1990. Fish communities as indicators of environmental degradation. American Fisheries Society Symposium 8: 123-144.
Fausch, K. D., J. R. Karr, & P. R. Yant. 1984. Regional application of an index of biotic integrity based on stream fish communities. Transactions of the American Fisheries Society, 113: 39-55. Ganasan, V. & R. M. Hughes. 1998. Application of an index of biological
integrity (IBI) to fish assemblages of the rivers Khan and Kshipra (Madhya Pradesh), India. Freshwater Biology, 40: 367-383. Gauch, H. G. 1982. Multivariate Analysis in Community Ecology.
Cambridge University Press, Cambridge, England. 263p.
Gerhard, P., R. Moraes & S. Molander. 2004. Stream fish communities and their associations to habitat variables in a rain forest reserve in southeastern Brazil. Environmental Biology of Fishes, 71: 321-340.
-4 -3 -2 -1 0 1 2 3
PCA 1 20
30 40 50 60 70 80 90
IBI
r2 = 0.61, p < 0.0001
A
-2 -1 0 1 2 3
CCA 1 20
30 40 50 60 70 80 90
IBI
r2 = 0.55, p < 0.0001
B
Gratwicke, B. & M. R. Speight. 2005. The relationship between fish species richness, abundance and habitat complexity in a range of shallow tropical marine habitats. Journal of Fish Biology, 66: 650-667. Growns, I., P. C. Gehrke, K. L. Astles & D. A. Pollard. 2003. A comparison
of fish assemblages associated with different riparian vegetation types in the Hawkesbury–Nepean River system. Fisheries Management and Ecology, 10: 209-220.
Harrison, T. D. & A. K. Whitfield. 2004. A multi-metric fish index to assess the environmental condition of estuaries. Journal of Fish Biology, 65: 683-710.
Helms, B. S. & J. W. Feminella. 2005. Detection of biotic responses to urbanization using fish assemblages from small streams of western Georgia, USA. Urban Ecosystems, 8: 39-57.
Huber, O. 1997. Ambientes Fisiográficos y Vegetales de Venezuela. Pp. 279-298. In: E. La Marca E. Vertebrados Actuales y Fósiles de Vene-zuela. Museo de Ciencia y Tecnología de Mérida. VeneVene-zuela. 310p. Hued, A. C. & M. Bistoni. 2005. Development and validation of a biotic index for evaluation of environmental quality in the central region of Argentina. Hydrobiologia, 543: 279-298.
Johnson, M., P. Giller, J. O’halloran, K. O’gorman & M. B. Gallagher. 2005. A novel approach to assess the impact of landuse activity on chemical and biological parameters in river catchments. Freshwater Biology, 50: 1273-1289.
Karr, J. R. 1981. Assessment of biotic integrity using fish communities. Fisheries, 6: 21-27.
Karr, J. R., K. D. Fausch,, P. L. Angermeier, P. R. Yant & I. J. Schlosser. 1986. Assessing Biological Integrity in Running Waters: A Method and its Rationale. Illinois Natural History Survey, Special Publication 5, 28p.
Keith, P. 2003. Biology and ecology of amphidromous Gobiidae of the indo-pacific and the Caribbean regions. Journal of fish biology, 63(4): 831-847.
Lake, P. S. 2003. Ecological effects of perturbation by drought in flowing waters. Freshwater Biology, 48: 1161-1172.
Lammert, M. & J. D. Allan. 1999. Assessing biotic integrity of streams: effect of scale in measuring the influence of land use/cover and habitat structure on fish and macroinvertebrates. Environmental Manage-ment, 23: 257-270.
Legendre, P. & E. D. Gallagher. 2001. Ecologically meaningful trans-formations for ordination of species data. Oecologia, 129: 271-280. Lentino, M. & A. R. Bruni. 1994. Humedales Costeros de Venezuela: Situación Ambiental. Sociedad Conservacionista Audubon de Venezuela, Caracas. 188p.
Lyons, J., A. Gutierrez-Hernandez, E. Diaz-Pardo, E. Soto-Galera, M. Medina-Nava & R. Pineda-Lopez. 2000. Development of a preliminary index of biotic integrity (IBI) based on fish assemblages to assess ecosystem condition in the lakes of central Mexico. Hydro-biologia, 418: 57-72.
Magurran, A. E. 2003. Measuring Biological Diversity. Blackwell Publishing, UK. 256p.
McCune, B. & M. J. Mefford. 1999. Multivariate Analysis of Ecological Data. Version 4.25. MjM Software, Gleneden Beach, Oregon, U.S.A Meffe, G. & A. L. Sheldon. 1988. The influence of habitat structure on fish assemblage in southeastern blackwater streams. American Midland Naturalist, 120(2): 225-240.
Naiman, R. J. & H. Decamps. 1997. The ecology of interfaces: riparian zones. Annual Review of Ecology and Systematics, 28: 621-658. Novotny, V., A. Bartosova, N. O’Reilly & T. Ehlinger. 2005. Unlocking
the relationship of biotic integrity of impaired waters to anthropogenic stresses. Water Research, 39(1): 184-198.
Parlamento Europeo. 2000. Directiva 2000/60/CE. Diario Oficial de las Comunidades Europeas. I. 327p.
Pegg, M. A. & M. A. McClelland. 2004. Spatial and temporal patterns in fish communities along the Illinois River. Ecology of Freshwater Fish, 13: 125-135.
Pinto, B. C. T., F. G. Araujo & R. M. Hughes. 2006. Effects of landscape and riparian condition on a fish index of biotic integrity in a large southeastern Brazil river. Hydrobiologia, 556: 69-83.
Poff, N. L., J. D. Allan, M. B. Bain, J. R. Karr, K. L. Prestedaard, B. D. Richter, R. E. Sparks & J. C. Stromberg. 1997. The natural flow regime: a paradigm for river conservation and restoration. BioScience, 16: 769-784.
Reynoldson, T. B., R. H. Norris, V. H. Resh, K. E. Day & D. M. Rosenberg. 1997. The reference condition: a comparison of multimetric and multivariate approaches to assess water quality impairment using benthic macroinvertebrates. Journal of the North American Benthological Society 16: 833-852.
Rivera, M. & C. J. Marrero. 1995. Determinación de la calidad de las aguas en las cuencas hidrográficas, mediante la utilización del índice de integridad biótica (IIB). Biollania, 11: 127-148.
Rodríguez-Olarte D., A. Amaro, J. L. Coronel & D. C. Taphorn. 2006. Los peces del río Aroa, cuenca del Caribe de Venezuela. Memoria de la Sociedad de Ciencias Naturales La Salle, 164: 125-152.
Rodríguez-Olarte, D. & D. C. Taphorn. 1995. Los peces como indicadores biológicos: aplicación del índice de integridad biótica en ambientes acuáticos de los llanos occidentales de Venezuela. Biollania, 11: 27-55. Roth, N. E., J. D. Allan & D. E. Erickson. 1996. Landscape influences on stream biotic integrity assessed at multiple spatial scales. Landscape Ecology, 16: 141-156.
Schlosser, I. J. 1991. Stream fish ecology: a landscape perspective. BioScience 41: 704-712.
Silveira, M. P., D. F. Baptista, D. Buss, J. L. Nessimian & M. Egler. 2005. Application of biological measures for stream integrity assessment in south-east Brazil. Environmental Monitoring and Assessment, 101: 117-128.
Sokal, R. R. & F. J. Rohlf. 1995. Biometry. Third edition. W.H. Freeman and Company, New York, New York, USA. 887p.
StatSoft, Inc. 2004. STATISTICA (data analysis software system), version 6. www.statsoft.com.
Sutherland, A. B., J. L. Meyer & E. P. Gardiner. 2002. Effects of land cover on sediment regime and fish assemblage structure in four southern Appalachian streams. Freshwater Biology, 47: 1791-1805. Taphorn, D. C. 1992. The characiform fishes of the Apure river drainage,
Venezuela. Biollania, Edición Especial N°4. 537p.
Tejerina-Garro, F. L., M. Maldonado, C. Ibáñez, D. Pont, N. Roset & T. Oberdorff. 2005. Effects of natural and anthropogenic environmental changes on riverine fish assemblages: a framework for ecological assessment of rivers. Brazilian Archives of Biology and Technology, 48(1): 91-108.
Ter Braak, C. J. F. 1994. Canonical community ordination. Part I: Basic theory and linear methods. Ecoscience, 1: 127-140.
Toham, A. K. & G. G. Teugels. 1999. First data on an Index of Biotic Integrity (IBI) based on fish assemblages for the assessment of the impact of deforestation in a tropical West African river system. Hydrobiologia, 397: 29-38.
U.S. EPA. 2000. Ecological Assessment of Streams and Rivers in the Western United States: A Cooperative Effort between the U.S. EPA and Western States and Tribal Nations. U.S. Environmental Protection Agency, Corvallis, Oregon.
Winemiller, K. O. & D. C. Taphorn. 1989. La evolución de las estrategias de vida en los peces de los llanos occidentales de Venezuela. Biollania, 6: 77-123.
Appendix. Fish attributes considered for the development of IBI. Trophic guilds: carnivores (C), invertivores (I), piscivores (P), omnivores (O) and herbivores (H). Mesohabitats (MH) of occurrence: rapid (R), riffle (Ri) and pool (P). Apparent tolerance: tolerant (T), medium tolerant (MT) and intolerant (I). The abundance (G1/G2) is referred to the variation in means between groups (o:P = 0.01 differences; z:P < 0.001; ∅: did not occur in G2 affluent). The species marked with “*” not were included
in the IBI model. T. arleoi was not reported in affluents of group G1.
FISH SPECIES TGROPHIC
UILD MH
HABITAT REFERENCE
APPARENT TOLERANCE
ABUNDANCE
G1/G2 Poeciliidae
Poecilia caucana O Ri-P Littoral T Decrease
Poecilia reticulata O-C Ri-P Littoral T Decrease Gobiidae
Awaous banana H R-Ri-P Epibenthic MT Decrease
Sicydium plumieri I R-P Epibenthic I Decrease
Mugilidae
Agonostomus monticola O R Pelagic I Decrease
Cichlidae
Aequidens pulcher C-I Ri-P Epibenthic T Decrease o
Caquetaia kraussii C-I Ri-P Epibenthic T Decrease
Crenicichla geayi I-P R-Ri-P Epibenthic I Decrease o
Characidae
Astyanax metae O R-Ri-P Pelagic T Decrease
Astyanax venezuelae O R-Ri-P Pelagic MT Variable Astyanax fasciatus O R-Ri-P Pelagic T Decrease o
Bryconamericus sp O Ri-P Pelagic MT Decrease Creagrutus lassoi O Ri-P Epibenthic T Increase z
Creagrutus lepidus * O Ri-P Epibenthic MT Increase Gephyrocharax venezuelae C-I Ri-P Epipelagic MT Decrease
Hemibrycon jabonero O R-Ri-P Pelagic T Decrease Hyphessobrycon fernandezi * O Ri-P Pelagic MT Decrease
Roeboides dientonito * C-P Ri-P Pelagic MT Decrease
Crenuchidae
Characidium chupa C-I R-Ri-P Epibenthic MT Increase Curimatidae
Steindachnerina argentea * H Ri-P Epibenthic MT Decrease
Erythrinidae
Hoplias malabaricus * C-P Ri-P Epibenthic MT Decrease
Lebiasinidae
Lebiasina erythrinoides O R-Ri-P Pelagic T Increase o
Parodontidae
Parodon apolinari H R-Ri-P Epibenthic MT Decrease o
Apteronotidae
Apteronotus cf rostratus * I P Benthic I Decrease
Cetopsidae
Cetopsis orinoco C P Benthic I Decrease o
Loricariidae
Ancistrus af. nationi H R-Ri-P Benthic MT Decrease
Ancistrus triradiatus H R-Ri-P Benthic MT Decrease
Chaetostoma anomalum H R-Ri-P Benthic T Increase o
Chaetostoma milesi H R-Ri-P Benthic I Decrease z
Farlowella mariaelenae * H R-Ri Benthic I Decrease
Farlowella martini * H R-Ri Benthic I Decrease
Hypostomus pagei * H Ri-P Benthic MT Decrease
Pimelodidae
Cetopsorhamdia sp C-I Ri-P Benthic T Increase z
Pimelodella odynea C-I R-Ri-P Benthic T Decrease Rhamdia quelen C-P Ri-P Benthic MT Decrease o
Trichomycteridae
Trichomycterus arleoi * C-I P Benthic MT Increase z
Synbranchidae