637
Patterns of niche breadth and feeding overlap of the fish fauna in the
seasonal Brazilian Pantanal, Cuiabá River basin
Carlos Eduardo Corrêa
1, Miriam Pilz Albrecht
2and Norma Segatti Hahn
3Spatial and temporal variations in patterns of niche breadth and feeding overlap were investigated for the fish fauna in the Pantanal region, aiming to determine the factors that account for species coexistence. Samples were conducted in the Cuiabá River and Chacororé pond, in the upper Pantanal region, Mato Grosso State, Brazil, during one hydrological cycle (March 2000 to February 2001), (designed spatial-seasonal units). Mean niche breadth values were overall low for the fish assemblage (0.2-0.3). Differences between periods were not statistically significant. Feeding overlap values ranged between 0 and 0.4, whereas the mean was always inferior to 0.05 in all spatial-temporal units, and differences between periods were not statistically significant. The highest and lowest mean values were both observed in the pond; the former during the drought period and the latter during the flood period. All feeding overlap mean values were significantly higher than the values expected at random in the null model, using both “scrambled-zeros” (RA3) and “conserved-zeros” (RA4) algorithms. Thus, the foraging patterns show evidences of food sharing. The variance generated in the null model had a pattern similar to the niche overlap pattern: observed variance was higher than expected by chance in all spatial-temporal units, suggesting that the fish fauna is structured in trophic guilds. The patterns of food resource use and the different trophic guilds identified, suggest that species probably have different roles in this ecosystem. Our results suggest that food sharing allows coexistence of different fish species.
Foram investigadas variações espaço-temporais nos padrões de amplitude de nicho e sobreposição alimentar da ictiofauna de uma região do Pantanal, com o objetivo de determinar os fatores responsáveis pela coexistência das espécies. Os peixes foram coletados no rio Cuiabá e na lagoa Chacororé, na região superior do Pantanal de Mato Grosso, Brasil, durante um ciclo hidrológico (março de 2000 a fevereiro de 2001) (designada unidade espaço-temporal). De modo geral, a ictiofauna apresentou baixos valores de amplitude de nicho trófico, sendo que as médias variaram entre 0,2 e 0,3 e não apresentaram diferenças significativas. Os valores de sobreposição alimentar foram igualmente baixos, entre 0 e 0,4 e as medianas em cada unidade espaço-temporal foram inferiores a 0,05, sendo que as diferenças não foram significativas. Os maiores e menores valores médios foram observados na lagoa, durante a seca e cheia, respectivamente, sendo essas diferenças significativas. Os valores médios de sobreposição alimentar foram significativamente maiores do que os esperados ao acaso no modelo nulo, usando tanto a opção de zeros embaralhados (RA3) quanto a de zeros retidos (RA4). Assim, os padrões de forrageamento das espécies mostraram evidência de compartilhamento de recursos alimentares. A variância acompanhou o mesmo padrão da sobreposição de nicho, sendo aquela observada sempre maior que a esperada ao acaso, indicando que a ictiofauna, de modo geral, é estruturada em guildas. Assim, os resultados desse estudo sugerem que o compartilhamento de recursos alimentares permite a coexistência das diferentes espécies.
Key words: Coexistence, Diet, Fishes, Floodplain, Pantanal.
1Centro Universitário Leonardo da Vinci. Rodovia BR 470, Km 71, 1040, 89130-000 Indaial, SC, Brazil.
2Universidade Federal do Rio de Janeiro, Instituto de Biologia, Depto de Ecologia. Av. Pau Brasil, 211, 21941-590 Rio de Janeiro, RJ,
Brazil.
3Universidade Estadual de Maringá, Núcleo de Pesquisas em Limnologia, Ictiologia e Aquicultura. Av. Colombo 5790, 87020-900 Maringá,
Introduction
Patterns of resource utilization are a fundamental property of ecological systems (Winemiller & Pianka, 1990), aiming to assess the role of interspecific competition on the coexistence of a great number of species (Schoener, 1974). Thus, coexisting species may reflect niche partitioning at variable spatial and temporal scales. Niche overlap measures determine the degree of resource segregation among species, but might also provide a descriptive measure of assemblage organization. Thus, low values of niche overlap indicate that species are more segregated in the environment.
Food and space are recognized as the major resource axes for niche partitioning in vertebrates (Schoener, 1974), and in aquatic systems food is recognized as the main axis (Ross, 1986). Several studies carried out in aquatic systems (e.g., Prejs & Prejs, 1987; Hahn et al., 2004; Mérona & Rankin-de-Mérona, 2004; Pouilly et al., 2003, 2004, 2006; Novakowski et al., 2008) have demonstrated that the same food resource can be shared by several species, and that each species might explore many different resources.
Two categories of concurrent theoretical models have been competing to explain the coexistence of many species in ecosystems (Gravel et al., 2006): the niche theory and the neutral theory. The niche theory considers the niche to have two components: species demands to exist in a particular environment and the impacts that the same species have on the environment (Chase & Leibold, 2003). Even though the use of the word “niche” seems to have lost popularity in recent years (Nobis & Wohlgemuth, 2004), the niche concept has been used to explain the coexistence of species for more than 100 years (Mikkelson, 2005). Mechanisms of species coexistence and interactions remain a main topic in assemblage ecology, and niche differences among species have been evoked as fundamental for the maintenance of biodiversity in different scales (Leibold & McPeek, 2006). The neutral theory (Hubbell, 2001), on the other hand, claims that ideas related to the niche concept are not necessary for understanding large-scale fundamental patterns in ecology. According to Bell (2001) and Hubbell (2001) species that coexist in a certain area are ecologically similar, with no species being competitively superior. Species diversity is the result of stochastic ecological and evolutionary factors that interact in both local and regional scales.
Chase & Leibold (2003) argue that much confusion about the niche concept arose from lack of consistency in distinguishing between the responses of organisms to the environment and their effects on the environment. The understanding of mechanisms that allow the coexistence of a high diversity in tropical communities is one of the main challenges posed to ecologists.
Rigorous testing of hypotheses across communities has been a prevailing challenge in ecology. Null models involve the construction of numerous randomized communities, allowing the identification and interpretation of the structure of complex assemblages, and are commonly used for
assessing the influence of species interactions in determining species composition. In this specific case, the null hypothesis states that patterns in species resource use are chance variation and do not reflect biological processes. Randomizations are designed to produce patterns that would be expected in the absence of determined mechanisms. Despite some controversies (e.g., Manly, 1991), this technique has been widely used for hypotheses testing in several types of assemblages, both of plants and animals (Gotelli & Graves, 1996).
In the floodplain where the present study was developed in the Brazilian Pantanal, the Chacororé pond and the Cuiabá River are connected by a permanent channel that allows fish movements, especially during the flood period. The region is characterized by a marked hydrological regime with intense floods and droughts. Thus, the fish fauna is expected to be subject to changes in the food resources related to both the hydrological periods and environmental features related to differences in water dynamics (lentic in the Chacoré pond and lotic in the Cuiabá River). Therefore, we aimed to estimate the potential for trophic interactions in the fish assemblages of Chacororé pond and Cuiabá River, during flood and drought periods. Specifically, we determined i) if there is trophic segregation within the fish community; ii) if the fish assemblages are organized in trophic guilds; iii) if the trophic organization varies spatially and temporally; iv) if such a structure is not determined, which alternative structures are shaping these assemblages.
Material and Methods
Study area
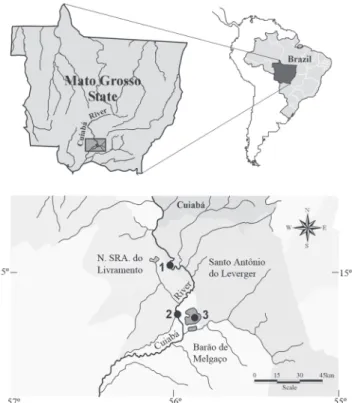
The Cuiabá River basin area has approximately 29.000 km², comprising the Cerrado and Pantanal regions of Mato Grosso. These are two very important areas for species diversity, and Cerrado biome is considered one of the 25 hotspots for conservation priorities (Myers et al., 2000). The study area is located downstream from the Manso reservoir, where a complex system of ponds and floodplains compose the upper portion of the Pantanal. The sampled region is located near the Barão de Melgaço district (16º20.3’S 55º54.2’W), where three sites were selected: two in the Cuiabá River (sites 1 and 2) and one on the left margin of the Chacoré pond (site 3) (Fig. 1). These sites were sampled monthly during the flood and drought periods.
the margin towards the pelagic region is dominated by rooted aquatic macrophytes. The bottom near the margins is predominantly sandy, whereas towards the middle the bottom becomes muddy.
Sampling
Fish were monthly captured from March 2000 to February 2001 using gill nets (mesh sizes between 2.4 and 30.0 cm) and 20-m drift nets with 1 cm mesh size. Gill nets were set for a period of 24 h with inspections at 8:00 h, 17:00 h, and 22:00 h. Total sampling effort was 662.6 m2 of gill nets. Three drift nets were carried out simultaneously in the littoral region in each of the sampling sites (each 20 m long and with 1 cm mesh size).
Fish were identified to the lowest taxonomic level (Britski et al., 1999). Specimens were measured to the nearest 1 mm standard length (Ls), weighed to the nearest 0.1 grams total weight (Wt) and eviscerated. Stomachs were preserved in 4% formaldehyde and later transferred in 70% ethanol. Sub-samples of the individuals of all species were deposited in the Núcleo de Pesquisas em Limnologia, Ictiologia e Aquicultura (Nupélia - Universidade Estadual de Maringá, Paraná State).
Diet analysis
Stomach contents were analyzed under optical and stereoscopic microscopes. The volume of each food category was measured to calculate the percentage relative volume (V%) to the total volume of stomach contents for each species
(Hyslop, 1980). Volumes were obtained using graduated test tubes (items > 0.1 ml), and a glass counting plate (items < 0.1 ml). In the latter, volumes are obtained in mm³ and subsequently transformed in ml (Hellawel & Abel, 1971).
Food items were identified to the lowest possible taxon (using specific identification keys and aid of researchers) and later grouped on coarser categories, named as “food resources” thereafter: Algae (unicellular and filamentous), Detritus/sediment (a mixture of organic detritus in different degrees of decomposition and inorganic matter such as sand and mud), Vascular plants (leaves, flowers, stems, roots, fruits, and plant remains), Zooplankton (Cladocera and Copepoda), Terrestrial insects (Blattodea, Coleoptera, Collembola, Orthoptera, Homoptera, Hymenoptera, Isoptera, Lepidoptera, Trichoptera, Thysanoptera, and insect remains), Aquatic invertebrates (Annelida, Arachnida, Bryozoa, Conchostraca, Diptera, Decapoda, Ephemeroptera, Hemiptera, Nematoda, Odonata, Ostracoda, and remains), Scales (found isolated, not in association with fish remains) and Fish (whole fish, both identified and unidentified, and fish remains).
Relative volume of each food resource was calculated for each species according to site and period (pond flood/ drought and river flood/ drought). Trophic guilds were defined by the predominance of certain resource type (> 51% of total volume).
Trophic niche breadth and feeding overlap
To show the diet breadth in each site and period to each species the Levin’s measure (Krebs, 1999) was calculated using volume data. Hurlbert’s formula (1978) was applied to standardize the trophic niche measure (ranging from 0 to 1), according to the formula: Ba = [ (j P2
ij )
-1 - 1] ( n - 1)-1 , where Ba = standardized trophic niche breadth; Pij = proportion of food category j in the diet of species i; n = total number of food categories. Trophic niche breadth was considered low (0 - 0.39), intermediate (0.4 - 0.6) or high (0.61 - 1) (modified of Grossman, 1986)
Species feeding overlap in each site and period was calculated using Pianka’s symmetric index (1974) that varies in a scale from 0 to 1, with 1 indicating complete overlap. Pair-wise niche overlap values were calculated in the software EcoSim 7.0 (Gotelli & Entsminger, 2007). Diet overlap between species was considered as low (0 - 0.39), intermediate (0.4- 0.6) or high (0.61 - 1) (modified of Grossman, 1986).
Data analyses
For all analyses data were grouped considering: (i) two different environments regarding water dynamics, sites 1 and 2 (Cuiabá River) are considered as lotic and site 3 (Chacororé pond) as lentic; (ii) two different periods related to the rain regime: flood period (March, April, November, and December 2000; January and February 2001) and drought period (from May to October 2000). These periods were defined according to the flow of the Cuiabá River water (daily rates) (Fig. 2). Combinations of these two criteria were named as “spatial-temporal units”, yielding four units: pond flood/ pond drought and river flood/ river drought.
After testing for normality (Shapiro-Wilk) and homogeneity of variances (Levene), niche breadth means were compared by a one-way ANOVA using the spatial-temporal units as a factor. On the contrary, niche overlap data did not meet the requirements for parametric tests and were therefore compared through a Kruskall-Wallis test. All analyses were performed on the software Statistica 7.1 (StatSoft, Inc., 2005).
Null models
Dietary data was distributed into four matrices in order to determine niche overlap patterns within each of the spatial-temporal units. Entries in the matrix were proportional volumes of a given food item consumed by a given species, with species placed on the rows and food items on the columns. Only species represented by two or more individuals were included in each spatial-temporal matrix.
Patterns of niche overlap were calculated and statistically tested against null models using EcoSim 7.0 (Gotelli & Entsminger, 2007). The program performed 1000 Monte Carlo randomizations to create pseudo-communities, and then statistically compared the patterns (mean niche overlap values for all species pairs) in these randomized communities with those in the real data matrix. Interspecific food partitioning might be occurring when the observed mean overlap values are significantly lower than those expected by chance, whereas similar foraging patterns lead values higher than those expected by chance (Albrecht & Gotelli, 2001)
Two different algorithms were used to test for non-random patterns of resource utilization, as broadly discussed in Winemiller & Pianka (1990): (i) RA3 - entries in each row are randomly reshuffled; this procedure preserves the niche breadth (degree of specialization) of the species, but it permits the utilization of any resource available in the matrix (Albrecht & Gotelli, 2001); (ii) RA4 - only entries different from zero are
reshuffled in each row, thus both the niche breadth and zero states are retained, i.e., if a species has not consumed a certain item in the real data, it will not be allowed the consumption in the simulated assemblage (Albrecht & Gotelli, 2001). Another assumption is that resource states are considered to be equiprobable (equally abundant or usable by all species). Both algorithms were applied to each of the four matrices for comparison.
The presence of guild structure was verified through the test for patterns of variance in niche overlaps, also calculated in EcoSim. If there is guild organization within the assemblage, the variance in niche overlap will be greater than expected (Inger & Colwell, 1977), because species pairs within guilds tend to have high overlap, whereas pair-wise overlap among guilds are usually low, generating large variances.
Results
Relative volumes of food items, trophic guild and niche breadth for all species collected in each spatial-temporal unit are shown on Table 1.
Niche breadth values were overall low for the fish fauna, occurring in approximately 60% of the species, regardless the site or period. Intermediate and high values of niche breadth were less frequent, occurring in approximately 10 - 20% of the species (Fig. 3). Mean values were as follow: 0.273 pond flood, 0.305 pond drought, 0.314 river flood and 0.218 river drought and did not differ significantly (F = 1.19; p = 0.32) (Fig. 4).
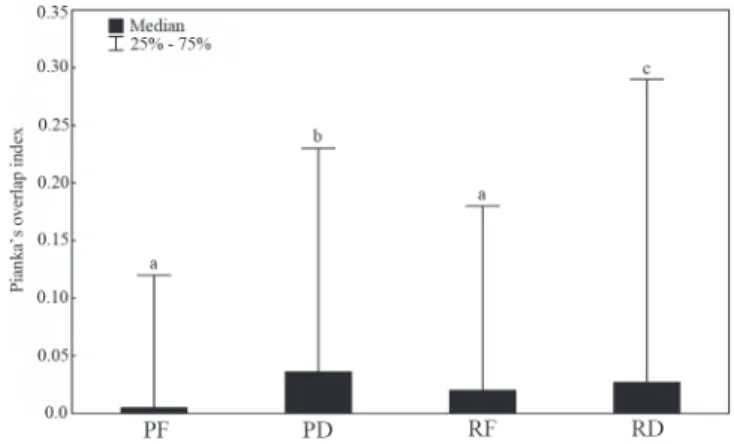
Feeding overlap values were mostly low (0 - 0.4). Intermediate and high values were registered in all spatial-temporal units, but in frequencies lower than 20% (Fig. 5). The means varied significantly among the spatial temporal units (H = 22.2; p = 0.0001). Mean values were as follow: 0.0051 pond flood, 0.036 pond drought, 0.020 river flood, and 0.027 river drought and differences were non-significant among them (Fig. 6).
All observed values were significantly higher than those expected by chance (null communities) with both the reshuffled zeroes (RA3) and retained zeroes (RA4) options, showing evidence of significant resource sharing. Patterns of variance in overlap among fishes accompanied those of niche overlap, with observed values higher than those expected by chance (p<0.01) in all spatial-temporal units (Table 2), indicating statistically significant guild structure.
Discussion
Based on the assumption that niche breadth values are a measure of trophic specialization (Hurlbert, 1978), the fish fauna of both Chacororé pond and Cuiabá River can be considered as specialist. Values near zero were obtained by those species that consumed exclusively fish (several species) or plants (Pterodoras granulosus and Piaractus mesopotamicus). As expected, omnivorous species have shown the highest values. Pouilly et al. (2004) also found a high degree of trophic specialization (especially for piscivores)
Table 1. Diet composition (volume %) of the fish fauna in the seasonal Brazilian Pantanal, Cuiabá River basin, Mato Grosso State, Brazil. N = stomach contents analyzed. SL = standard length. AL = algae, DS = detritus/sediment, HP = vascular plant, ZO = zooplankton, TI = terrestrial insects, AI = aquatic invertebrates. SC = scales, FI = fish. Number in bold indicate the main food resource (V > 51%). Ba = standardized trophic niche breadth.
N SL (cm) AL DS VP ZO TI AI SC FI Guilds Ba
Pond Flood
Pristigasteridae
Pellona flavipinis 8 9.0-31.5 - - - 0.3 - 99.7 Pis 0.006
Curimatidae
Curimatella dorsalis 4 4.8-11.3 0.61 61.9 37.4 - - - Det 0.456
Potamorhina squamoralevis 6 20.0-22.5 25.6 73.5 - - - 1 - - Det 0.325
Psectrogaster curviventris 9 10.5-14.0 25.4 20.6 54 - - - Her 0.755
Steindachnerina conspersa 2 6.0-10.2 33.3 66.7 - - - Det 0.799
Hemiodontidae
Hemiodus orthonops 13 8.8-19.5 78 13.4 8.6 - - - Alg 0.289
Prochilodontidae
Prochilodus lineatus 8 20.5-31.5 10.1 70.7 17.7 0.46 - 1.03 - - Det 0.212
Anostomidae
Leporinus lacustris 3 9.6-12.2 - 4.21 91.6 - - 4.21 - - Her 0.093
Gasteropelecidae
Thoracocharax stellatus 5 2.2-4.6 - - - - 79.6 20.4 - - Ins 0.481
Characidae
Aphyocharax anisitsi 52 1.5-3.2 - 30.2 0.04 0.48 1.17 68.1 - - Inv 0.200
Aphyocharax dentatus 22 3.2-5.4 - - - 0.06 1.9 0.84 - 97.2 Pis 0.019
Astyanax abramis 2 6.5-7.4 - - 11.1 - 0.44 88.5 - - Inv 0.128
Moenkhausia bonita 29 1.8-3.0 - - - 8.3 36.8 54.9 - - Inv 0.627
Moenkhausia dichroura 16 1.8-5.2 - 1.84 69 0.69 6.46 12 - - Her 0.139
Poptella paraguayensis 5 3.3-3.7 - 12.8 45.3 - 32.5 9.4 - - Omn 0.659
Psellogrammus kennedyi 2 2.3-2.6 - - 50 50 - - - - Omn 1.000
Pygocentrus nattereri 33 11.7-26.4 - - 0.4 - 0.1 0.2 - 99.3 Pis 0.005
Rhaphiodon vulpinus 3 12.4-50.5 - - - 2.2 - 97.8 Pis 0.045
Roeboides descalvadensis 39 3.8-6.4 - - - 30.9 69.1 - Lep 0.525
Salminus brasiliensis 3 18.5-37.5 - - - 5.5 - 94.5 Pis 0.116
Serrasalmus maculatus 6 7.2-15.6 - - 2.5 - - - - 97.5 Pis 51
Tetragonopterus argenteus 23 3.7-8.0 - 0.05 51 - 3.5 0.07 - 45.3 Her 0.286
Triportheus pantanensis 40 2.2-9.5 72.7 0.29 9.17 - 3.3 14.5 - - Alg 0.197
Triportheus nematurus 66 1.8-17.2 28.7 4 6.1 10.2 9.1 41.9 - 0.07 Omn 0.425
Erythrinidae
Hoplias aff. malabaricus 6 1.8-15.7 - - - 0.3 - 99.7 Pis 0.006
Loricariidae
Pterygoplichthys anisitsi 3 28.0-34.0 46.5 44 5.5 0.7 - 3.3 - - Omn 0.354
Heptapteridae
Pimelodella gracilis 2 7.3-7.6 - - - - 7.4 92.6 - - Inv 0.159
Pimelodidae
Pimelodus cf. argenteus 16 10.3-16.5 - 0.03 8.4 - 0.02 1.9 - 89.6 Pis 0.059
Pimelodus maculatus 24 3.6-20.1 0.63 12.4 24.5 - 5.15 12.6 - 44.7 Omn 0.481
Doradidae
Pterodoras granulosus 10 21.5-28.0 - - 100 - - - Her 0.000
Auchenipteridae
Auchenipterus nigripinnis 2 17.0-17.5 - - 1.2 - 2.5 96.3 - - Inv 0.039
Auchenipterus osteomystax 6 17.5-20.5 - - - - 0.08 95.3 - 4.6 Inv 0.049
Sternopygidae
Eigenmannia trilineata 4 11.0-14.0 0.6 25.8 - 1.2 - 72.4 - - Inv 0.231
Eigenmannia virescens 2 13.7 - - 0.3 - 56.5 43.2 - - Ins 0.488
Sciaenidae
Plagioscion ternetzi 32 3.4-27.7 - 0.4 0.3 0.4 0.08 20.8 - 78 Pis 0.107
Cichlidae
Gymnogeophagus balzanii 2 2.8-8.5 1.2 0.6 - 0.6 - 4.1 - 93.6 Pis 0.035
Pond Drought
Curimatidae
Potamorhina squamoralevis 5 20.5-22.9 15.8 64.2 12.4 7.6 - - - - Det 0.394
Prochilodontidae
Prochilodus lineatus 3 29.0-32.0 20 78.7 1.3 - - - Det 0.258
Crenuchidae
Characidium aff. zebra 6 1.8-2.9 - - - 3.7 3.7 92.5 - - Inv 0.083
Gasteropelecidae
Thoracocharax stellatus 7 3.2-4.0 - - - - 78.3 21.7 - - Ins 0.515
Characidae
Aphyocharax anisitsi 11 2.2-2.8 - 5.1 - - 85.4 9.5 - - Ins 0.175
Aphyocharax dentatus 58 1.8-5.5 - 0.19 0.12 - 7.7 11.3 - 80.7 Pis 0.123
Astyanax abramis 5 4.0-5.1 - - 11.5 - 74.3 11.9 - 2.3 Ins 0.241
Bryconamericus exodon 9 2.0-3.5 - 0.15 - 4.4 75.9 19.6 - - Ins 0.207
Hyphessobrycon eques 12 1.7-2.2 - 7 3.3 0.33 29.8 59.6 - - Inv 0.306
Table 1 (cont.). Diet composition (volume %) of the fish fauna in the seasonal Brazilian Pantanal, Cuiabá River basin, Mato Grosso State, Brazil. N = stomach contents analyzed. SL = standard length. AL = algae, DS = detritus/sediment, HP = vascular plant, ZO = zooplankton, TI = terrestrial insects, AI = aquatic invertebrates. SC = scales, FI = fish. Number in bold indicate the main food resource (V > 51%). Ba = standardized trophic niche breadth.
N SL (cm) AL DS VP ZO TI AI SC FI Guilds Ba
Moenkhausia dichroura 3 3.2-4.4 3.1 - - 12.3 63.1 21.5 - - Ins 0.391
Poptella paraguayensis 9 3.3-3.6 - 4 0.31 8.9 37.9 48.9 - - Omn 0.387
Psellogrammus kennedyi 10 2.6-3.7 - 1.6 18.7 17.3 15.6 46.8 - - Omn 0.560
Pygocentrus nattereri 32 10.0-25.4 - - - 100 Pis 0.000
Rhaphiodon vulpinus 5 35.0-46.0 - - - 100 Pis 0.000
Roeboides descalvadensis 22 2.0-6.0 - 0.32 - - 0.32 57.8 9.5 32.1 Inv 0.310
Roeboides prognathus 7 5.0-5.6 - - 9.8 - - 27.9 62.3 - Lep 0.551
Salminus brasiliensis 3 35.5-43.5 - - - 100 Pis 0.000
Tetragonopterus argenteus 9 3.8-9.6 - 0.88 24.5 - 41.4 23.9 - 9.3 Omn 0.591
Triportheus pantanensis 7 5.0-12.5 - - 83.1 - 3.3 13.6 - - Her 0.204
Triportheus nematurus 22 6.9-18.0 18.3 - 15.3 17.1 43.4 6 - - Omn 0.649
Erythrinidae
Hoplias aff. malabaricus 9 9.6-27.0 - - - 22.7 - 77.3 Pis 0.541
Loricariidae
Pterygoplichthys anisitsi 14 16.0-33.0 2.2 97.6 - 0.06 - 0.08 - - Det 0.016
Heptapteridae
Pimelodella gracilis 39 5.0-6.8 - 1.3 15.2 - 19.5 60.5 - 3.5 Inv 0.333
Pimelodella mucosa 15 5.2-7.3 0.07 0.22 0.22 - - 99.5 - - Inv 0.003
Pimelodidae
Pimelodus cf. argenteus 50 7.2-18.5 - 3.7 44.9 - 4.8 25.9 - 20.7 Omn 0.543
Pimelodus maculates 17 4.4-14.4 0.03 47.5 4.3 - 3.8 4.6 - 39.8 Omn 0.314
Doradidae
Trachydoras paraguayensis 3 6.4-9.5 0.15 23.8 11.5 6.9 - 57.6 - - Inv 0.365
Auchenipteridae
Auchenipterus nigripinnis 18 17.0-20.0 - - - - 65.7 33.6 - 0.65 Ins 0.418
Auchenipterus osteomystax 16 13.5-20.0 - - - - 84.6 15.4 - - Ins 0.352
Sternopygidae
Eigenmannia virescens 65 1.0-13.8 - 1.4 0.16 0.48 5.2 92.8 - - Inv 0.039
Sciaenidae
Plagioscion ternetzi 19 1.5-31.0 - - 0.09 - 0.03 48.6 - 51.3 Pis 0.334
Cichlidae
Bujurquina vittata 4 2.2-3.0 - 9.1 27.3 - 18.2 18.2 - 27.3 Omn 0.868
Gymnogeophagus balzanii 15 2.2-7.2 6.4 2.7 11.9 11.8 0.32 66.7 - 0.16 Inv 0.182
River Flood Curimatidae
Curimatella dorsalis 4 4.4-8.5 11.7 52.5 35.8 - - - Det 0.698
Potamorhina squamoralevis 2 17.5-21.0 20 80 - - - Det 0.471
Psectrogaster curviventris 9 11.4-13.0 23 11.5 65.5 - - - Her 0.510
Steindachnerina nigrotaenia 7 3.6-7.3 12.3 87.7 - - - Det 0.275
Prochilodontidae
Prochilodus lineatus 2 6.0 12.5 87.5 - - - Det 0.280
Anostomidae
Abramites hypselonotus 11 5.2-10.5 1.2 10.5 88.3 - - - Her 0.132
Gasteropelecidae
Thoracocharax stellatus 54 1.8-4.3 - 1.8 0.25 - 83.4 14.6 - - Ins 0.131
Characidae
Aphyocharax dentatus 15 2.2-5.6 - 0.3 - - 11.2 24 - 64.5 Pis 0.264
Astyanax abramis 3 5.3-6.2 - - 75.1 - 23.6 1.3 - - Her 0.307
Astyanax sp. 1 3 3.4-3.7 - 3.2 16.1 - 80.6 - - - Ins 0.239
Bryconamericus exodon 44 1.7-3.8 - 3.7 11 12.2 44.5 27.4 - 1.2 Omn 0.463
Bryconops melanurus 4 3.4-5.0 - - - - 78.9 21.1 - - Ins 0.499
Clupeacharax anchoveoides 3 4.0-4.2 - 25.5 - - 5.6 69.1 - - Inv 0.417
Galeocharax humeralis 14 4.1-18.0 - 0.5 - - - 1.5 - 98 Pis 0.020
Moenkausia bonita 20 1.8-2.4 - - - 26.6 7.2 66.2 - - Inv 0.472
Moenkhausia dichroura 7 3.9-5.0 - 33.2 43.1 - 13.9 7.1 - 2.8 Omn 0.529
Poptella paraguayensis 4 3.0-3.6 - 2.7 - - 59.3 38 - - Ins 0.507
Pygocentrus nattereri 22 16.4-24.5 - - 0.7 - - - - 99.3 Pis 0.014
Rhaphiodon vulpinus 3 28.0-36.0 - - - 100 Pis 0.000
Roeboides descalvadensis 3 3.9-5.3 - - - - 28.2 49.2 22.6 - Omn 0.842
Roeboides microlepis 2 13.7 - - - 100 Pis 0.000
Roeboides prognathus 16 6.2-10.5 - - - 100 - Lep 0.000
Salminus brasiliensis 4 11.0-20.0 - - - 100 Pis 0.000
Serrasalmus marginatus 10 16.0-26.5 - - - 100 Pis 0.000
Tetragonopterus argenteus 11 1.9-8.5 - 1.9 0.68 0.12 8.6 6.7 - 82.1 Pis 0.091
Triportheus pantanensis 3 10.8-13.3 - - 65.3 - 30.6 4.1 - - Her 0.458
Triportheus nematurus 10 11.3-17.5 - - 65.4 - 22.4 12.2 - - Her 0.515
Heptapteridae
Table 1 (cont.). Diet composition (volume %) of the fish fauna in the seasonal Brazilian Pantanal, Cuiabá River basin, Mato Grosso State, Brazil. N = stomach contents analyzed. SL = standard length. AL = algae, DS = detritus/sediment, HP = vascular plant, ZO = zooplankton, TI = terrestrial insects, AI = aquatic invertebrates. SC = scales, FI = fish. Number in bold indicate the main food resource (V > 51%). Ba = standardized trophic niche breadth.
N SL (cm) AL DS VP ZO TI AI SC FI Guilds Ba
Pimelodidae
Iheringichthys labrosus 11 1.8-14.0 - 10.9 2.5 - 20.7 24.1 - 41.9 Omn 0.616
Pimelodus cf. argenteus 41 3.8-15.5 - 1.6 6 - 24.6 6 - 61.8 Pis 0.306
Doradidae
Pterodoras granulosus 21 18.5-37.5 - - 100 - - - Her 0.000
Auchenipteridae
Ageneiosus ucayalensis 4 3.0-23.5 - - - - 1.6 16.4 - 82 Pis 0.215
Auchenipterus nigripinnis 11 1.7-18.5 - - - - 64.1 35.9 - - Ins 0.853
Entomocorus benjamini 4 2.6-3.1 - 10.5 - 22.8 40.4 23.3 - - Omn 0.795
Sternopygidae
Eigenmannia trilineata 6 0.8-15.7 - 15.9 - - - 84.1 - - Inv 0.365
Eigenmannia virescens 14 0.7-23.8 - 2.6 0.2 - 5.4 91.8 - - Inv 0.061
Sciaenidae
Plagioscion ternetzi 3 28.0-29.0 - - - 100 Pis 0.000
River Drought Curimatidae
Potamorhina squamoralevis 5 18.2-22.6 12.5 87.5 - - - Det 0.280
Steindachnerina conspersa 2 5.7-9.3 29.3 63.4 7.3 - - - Det 0.514
Steindachnerina nigrotaenia 3 4.8-6.3 14 86 - - - Det 0.317
Prochilodontidae
Prochilodus lineatus 4 22.0-35.0 2.1 96 1.5 0.049 - 0.34 - - Det 0.021
Anostomidae
Abramites hypselonotus 2 9.3-10.1 - 85.7 13.5 - - 0.8 - - Det 0.164
Crenuchidae
Characidium aff. zebra 5 2.4-3.0 - 98.9 - - - 1.1 - - Det 0.022
Hemiodontidae
Hemiodus orthonops 9 13.9-18.5 7.3 90.8 0.74 1.1 - - - - Det 0.068
Gasteropelecidae
Thoracocharax stellatus 52 1.9-5.0 - 0.048 0.78 - 65.4 33.8 - - Ins 0.282
Characidae
Aphyocharax dentatus 49 2.0-5.7 - 4 0.079 11.7 11.1 10.3 - 65.8 Pis 0.230
Astyanax abramis 5 4.6-5.8 - 10.6 21.3 - 51.7 - - 16.4 Ins 0.617
Bryconamericus exodon 59 1.6-3.8 - 2.31 0.76 4.1 41.4 51.1 - 0.38 Inv 0.260
Bryconops melanurus 2 1.7-2.6 - - - - 100 - - - Ins 0.000
Bryconamericus sp. 1 15 2.5-3.7 - 12.7 - - 63.8 18.8 - 4.7 Ins 0.390
Galeocharax humeralis 20 7.5-22.0 - - - 100 Pis 0.000
Moenkhausia bonita 2 2.8-4.0 - 0.43 - - - 0.43 - 99.1 Pis 0.009
Moenkhausia dichroura 16 3.2-4.8 0.59 24.1 40.6 5.3 27.1 2.4 - - Omn 0.467
Mylossoma duriventre 20 10.7-17.5 1.6 1.7 95.4 - 0.77 0.1 - 0.48 Her 0.020
Piabarchus analis 5 2.4-2.9 - 17.7 - - 82.3 - - - Ins 0.411
Piaractus mesopotamicus 3 33.5-45.5 - - 100 - - - Her 0.000
Pygocentrus nattereri 13 19.0-32.0 - - - 100 Pis 0.000
Roeboides descalvadensis 20 3.8-6.4 - - - 30.9 69.1 - Lep 0.745
Roeboides microlepis 19 9.2-19.5 - - - - 0.65 5.6 13.5 80.3 Pis 0.167
Roeboides prognathus 55 0-9.6 0.03 - - - 0.7 - 0.17 99.1 Pis 0.006
Salminus brasiliensis 2 28.5-38.5 - - - 100 Pis 0.000
Serrasalmus maculatus 5 12.5-15.5 - - - 100 Pis 0.000
Serrasalmus marginatus 10 7.3-24.5 - - - 100 Pis 0.000
Tetragonopterus argenteus 11 4.4-9.2 - 23.9 18.1 - 2.5 12.9 - 42.5 Omn 0.619
Triportheus pantanensis 2 5.9-6.7 - - - - 100 - - - Ins 0.000
Triportheus nematurus 15 9.0-17.5 - 0.52 5.1 - 84.6 9.8 - - Ins 0.125
Heptapteridae
Pimelodella gracilis 34 3.2-6.7 - 11 0.6 - 21 57 - 10.4 Inv 0.388
Pimelodidae
Iheringichthys labrosus 7 10.2-17.4 - 16.3 1.1 - 12 70.6 - - Inv 0.284
Pimelodus cf. argenteus 48 2.4-18.0 - 11.8 28.3 - 8.7 8.3 - 42.9 Omn 0.605
Pimelodus maculatus 3 6.5-9.7 - 20.2 6.4 - 10.8 0.31 - 62.3 Pis 0.312
Doradidae
Pterodoras granulosus 10 21.0-36.5 - - 84.1 - 0.66 12.4 - 2.8 Her 0.096
Trachydoras paraguayensis 7 5.0-8.0 - 34.2 - 29.1 3.4 33.3 - - Omn 0.125
Auchenipteridae
Auchenipterus nigripinnis 8 16.0-18.5 - 0.1 0.81 - 45.7 53.4 - - Inv 0.341
Auchenipterus osteomystax 3 19.3-21.0 - - - 100 - - Inv 0.000
Sternopygidae
Eigenmannia virescens 23 5.7-18.0 - 3.1 0.13 - 1 95.8 - - Inv 0.029
Sciaenidae
in the Mamoré River floodplain, Bolivia. Seasonal variations of niche breadth was demonstrated in other studies (e.g., Zaret & Rand, 1971; Prejs & Prejs, 1987; Machado-Allison, 1990), with highest values observed during the flooding period. Such results contrast with those of present study and with those found by Pouilly et al. (1999) for the fish fauna in the Mamoré floodplain. Tropical environments are prone to great seasonal variations in water dynamics (e.g., Lowe-McConnell, 1964; Zaret & Rand, 1971; Prejs & Prejs, 1987; Esteves & Galetti, 1995). The interpretation of patterns of resource partitioning and fish assemblage organization related to these variations has raised controversies (Novakowski et al., 2008). Whereas some studies report greater resource partitioning during drought periods when food is scarce (e.g., Goulding, 1980; Prejs & Prejs, 1987; Meschiatti, 1995), others have shown the opposite (e.g., Zaret & Rand, 1971). According Novakowski et al. (2008) it is possible consider two non-excluding
hypothesis: there is no seasonal pattern on the use of food resources and/or probably there are several patterns, because each one is based on characteristics of the site and the taxonomic composition of the resident species.
Pair-wise niche overlap values were mostly low between species pairs and were different between the flood and drought periods in the present study, like reported by Pouilly et al. (2003) for the fish assemblages in several small streams in Bolivia. This result contrasts with that found by Mérona & Rankin-de-Mérona (2004) for the Rei pond in the central region of the Amazonian floodplain, where the low values of trophic overlap (mean = 0.24) did not vary significantly between periods.
Despite the overall low niche overlap values, foraging patterns within the fish assemblage showed evidence of significant resource sharing, as all observed values of niche overlap were significantly higher than those expected by chance.
Fig. 3. Relative frequency of the trophic niche breadth (Ba) intervals of fish species in each spatial-temporal unit in the Cuiabá River basin, Mato Grosso State, Brazil. PF= Pond Flood; PD= Pond Drought; RF= River Flood; RD= River Drought. Trophic niche breadth was considered low (0-0.39), intermediate (0.4-0.6) or high (0.61-1) (modified of Grossman, 1986).
Fig. 4. Values of trophic niche breadth (mean±standard error) of fish species in each spatial- temporal units in the Cuiabá River basin, Mato Grosso State, Brazil. PF= Pond Flood; PD= Pond Drought; RF= River Flood; RD= River Drought. Trophic niche breadth was considered low (0-0.39), intermediate (0.4-0.6) or high (0.61-1) (modified of Grossman, 1986).
Fig. 5. Relative frequency of the Pianka’s symmetric index intervals among all fish species pars, in each spatial-temporal units in the Cuiabá River basin, Mato Grosso State, Brazil. PF = Pond Flood; PD= Pond Drought; RF= River Flood; RD = River Drought. Diet overlap was considered low (0-0.39), intermediate (0.4-0.6) or high (0.61-1) (modified of Grossman, 1986).
Consequently, competition apparently is not the main structuring force within the studied fish assemblage in this floodplain at Pantanal, both in lotic and lentic environments and during the whole year, regardless the rain regime. However, conclusions about competition as a structuring factor in biological assemblages based only on overlap measures are controversial, as they might raise circular thoughts. For example, large overlap values imply shared resource utilization and lack of competition; however, it is also possible that high overlap implies strong competition that has not yet led to segregation in resource use (Gotelli & Graves, 1996). Null models can only indicate which direction observed patterns are in, and as such, our results indicate resource sharing, although overlap values are counterintuitively small. Thus, additional data on resource availability and species interactions could provide more accurate answers regarding competition as a structuring mechanism within the Chacororé fish assemblage. Colwell & Futuyma (1971) stress out that only data on dietary overlap is not sufficient to test for the presence of competition, because low overlaps might result from competition in the past, within an evolutionary time scale (Connell, 1980). Likewise, significant overlap values do not imply competition if resources are abundant. A real observation of this phenomenon is extremely difficult, as species are highly mobile and competitive interactions are intense and also vary in a yearly basis according to prey availability (Raborn et al., 2004).
Patterns of overlap variances followed the mean niche overlap values, i.e., were significantly greater than expected by chance, indicating that the fish fauna in the studied sites and throughout the year is structured in trophic guilds. Tropical fish assemblages are usually structured in trophic guilds, except in low diversity environments during determinate seasons (Winemiller & Pianka, 1990). If there is
guild organization within the assemblage, the variance in niche overlap will be greater than expected, because species pairs within guilds tend to show high overlap, whereas pair-wise overlap among guilds are usually low, generating large variances (Inger & Colwell, 1977; Gotelli & Graves, 1996).
A pre-requisite for coexistence is that each species displays distinct ecological responses to similar ecological processes. Stochastic processes might, in some cases, relax interspecific competition allowing the coexistence of several species. Taphorn & Lilyestrom (1985) argue that the coexistence of more than 100 fish species in the Venezuelan llanos is possible, in part, because relaxation in interspecific competition occurs during the flood period as a result of the horizontal flood and increase in primary production. Grossman et al. (1990) stress out that fish mortality associated to episodes of drought and flood might prevent resource limitation of competitive exclusion, thus allowing the coexistence of species that use similar resources.
Although the niche theory and the neutral theory (Hubbell, 2001) postulate opposite ideas as related to assemblage structure and species coexistence (Harte, 2004; Gaston & Chown, 2005), some communities are influenced both by stochastic events and competition (Gravel et al., 2006; Herder & Freyhof, 2006). It seems to demonstrate that a combination of these concepts might occur and that the two theories can be considered as opposite ends of a continuum (Gravel et al., 2006; Leibold & McPeek, 2006). These controversies, however, need to be solved if we aim to conserve biodiversity in a rapidly changing world (Holt, 2006), as these two views of assemblage structure and function have completely different implications on conservation strategies and management of natural resources.
Patterns of resource utilization and guild formation shown by the fish fauna in the studied region of the Brazilian Pantanal suggest that even though resource sharing prevails within these communities, it does not impede species coexistence. High abundance of resources and stochastic processes might promote a relaxation of interspecific competition and facilitate coexistence.
Acknowledgements
We express our appreciation to Nupélia (Núcleo de Pesquisas em Limnologia, Ictiologia e Aquicultura) and to PEA (Programa de Pós-Graduação em Ecologia de Ambientes Aquáticos Continentais) for their financial support and infrastructure, and CAPES (Coordenação de Aperfeiçoamento de Pessoal de Nível Superior) and CNPq (Conselho Nacional de Desenvolvimento Científico e Tecnológico) in terms of personal grants.
Literature Cited
Albrecht, M. & N. K. Gotelli. 2001. Spatial and temporal niche partitioning in grassland ants. Oecologia, 126(1): 134-141. Bell, G. 2001. Neutral macroecology. Science, 293(5539): 2413-2418.
Model Mean
observed Mean simulated P obs.
Variance observed
Variance simulated P var. Pond Flood
RA3 0.16 0.066 0.0 0.084 0.031 0.0
RA4 0.16 0.10 0.001 0.084 0.00004 0.0
Pond Drought
RA3 0.17 0.096 0.0 0.061 0.030 0.0
RA4 0.17 0.13 0.001 0.061 0.040 0.0
River Flood
RA3 0.16 0.076 0.0 0.074 0.031 0.0
RA4 0.16 0.13 0.007 0.074 0.053 0.0
River Drought
RA3 0.19 0.075 0.0 0.083 0.031 0.0
RA4 0.19 0.13 0.0 0.083 0.052 0.0
Britski, H. A., K. Z. S. Silimon & B. S. Lopes. 1999. Peixes do Pantanal - manual de identificação. Brasília, Empresa Brasileira de Pesquisa Agropecuária. EMBRAPA, 184p.
Chase, J. M. & M. A. Leibold. 2003. Ecological niches: linking classical and contemporary approaches. Chicago, University of Chicago Press, 212p.
Colwell, R. K. & D. J. Futuyma. 1971. On the measurement of niche breadth and overlap. Ecology, 52: 567-576.
Connell, J. H. 1980. Diversity and the coevolution of competitors, or the ghost of competition past. Oikos, 35: 131-138 Esteves, K. E. & P. M. Galetti. 1995. Food partitioning among some
characids of a small Brazilian floodplain lake from the Paraná river basin. Environmental Biology of Fishes, 42: 375-389. Gaston, K. J. & S. T. Chown. 2005. Neutrality and the niche.
Functional Ecology, 19: 1-6.
Gotelli, N. J. & G. L. Entsminger. 2007. EcoSim: Null models software for ecology. Version7. Acquired Intelligence Inc. & Kesey-Bear. Jericho, VT 05465. http://garyentsminger.com/ecosim.htm. Gotelli, N. J. & G. R. Graves. 1996. Null models in ecology.
Wa-shington, Smithsonian Institution, 368p.
Goulding, M. 1980. The fishes and the forest. Berkeley, University of California Press, 280p.
Gravel, D., C. D. Canham, M. Beaudet & C. Messier. 2006. Reconciling niche and neutrality: the continuum hypothesis. Ecology Letters, 9: 399-409.
Grossman, G. D. 1986. Food resources partitioning in a rocky intertidal fish assemblage. Journal of Zoology, 1: 317-355. Grossman, G. D., J. F. Dowd & M. C. Crawford. 1990. Assemblage
stability in stream fishes: a review. Environmental Management, 14: 661-671.
Hahn, N. S., R. Fugi, V. E. Loureiro-Crippa, D. Peretti & M. R. Russo. 2004. Trophic structure of the fish fauna. Pp. 139-143. In: Agostinho, A. A., L. Rodrigues, L. C. Gomes, S. M. Thomaz & L. E. Miranda (Eds.). Structure and functioning of the Paraná River and its floodplain. Editora da Universidade Estadual de Maringá, EDUEM, Maringá.
Harte, J. 2004. The value of null theories in ecology. Ecology, 85: 1792-1794.
Hellawell, J. M. & R. Abel. 1971. A rapid volumetric method for the analysis of the food of fishes. Journal of Fish Biology, 3: 29-37. Herder, F. & J. Freyhof. 2006. Resource partitioning in a tropical
stream fish assemblage. Journal of Fish Biology, 69: 571-589. Holt, R. D. 2006. Emergent neutrality. Trends in Ecology and
Evolution, 21: 531-533.
Hubbell, S. P. 2001. The Unified Neutral Theory of Biodiversity and Biogeography. Princeton, Princeton University Press, 448p. Hurlbert, S. H. 1978. The measurement of niche overlap and some
relatives. Ecology, 59: 67-77.
Hyslop, E. P. 1980. Stomach contents analysis, a review of methods and their application. Journal of Fish Biology, 17: 411-429. Inger, R. & R. K. Colwell. 1977. Organization of contiguous
communities of amphibians and reptiles in Thailand. Ecological Monographs, 47: 229-253.
Krebs, C. J. 1999. Ecological methodology. New York, Benjamin Cummings, 620p.
Leibold, M. A. & M. A. McPeek. 2006. Coexistence of the niche and neutral perspectives in community ecology. Ecology, 87: 1399-1410.
Lowe-McConnell, R. H. 1964. The fishes of the Rupununi savanna district of British Guiana, South America. Part 1. Ecological groupings of fish species and effects of the seasonal cycle on the fish. Journal of the Linnean Society (Zoology), 45: 103-144.
Machado-Allison, A. 1990. Ecologia de los peces de las areas inundables de los Llanos de Venezuela. Interciencia, 15: 411-423.
Manly, B. F. J. 1991. Ranzomization and Monte Carlo Methods in Biology. London, Chapman and Hall, 281p.
Mérona, B. & J. Rankin-de-Mérona. 2004. Food resource partitioning in a fish community of the central Amazon floodplain. Neotropical Ichthyology, 2:75-84.
Meschiatti, A. J. 1995. Alimentação da comunidade de peixes de uma Lagoa Marginal do rio Mogi Guaçu, SP. Acta Limonologica Brasiliensia, 8: 115-137.
Mikkelson, G. M. 2005. Niche-Based vs. Neutral Models of Ecological Communities.Biology and Philosophy, 20: 557-566. Myers, N., A. M. Russell, C. G. Mittermeier, G. A. B. Fonseca & J. Kent. 2000. Biodiversity hotspots for conservation priorities. Nature, 403:853-858.
Nobis, M. & T. Wohlgemuth. 2004. Trend words in ecological journals over the last 25 years (1978-2002). Oikos, 106: 411-421. Novakowski, G. C., N. S. Hahn & R. Fugi. 2008. Diet seasonality
and food overlap of the fish assemblage in a Pantanal pond. Neotropical Ichthyology, 6: 567-576.
Pianka, E. R. 1974. Niche overlap and diffuse competition. Proceedings of National Academy of Sciences, 71(5): 2141-2145.
Pouilly, M., S. Barrera & C. Rosales. 2006. Changes of taxonomic and trophic structure of fish assemblages along an environmental gradient in the Upper Beni (Bolivia). Journal of Fish Biology, 68: 137-156.
Pouilly, M., C. Ibañez, M. Guttierez & T. Yunoki. 1999. Funcionamiento ecológico de las lagunas de la zona de inundación del río Mamoré (Beni - Bolivia). Revista Boliviana de Ecologia, 6: 41-54.
Pouilly, M., F. Lino, J. G. Bretenoux & C. Rosales. 2003. Dietary-morphological relationships in a fish assemblages of the Bolivian Amazonian floodplain. Journal of Fish Biology, 62: 1137-1158. Pouilly, M., T. Yunoki, C. Rosales & L. Torres. 2004. Trophic
structure of fish assemblages from Mamoré river floodplain lakes (Bolivia). Ecology of Freshwater Fish, 13: 245-257. Prejs, A. & K. Prejs. 1987. Feeding of tropical freshwater fishes:
seasonality in resource availability and resource use. Oecologia, 71:397-404.
Raborn, S. W., L. E. Miranda & M. T. Driscoll. 2004. Diet overlap and consumption patterns suggest seasonal flux in the likelihood for exploitative competition among piscivorous. Ecology of Freshwater Fish, 13: 276–284.
Ross, S. T. 1986. Resource partitioning in fish assemblages: a review of field studies. Copeia, 1986: 352-388.
Schoener, T. W. 1974. Resource partitioning in ecological communities. Science, 185: 27-39.
StatSoft, Inc. 2005. STATISTICA (data analysis software system), version 7.1. www.statsoft.com.
Taphorn, D. C. & C. G. Lilyestrom. 1985. Fishes of the Fernando Corrales module. Results of the icththyological investigation of project CONICIP-PIMA -18. Revista UNELLEZ de Ciencia y Tecnologia, 3: 55-85.
Winemiller, K. O. & E. R. Pianka. 1990. Organization in natural assemblages of desert lizards and tropical fishes. Ecological Monographs, 60: 27-55.
Zaret, T. M. & A. S. Rand. 1971. Competition in tropical stream fishes: support for the competitive exclusion principle. Ecology, 52: 336-342.