DISCLOSURES AND DISCLAIMER AT THE END OF THE DOCUMENT PAGE 1/34 SEE MORE INFORMATION AT WWW.FE.UNL.PT
We are initiating the coverage of Sonaecom (SNC) with a Hold recommendation as our price target of € 2.20 presents a restrained 12% upside potential for the year 2010.
Optimus is Sonaecom’s core business. We anticipate top line performance to be driven in coming years mainly by increasing penetration of mobile broadband. EBITDA has been presenting a strong performance and we anticipate continual improvements in the next few years on the back of further MTR cuts and on the ability demonstrated in the last quarters to reduce costs.
Sonaecom Fixed has been presenting a weak performance
as a consequence of Fixed Market deterioration and lack of a competitive bundle offer. Fibre build up remains doubtful and we anticipate an adjustment to macroeconomic conditions. We forecast revenues and EBITDA to slightly benefit in the coming years from the transference of ULL clients to Fibre.
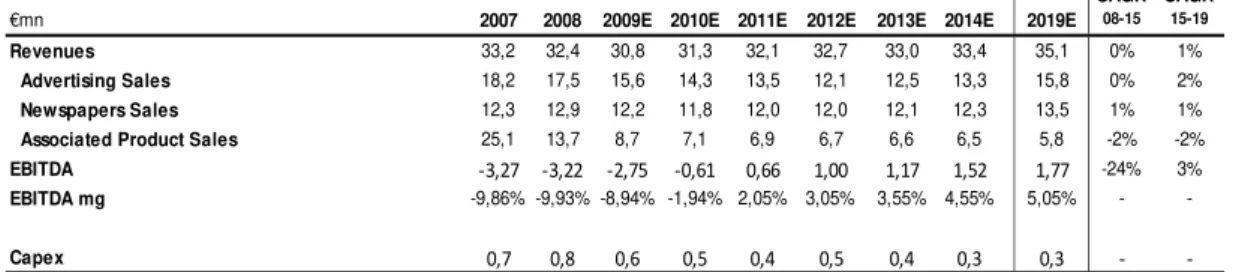
We expect SSI to continue posting positive results although with top line growth being affected by a fall in IT equipment sales. We expect Público’s performance to continue to be penalized by the market dynamic in terms of circulation figures but we expect a recovery in the advertising market.
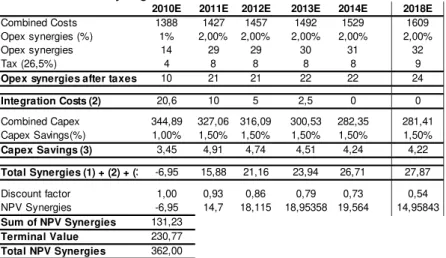
Faced with huge competitive pressure, we believe an M&A operation seems to be the main upside potential for our target company. We consider this operation highly rational as it would bring substantial synergies for both companies (€ 362mn). We do not expect it to happen immediately as it is being constrained by companies’ divergent perspectives, but we believe is just a matter of time.
06JANUARY 2010
S
ONAECOM
C
OMPANY
R
EPORT
T
ELECOMMUNICATIONSA
NALYST:
F
RANCISCAS
ILVA[email protected]
Returning to the old profitability
strategy rather than growth….
On the back of MTR cuts…
Recommendation: HOLD
Price Target FY10: 2.20 €
Potential 12%
Price (as of 6-Jan-10) 1.96 €
Reuters: SNC LS , Bloomberg: SNC PL
52-week range (€) 0.925-2.149
Market Cap (€m) 720.04
Outstanding Shares (m) 366.247 Float 67.58
Source: Bloomberg and Nova Equity Research Team
Source: Bloomberg
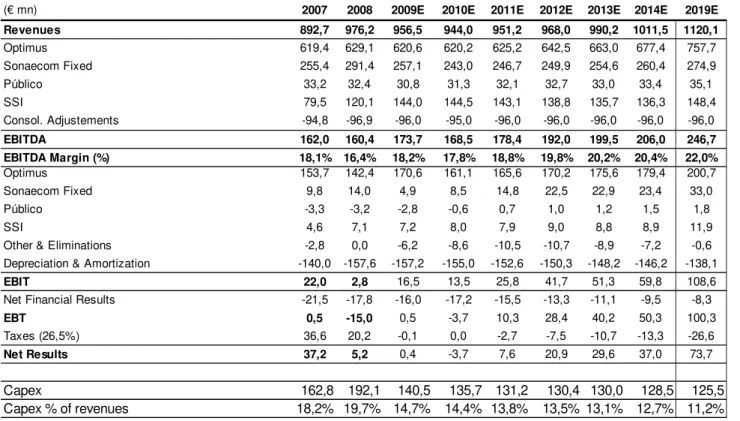
(Values in € millions) 2008 2009E 2010E Revenues 976.2 956.5 944.0
EBITDA 160.4 173.7 168.5
EBITDA margin 16.4% 18.2% 17.8%
Depreciation -157.6 -157.2 -155.0
EBIT 2.8 16.5 13.5
Net Income 5.2 0.4 -3.7
Net Debt 299.7 324.7 312.00
Capex 192.1 140.6 135.7
PAGE 2/34
Table of Contents
Valuation ... 3
Investment case ... 3
Valuation Methodology ... 3
Relative Valuation - Comparables ... 4
Company overview ... 5
Company Description ... 5
Shareholder structure ... 6
The Sector ... 7
E.U. TelecommunicationSector ... 7
Portuguese Telecommunication Sector ... 8
Business Units ... 9
Mobile Business - Optimus ... 9
Wireline Business – Sonaecom Fixed ... 20
Online and Media - Público ... 26
Software System Information (SSI) ... 27
Scenarios ... 29
Consolidation with Zon ... 29
Financials ... 32
PAGE 3/34
Valuation
Investment Case
We are initiating the coverage of Sonaecom (SNC) and we rate our target company with a Hold recommendation as our price target of € 2.20 offers a restrained 12% upside potential for the year 2010. We did not incorporate in our base case valuation any hypothetical merger between Sonaecom and Zon since we do not expect this to happen immediately. However, as we consider that a Merger or an Acquisition might be a possibility for Sonaecom to achieve a competitive scale and, therefore, to take advantage of the network effect, competing more efficiently, we further evaluate the possible synergies resulting from this process.
Valuation Methodology
We value Sonaecom using a DCF model for 10-year period through a Sum-of-the-parts analysis as Sonaecom is a holding company with different business profiles and this is the most appropriate method to catch the company risk profile. A different Cash Flow was estimated for each of SNC’s units and then discounted at an appropriate WACC rate reaching a total enterprise value for Sonaecom of €1118.40mn in 2010. After subtracting the expected value for 2010 Net Debt of €312.00m and dividing the result by the number of shares, we obtained a € 2.20 Price Target.
Table I: Valuation
Business Value (€ mn) SNC
stake (%) EV Weight Method
Optimus 984,0 100% 983,95 88% DCF (WACC=7,9%; g=2%)
Sonaecom Fixed 31,3 100% 31,35 3% DCF (WACC=8,3%; g=0%)
Público 8,9 100% 8,87 1% DCF (WACC=8,1%; g=0%)
SSI 94,2 100% 94,23 8% DCF (WACC=8,1%; g=2%)
Total EV (€mn) 1118,4 1118,40 100%
Net Debt 2010 (€mn) 312,00
Equity Value 806,40
# Shares 366
Price Target 2,20
Current Price 1,96
Upside Potential 12,4%
Source: Nova Equity Research Team
Main assumptions:
Our base case scenario estimates 10 years of expected Cash Flows for each of Sonaecom’s four business units plus its terminal value which starts to be accounted in 2020. The terminal growth rate is different for each business unit reflecting different perceptions for future performance of SNC business areas.
PAGE 4/34
Table II b: Optimus Sensitivity analysis
Perpetuity Growth Rate
1,5% 2,0% 2,5%
7,4% 2,31 2,47 2,67
7,9% 2,07 2,20 2,36
8,4% 1,89 2 2,12
Source: Nova Equity Research Team
€ per share
WA
CC
Optimus SCF Público SSI
Re 10,3% 10,9% 10,6% 10,6% Rf 3,37% 3,37% 3,37% 3,37% Market Premium 6,00% 6,00% 6,00% 6,00% Beta (leveraged) 1,15 1,25 1,2 1,2 Rd 4,41% 4,41% 4,41% 4,41% Cost of debt 6,00% 6,00% 6,00% 6,00% Tax Rate 26,5% 26,5% 26,5% 26,5% Leverage 30% 30% 30% 30%
WACC 7,9% 8,3% 8,1% 8,1%
g 2% 0% 0% 2%
Source: Nova Equity Research Team and Bloom berg
Table II: Sonaecom DCF Assumptions
Sonaecom Guidance (30%). The cost of debt (rd) reflects an average of the past rates at which Sonaecom financed its operations, company guidance and our perspectives for EURIBOR as SNC cost of debt is indexed to it (6%).
Using CAPM we were able to compute the cost of Equity (re) for each
business unit;
• We used the 10-year German Bond as the risk free rate (3.37%) and a Market Premium of 5.75%.
• In order to estimate each business Beta, we selected a group of comparable companies and we unlevered the obtained betas (regression with DJ EURO STOXX600) based on their last reported D/E ratios and respective tax rates. We then computed an average of the obtained unlevered betas and we turned to leverage the average beta according to our capital structure at market values. Being the core business of our target company, we ran a sensitivity analysis of Sonaecom valuation to different levels of Optimus WACC and perpetuity growth rate. We can conclude that perpetuity growth rate would have to be 0.5% lower and at the same time WACC 0.5% higher to get our price target at current market prices.
Relative Valuation – Comparables
PAGE 5/34
Sonaecom is trading at a premium to its peers (EV/EBITDA) for both mobile players and integrated operators. In our perspective it is not reasonable that SNC trades at a premium as although margins have improved in 3Q 2009, SNC continues to be an operator under pressure with lack of scale and limited growth perspectives which is a constraint for its margins. This is also reflected in EBITDA margins, having a much smaller subscribers base, SNC could not benefit from scale benefits as it happens with its peers. Therefore we would expect SNC to compare unfavourably with EU telcos. We believe this premium reflects YTD performance of SNC during 2009 which was greatly above the average. Moreover, implicit to it could be a speculative M&A operation as this issue was again mentioned in 2009.
Company overview
Sonaecom was founded in 1994 and is Sonae SGPS’s Telecommunications holding. Sonaecom operates in three business units: Telecommunications (Fixed and Mobile), Media and Software and Systems Information. The group’s core business is in the telecommunication sector. SNC provides its services for both corporate and residential customers in Portugal.
Company description
Sonaecom’s mobile business is carried out under the brand Optimus, providing mobile telecommunication services. Wireline services are provided under the brand Clix for residential clients and Novis for small to medium sized enterprises (SMEs) and Corporate. The media sector of the company is represented by Público, a daily newspaper in Portugal. Wedo, Bizdirect, Mainroad and Saphety are the companies providing IT & SI consultancy services.
PAGE 6/34 Table IV: Shareholders structure
Stake
Sonae SGPS 53,2%
France Telecom 20,0%
BCP 3,4%
Own shares 1,9%
Free Float 21,5%
Source: Company Data
Shareholder structure
Sonaecom is owned by three main investors: Sonae SGPS (53.16%), France Telecom (20%) and BCP (3.41%), with the remaining shares being divided between 1.90% of own shares and 21.43% of Free Float.
Sonae SGPS was founded in 1959 and originally its activity was focused on the wood sector. Later, in the eighties, it started to expand its business through a diversification strategy. The group’s presence in the telecoms industry started in 1994 on the back of Sonaecom. At that time it was already operating in three other sectors: wood, retail and shopping centers.
As a Holding company, it has to manage its diversified portfolio of companies, defining the guidelines and strategies for each business, trying to capture new business opportunities and taking advantage of potential synergies between group companies.
Sonae SGPS market capitalization is 1740.00M; at the moment is composed of: Sonae Sierra, Sonae Investimentos and Sonaecom which represents 10% of Sonae’s NAV. After the acquisition of Carrefour, Sonae became too leverage (Net Debt/ EBITDA 5.92x). Regarding its strategy, Sonae is focusing on the group’s expansion in higher growth potential business areas such as Distribution and Shopping Centers.
France Telecom was founded in 1990. The Group’s principal activity is to provide consumer and business fixed and mobile voice and data services. It is the reference partner for Sonaecom, bringing experience and know-how in those areas. FT has a strategic co-operation with Sonaecom in four main
segments: Roaming and Interconnection, Preferred networks partner
arrangements, multimedia services and handset procurement. In 2000 it consolidated its mobile position with Orange and is now the second largest European mobile telecommunications group with a market capitalization of 46006.03M.
Although a possible acquisition by FT is a long lasting issue, we believe the current situation in the Portuguese telecoms market is not very attractive. Even though FT already has a position in the Iberian market (Amena), we consider the Portuguese and Spanish mobile market offer different opportunities as the Portuguese market is already saturated (141.5% penetration rate in July 2009) in comparison with the Spanish penetration rate (119%), which is still below the E.U. average (122.4%). Moreover, FT management has announced they are currently looking for minority participations which rules out the possibility of an acquisition.
PAGE 7/34
Table V: Service revenue growth
3Q 08 4Q 08 1Q 09 2Q 09
Portugal 4,8% 1,4% 0,2% ‐1,4%
France 7,3% 4,7% 3,7% 3,1%
UK 5,7% 2,5% 0,0% ‐1,6%
Spain 2,1% ‐1,7% ‐5,8% ‐6,3%
Italy 2,8% 3,3% ‐0,3% 1,2%
Source: Companies data and Nova Equity Research
EDP. We perceive the decision to buy this stake as an investment strategy followed by the BCP fund, given that the main goal of an investment fund is to generate profit for investors. They must have seen an opportunity in the SNC stock price to receive future returns.
Analysing SNC’s shareholder structure and the impact in its business, our main conclusion is that the commitment of SNC’s main shareholder to expand its distribution and shopping centres abroad and the lack of interest that has been demonstrated in the telecommunication unit, including regular statements presenting willingness to integrate an M&A operation even losing control over the company, increase the possibility of a consolidation operation.
The Sector
E.U Telecommunication Sector
Bearing in mind the European Commission1 report, we would like to summarize last year’s (2008) evolution of the sector in the E.U.
Telecommunications provide a strong contribution to the Community GDP; Telco’s revenues in 2008 (€ 361 billion) represented around 3% of it. In 2008 this sector grew 1.3% in real terms which means it grew higher than the GDP (1% real growth rate).
Despite being a significant contributor to the GDP, 2008 telecommunication growth was smaller than in the previous year, which is a result of the high penetration ratio of 119% already achieved by mobile services in the E.U. (penetration rate is above 100% in 23 countries). It was also a consequence of the macroeconomic conditions that we are experiencing nowadays; although the financial crisis affected both operators’ capacity to invest and subscribers expenditure capacity, it has a minor impact in this sector in comparison with other sectors due to the essential nature of telecoms services which allow for more stable cash flows and low debt levels.
We have been observing to a slow pace in the growth of European service revenues. This is a consequence of both high penetration already achieved and pressure on voice usage and price. Revenues growth has mainly been driven by mobile broadband (€4billion) and multiple play offers.
Even though fixed business revenues still have a considerable weight in the total amount of revenues (49%), these have been affected by Fixed-Mobile substitution and the fixed business is continuously losing importance.
PAGE 8/34 28,2 33,3 38,2 52,1 48,6 55,8 30,3 28,2 31,0 36,9 46,7 42,5 0,0 10,0 20,0 30,0 40,0 50,0 60,0
144‐512 kbps
512‐1024 kbps
1‐2 Mbps 2‐4 Mbps 4‐8 Mbps 4‐20 Mbps Graph I: Price comparison for broadband
offers EU27, total cost/month (€)
April 2007 April 2008
Source: Progress Report on the Single European Electronic Communications Market in 2008 (14th report)
40% 39,80% 39,40% 39,40% 38,30%
31,20% 32,10% 32% 32,10% 31,20%
27,50% 28,20% 28,60% 28,60% 30,50%
0% 20% 40% 60% 80% 100% 120%
2004 2005 2006 2007 2008
Graph II: EU average mobile operators's market share
Leading op. Main competitor Other competitors Source: Progress Report on the Single European Electronic Communications Market in 2008 (14th report)
12,3 13,4
14,9
15,9
4,1 4,2 4,1 4,0
0,0 2,0 4,0 6,0 8,0 10,0 12,0 14,0 16,0 18,0
2006 2007 2008 2009E
Graph III: Portuguese mobile subscribers vs fixed
access (Mn)
Mobile Wireline
Concerning the drivers for the Mobile segment, voice services continue to be the main contributor for revenues but SMS (11%) and Broadband (3%) are clearly increasing their importance. We expect broadband to be the main booster for the future performance of the mobile market.
For the Fixed business, multiple play offers (including broadband) are the main driver for future evolution of revenues.
Considering Broadband, fixed Broadband penetration achieved 22.9% (+2.8% YoY) in 2008 but, as in Fixed Voice, the growth of this service has been prevented by the rising preference for Mobile Broadband, which, although with lower speed, is increasing in importance with 13% of penetration ratio. The competition in this segment leads to a decrease in prices and increase in speed and capacity, benefiting consumers.
Measures have been taken by the regulators in order to increase competition and create opportunities for alternative operators against the incumbent operators. Portability (+26% YoY) is one of these measures. Furthermore, in line with the aforementioned, the number of direct accesses in 2008 presented a +5% YoY growth.
On average the price of Fixed services has been slightly decreasing. Regarding
Mobile Services, price decline is nowadays a tendency viewed by the European Commission as result of the Regulator activity and competitive environment.
Portuguese Telecommunication Sector
In order to better understand the position of Sonaecom in the Portuguese Telecom Market we will attempt to describe the current situation and the future outlook of the sector.
The Portuguese Telco sector is extremely competitive with three main players in the fixed segment: Portugal Telecom (PT), ZON and Sonaecom and three mobile operators: Vodafone, PT and Sonaecom, which we consider too many for a market with only around 10 million inhabitants. If we compare the Portuguese market with France, which has 65mn inhabitants and the same number of mobile operators (3), we can perceive an imbalance.
Potential subscribers for mobile services will always be higher than for fixed services as the former are individuals and specific business lines and the latter take into account houses.
We believe the mobile and fixed segments have already achieved almost total potential market as the mobile service achieved a 146.2% penetration rate regarding mobile business and 4mn houses in a universe of 5.5mn houses (first and second houses). Opportunities in this sector arise from specific services in
PAGE 9/34
both segments that still have growth potential, namely mobile broadband for the mobile segment (12.10/100 inhabitants versus Spain with 25.9/100 inhabitants) and pay-tv for the fixed segment (44/100 houses in 3Q 09).
Market players face challenging conditions related with a variety of factors affecting business. This sector is highly regulated. Furthermore, at the moment there is some uncertainty about future Regulation of Mobile Termination Rates and Roaming. We must state that the evolution of the telco sector is constrained by a combination of several facts: Country Size, High Penetration Ratio of the Mobile Segment (141.5% versus 122.4% E.U in July 2009) and FTTH investment. Market trends such as Fix to Mobile movement, changes on consumer behaviour (bundles) and the “fight” for contents are also creating challenges for the companies operating in this sector.
Although Telecoms’ growth is constrained by a combination of factors, we believe there are areas where growth opportunities still exist. We are going to further describe mobile and fixed market trends and growth perspectives in each Sonaecom business areas valuation.
Mobile Business - Optimus
Background
Optimus is the core business of Sonaecom; it is the key contributor for Sonaecom performance. It was created in 1998 and is Portugal’s third-largest mobile operator (20%). It offers a wide variety of mobile services in three different segments: Residential, Small and Medium Size enterprises (SMES) and Corporate.
PAGE 10/34 20%
44% 36%
Graph IV: Portuguese mobile market shares (Jun 2009)
Optimus TMN Vodafone
Source: ICP-ANACOM
Mobile Sector Overview
Regarding the Mobile business, there are three players in this segment: TMN (44%), Vodafone (36%) and Optimus (20%). These market shares have been stable in the last 4 years which led us to label them as natural market shares. We believe the impact of the already existing MVNO (Talk to Talk Mobile, Worten Mobile, Rede4, Uzo, Vodafone Directo, Phone-ix, Zon Mobile and Continente Mobile) and the hypothetical future appearance of new MVNO should not represent a major threat for Mobile Operators’ Market Shares as usually MVNO target specific market niches aiming at a limited number of clients linked to MVNO by brand or by specific markets where the main players do not want to or cannot be. Moreover, we can perceive that the three market players are already focused on the typical MVNO niches, through low cost tariff plans such as TAG (Optimus) and also with low cost brands.
In recent years we have observed an impressive growth rate in number of subscribers (CAGR 9% 2004-20082), level of use (CAGR 2004-2008 of 43.4% for outgoing traffic and 40.2% for incoming traffic) and in the volume of service revenues which reached € 2.7mn at the end of 2008 (4.7% YoY growth).
10. 571. 10 0 1 1. 447. 31 3 12. 226. 43 9 13. 450. 93 1 1 4. 909. 59 5 15. 8 78. 71 9
5,70% 8,30% 6,80% 10,00% 10,80% 6,50%
0,00% 5,00% 10,00% 15,00% 20,00% 25,00% 30,00% 35,00% 40,00% 45,00% 0 2.000.000 4.000.000 6.000.000 8.000.000 10.000.000 12.000.000 14.000.000 16.000.000 18.000.000 20.000.000
2004 2005 2006 2007 2008 2009E
Graph V: Subscribers and Growth Rate Evolution
Suscribers Growth Source: ICP-ANACOM
By the end of 2008 there were 14.9 million subscribers (CAGR 9% 2004-20083). As this is already a mature market, we must expect this impressive growth rate to slow down in the next years. The most recent data disclosed by Anacom in 9 months 2009 announced 15.5 million subscribers reflecting a 3.3% QoQ growth and 6.9% YoY growth, which already shows the slowdown tendency.
According with data provided by Anacom, the recent evolution of subscribers was mainly driven by:
• Development and growing use of 3G/UMTS services (In September 2009, potential subscribers represented 36.8% of total mobile subscribers, indicating a 44.2% YoY growth).
• Emergence of new mobile broadband offers;
• Launching of specific offers related with the Information society (at the end of 2008 e-initiatives subscribers reached 534.285m);
• Appearance of new “by the second” billing tariff schemes; • Low cost offers (Uzo);
2
Anacom Data
3
PAGE 11/34
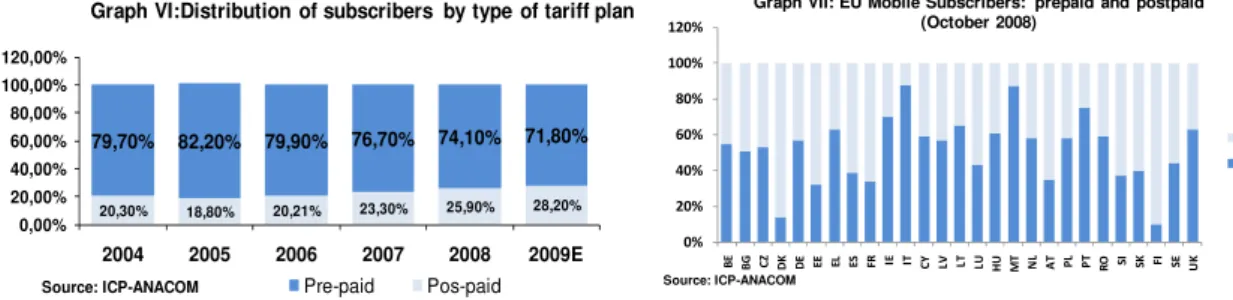
20,30% 18,80% 20,21% 23,30% 25,90% 28,20%
79,70% 82,20% 79,90% 76,70% 74,10% 71,80%
0,00% 20,00% 40,00% 60,00% 80,00% 100,00% 120,00%
2004 2005 2006 2007 2008 2009E
Graph VI:Distribution of subscribers by type of tariff plan
Pre-paid Pos-paid
Source: ICP-ANACOM
0% 20% 40% 60% 80% 100% 120%
BE BG CZ DK DE EE EL ES FR IE IT CY LV LT LU HU MT NL AT PL PT RO SI SK FI SE UK Graph VII: EU Mobile Subscribers: prepaid and postpaid
(October 2008)
Postpaid
Prepaid
Source: ICP-ANACOM
• Development of new applications associated with machines;
Customers are divided between pre-paid and post-paid subscribers. Pre-paid services without contract continue to show a fall tendency in the overall market, while we have been seeing a recent rise in the number of post-paid card users (27.4% 9M 2009 of the total subscribers and 31% in Optimus subscribers). This evolution reflects the rising use of UMTS based services. At the end of 3rd quarter 2009, the number of subscribers with access to UMTS services reached 5.7mn. This technology is related with wireless hardware for internet access which usually involves the payment of a monthly charge.
From the operator’s perspective, the increase in post-paid subscribers seems to be really attractive as it usually implies higher ARPU’s, around twice times more. Prepaid subscribers usually generate less revenue as they become more cognisant of what they spend which leads them to spend less. On the other hand, according to a study provided by the E.U. Commission, countries with a higher proportion of prepaid subscribers seem to present higher overall penetration rates. The proportion of prepaid subscribers in Portugal is one of the highest in Europe but has been following EU prepaid subscribers fall tendency (61% in 2007 to 58.2% in 2008).
According to
Anacom, the Portuguese Mobile Market is one of the markets with a higher level of penetration in Europe. At the end of 2nd quarter 2009 it reached 141.5% which is above the E.U average (122.4 per 100 inhabitants) and ranks Portugal as the fifth among the 27 countries in the E.U.The penetration in Portugal has been kept consistently above the average; this evolution in comparison with the EU can be explained because Portugal has a very competitive market, with many operators for just a few clients.
Table VI
Country P. Rate (Oct 2008) Inhabitants (2008) M. Opearators (2008) Subsc./ Operator Avrg. EBITDA m g (2008) Avg. ARPU (2007)
PT 136,96% 10m n 3 4.565.333 34,5% 23
FR 88,47% 65m n 3 19.168.500 32,30% 36
ES 114,27% 46m n 4 13.141.050 36,50% 26
UK 121% 61m n 5 14.762.000 23,90% 31
Italy 152% 58m n 4 22.040.000 45% 22
Source: Companies data and Nova Equity Research Team Portuguese high
PAGE 12/34
0 1.000.000 2.000.000 3.000.000 4.000.000 5.000.000 6.000.000 7.000.000
2007 2008 2009E
Graph VIII:Evolution of Mobile Broadband users
Active users
Users with access to mobile broadband Potential UMTS users
Source: ICP-ANACOM
0 0,5 1 1,5 2 2,5
Q3 07
Q4 07
Q1 08
Q2 08
Q3 08
Q4 08
Q1 09
Q2 09
Q3 09
Graph IX:Mobile versus Fixed Broadband subscribers (mn)
Mobile Broadband Fixed Broadband
Source: ICP-ANACOM This scenario leads operators to create new aggressive offers and promotions in order to appeal more to clients which is reflected in Portuguese telcos lower average ARPU.
Mobile penetration rate high values (Portuguese and E.U.) are not real values. The interpretation of these values must take into account:
• The existence of users who have more than one card (10% of the users); • Cards assigned to machines, equipments and cars;
• Cards used only to have access to data services and internet (Broadband).
Broadband
The number of users who have subscribed to mobile 3G services has grown significantly in Portugal. In accordance with data provided by Anacom, by the end of 3rd quarter 2009 there were 5.7mn users with access to UMTS/HSPDA technology-based services4 (potential users), representing 36.8% of total mobile subscribers.
Of the 5.7mn potential subscribers5, 2.3mn were active users6 (15.3% of total subscribers). This value represents a 32.9% QoQ growth and 123.6% growth in a YoY basis.
Commercial services associated with UMTS/3G are: Broadband internet access, Video call, and multimedia services and data transmission.
The number of mobile broadband users has been growing at a high pace. In the 3rd quarter of 2009 potential users represented 3.4million, 500 thousand more than in the 2nd quarter (+17% QoQ and 64% YoY growth). The number of users increased as well as the level of consumption. Among the potential users, 2 million were active users which represents a 95% YoY growth and a 36.7% QoQ growth. The proportion of active users in relation to potential users has been increasing since January 2007.
4
UMTS: Universal Mobile Telecommunication System. It is a technology design for high-speed data transfer and is”Internet Ready”.
5
Refers to those that already have equipment (mobile phone) ready to use services based on UMTS technology and have made at least one registration on the operator network.
6
Refers to those with adequate equipment but who have not yet registered the SIM.
At the end of 2008 potential users represented only 29% of total subscribers in
comparison with 36.8% in 3rd quarter 2009
PAGE 13/34
Table VII: Mobile Broadband offers Operator Speed Bandwidth Price Vodafone 1 Mb/s 2 GB € 24.9 Vodafone 512 Kb/s 1 Gb € 17.5 Optimus 3.6 Mb/s 6 Gb € 34.9 Optimus 1 Mb/s 2 Gb € 24.9 Optimus 512 Kb/s 1 Gb € 17.5 TMN 1 Mb/s 2 Gb € 24.9 TMN 512 Kb/s 1 Gb € 17.5
As we can see, the growth in mobile broadband has been very fast over the last year surpassing fixed broadband in 3rd Quarter 2009. Fixed Broadband growth rates were much softer than mobile, 3.1% on a QoQ basis and 13.2% on a YoY basis. We see this discrepancy in the evolution of both services as a risk for the fixed market. Although fixed broadband services can deliver high speed and capacity, more consumers are supporting their broadband service subscription on flexibility rather than on network performance. We believe as mobile broadband improves capacity and speed, it will have a stronger impact on the fixed broadband as it represents an easy way to connect everywhere; according to Anacom, mobile broadband is a substitute for fixed in specific market segments, such as young individuals, people who live alone and high status individuals. However, we believe it could also be a complement as we expect quadruple play offers to continue to grow in the market.
Mobile broadband evolution has been influenced by the evolution of new techniques, resulting from increase competition, as well as changes in the offers of this kind of service by service providers presenting daily tariff schemes to access internet on the mobile phone; it was also boosted by implementation of Government initiatives (e-initiatives).
The Governmental programme, e-initiatives, is an agreement between the Government and the three mobile operators within the scope of the signed commitment to the Information Society when UMTS Licences were granted requiring each operator to contribute with a subsidy. It was launched in June 2007 and aims to promote access to the information society, and promote e-inclusion through the generalization of access to personal computers and broadband internet on very competitive terms. This programme includes:
• E-oportunidades: available since 11 June 2007 to workers training under the
“Novas Oportunidades” program; assures the acquisition of laptops to access broadband.
• E-escolas: launched in September, 15, 2007; guarantees the acquisition of
broadband laptops for an initial payment of €150 (when applicable) and a monthly discount for a 3-year contract.
• E-professores: started September,15,2007; offers all teachers of basic and
secondary level a laptop for a down payment of €150 as well as broadband access for €5 less per month than normal offers, in a 3-year contract.
The three players with UMTS licences joined this project, through similar offers. According with Anacom in November 2008, 99% of accesses were made through a 512kb offer. Potential users could select one of the three 3G services providers. Although TMN is responsible for ¾ of the accesses, Vodafone and Optimus have been increasing their market share. Market shares are related to both Was originally addressed to
all 10th year students and it has been extended to a larger universe.
PAGE 14/34
52% 32%
16%
Graph X:Proportion of members on the initiative in November 2008
e-escola e-oportunidades e-professor Source: ICP-ANACOM 0% 10% 20% 30% 40% 50% 60% 70% 80% 90% 100% Ju l-07 Au g -0 7 Se p -0 7 O c t-0 7 No v -0 7 D e c-07 Ja n -08 Fe b -0 8 Mar -08 Ap r -0 8 May -08 Ju n -08 Ju l-08 Au g -0 8 Se p -0 8 O c t-0 8 No v -0 8
Graph XI: E-initiatives market shares
Optimus TMN Vodafone Source: ICP-ANACOM
Table VIII: Unlimited communications offers Vodafone TMN Offer Extreme/Extrav. Moche
Monthly Fee €9.91 €9.90
Source: Nova Equity Research Team
commitments made by each operator and to the distribution force; as TMN took higher commitments and in fact its distribution force is stronger it has a higher market share of the e-initiatives.
According to the most recent available data provided by Anacom, in November 2008 total subscribers reached 534,285.
Taking into account that when the programme was launched in 3rd quarter 2007, there were 0.5mn mobile broadband subscribers and at the end of 4th quarter 2008 (last available data of e-initiatives programme) there were 1.2mn broadband subscribers we can see that the mobile broadband growth was mostly driven by this programme contributing with 0.5mn to a total increase of 0.7mn.
Although Anacom has not yet provided data regarding the e-initiatives programme for 2009, we expect 2009 broadband growth to have been also supported by this programme though at a smaller rate; we expect this resource to start fading as the programme is already reaching maturity. Therefore, in the coming years we should not expect broadband to continue to be supported by e-initiatives.
Taking into account that under this agreement mobile operators receive a monthly payment between €5-€15 instead of normal prices between €17.5-€34.9 we perceive that although this programme has boosted mobile broadband customers and revenues, they receive less than with normal customers (difference between normal price and the price under the programme). Besides this, margins were positive and we must take into account that they have to accomplish the established commitment.
TAG:
In 2008, the mobile market experienced a new concept, the launching of specific offers allowing free calls, SMS, MMS, video-call and MSN between members of a particular network. Optimus was the first operator to launch this, a new attractive and innovative service based on unlimited communications aimed to target the
youth market. It was immediately followed by TMN and Vodafone.
• Optimus: TAG, is the only tariff where a fee is consumable. TAG members can choose between a variety of possibilities from € 5 for 15 days to a maximum
of
€ 60 for 180 days of free communications.Since the appearance of this concept, voice traffic has experienced strong growth rates, both in terms of number of calls and minutes (MOU).
According with Anacom and regarding the number of calls, in 9 Months 2009, outgoing traffic grew 6% in comparison with the previous quarter and 9.4% compared to the last year, driven mainly by the intra-network traffic accounting for 70% of the total. In the same period, the number of incoming calls grew 5.3% on a QoQ basis and 9% in comparison with the same period last year and intra-network traffic was responsible for 70.6% of the total.
PAGE 15/34 14
14 15 15 16 16 17 17 18 18
1Q 08 2Q08 3Q08 4Q08 1Q09 2Q09 3Q09
Graph XII: Optimus - ARPU
Source: company data
Table IX:European Mobile Termination rates (cent) Portugal Spain Sweden UK France 2Q 08 11,0 € 8,7 € 5,2 € 6,2 € 6,5 € 3Q 08 8,0 € 8,7 € 4,1 € 6,2 € 6,5 € 4Q 08 7,5 € 7,8 € 4,1 € 6,2 € 6,5 € 1Q 09 7,0 € 7,8 € 4,1 € 6,2 € 6,5 € 2Q 09 6,5 € 7,0 € 4,1 € 6,2 € 6,5 € 3Q 09 6,5 € 7,0 € 3,1 € 4,8 € 4,5 €
In 9 Months 2009, voice traffic in terms of minutes also registered a significant growth; the number of outgoing minutes was 7.5% higher on a QoQ basis and 14.8% superior compared to the same period last year which represents 8% more in comparison with the rise in subscribers. The number of minutes terminated in the mobile network grew 6.9% in comparison with the previous quarter and 14.5% on a YoY basis.
The launch of this service in 2008 helped to invert a negative trend in the traditional voice service. TAG allowed for the attraction of new subscribers who otherwise would not subscribe to mobile services. It helped to increase subscribers and therefore to slightly decrease network effect. Even though it contributed slightly increase Optimus subscribers, we must take into account that this service was immediately followed by Vodafone and TMN, which also increased the amount of subscribers increasing the benefit of network effect as they have a higher customer base. All in all, although Optimus benefited from this service, the benefit was even greater for TMN and Vodafone, which we believe increased the gap between Optimus and its two main competitors.
Analysing ARPU evolution since TAG launching, it is clearly visible that this service is ARPU unfriendly. TAG is not solely responsible for this effect, both downward pressure on MTR and stronger market competition are also contributing to this tendency.
Although this service is ARPU unfriendly and has been pressing revenues, it provides positive margins to Optimus. EBITDA margins are posting a positive evolution since 2nd quarter 2008 as intra-network costs, according to SNC management, are almost insignificant.
Regulation:
Anacom is in charge of the sector’s regulation. This is a key issue in the telecoms sector, with all market participants challenging high uncertainty. The regulation hot topics are: Mobile Termination Rates (MTR) and Roaming Cuts.
Mobile Termination Rates in most countries are converging to European levels. MTR’s started their decline path in Portugal in 2007. The Anacom decision came in line with the European Commission recommendation to eliminate the existing price distortion which means the reflection of the costs actually incurred in the wholesale termination.
Optimus was always affected by a scale problem, as having a smaller client base is negatively affected by the network effect being always a net payer to its competitors. When network effect exists, the value of a service increases as more people use it. Therefore, the more people who are Optimus subscribers, the more TAG was launched to
invert the negative trend in traditional voice service
European Commission set guidance to reduce MTR Outgoing/ Incoming
minute’s growth was driven by intra-traffic accounting respectively 74.3% and 74% for the total amount of minutes.
Net Payer: outgoing traffic is higher than incoming, paying more than receiving
PAGE 16/34
TMN Vodafone Optimus Asymmetry Before 11,0 € 11,0 € 11,0 € 0% 3Q 08 8,0 € 8,0 € 9,6 € 20% 4Q 08 7,5 € 7,5 € 9,0 € 20% 1Q 09 7,0 € 7,0 € 8,4 € 20% 2Q 09 6,5 € 6,5 € 7,8 € 20% 3Q 09 6,5 € 6,5 € 7,2 € 11% 4Q 09 6,5 € 6,5 € 6,5 € 0% 2010 € 6,0 € 6,0 € 6,0 0% 2011 € 5,4 € 5,4 € 5,4 0% 2012 € 4,9 € 4,9 € 4,9 0% 2013 € 4,4 € 4,4 € 4,4 0% 2014 € 4,1 € 4,1 € 4,1 0%
Source: Nova Equity Research Team
Table X: Mobile Termination Rate in PT (cents)
valuable it is to be Optimus subscribers; the problem is that Optimus did not reach critical mass and therefore is impaired by lack of scale.
For this reason, Anacom set a temporary asymmetry from August 2008 until last October justified by the existence of a network effect penalising Optimus. This exception is a common practice in other countries in the E.U. but was applied in Portugal for the first time.
Whether asymmetry will persist in the future remains uncertain. In our opinion, MTR rates asymmetry that decreased the negative impact of the network effect over Optimus during 2009 is not expected to continue in the future. Optimus performance during 2009 demonstrated the positive impact of asymmetry on its business, being the operator in every quarter with greater improvements in operational margin.
As MTR rates decrease, the network effect also decreases and by the end of 2009 Anacom expects that the network effect will already have been partial reduced. Thus, even without asymmetry, Sonaecom will enjoy some relief from MTR cuts in the next years.
In any case, the main doubt relates to the future glide path of MTR. Players are waiting for new indications from the Portuguese Regulator but we believe these indications should come in line with the aggressive strategy recommended by the E.U. and followed by some countries whose purpose is to decrease MTR to 0.015€ - 0.030€ by 2012.
The uncertainty rests in the amount of time needed to go from the present 0.065€ in Portugal to 0.030€ recommended by the EU.
Although MTR cuts are a national matter and should be decided by national authority, Roaming as an international subject has a different approach. At the end of 2008, the European Commission announced new proposals for Roaming rules, stating that operators should cut prices of electronic communications within the E.U to prices similar to local rates; maximum chargeable prices were established and started to be applied in July 2009 (SMS: from 25p to 10p; outgoing voice calls from 40p to 38p; incoming voice call from 19p to 17p).
Regarding the negative effect of this measure on revenues and assuming that roaming in revenues are equally distributed between the three operators, the proportional impact, as a percentage of revenues, is higher in the case of Optimus. In 9 months 2009, roaming revenues suffered a 20% decline; since this line only represents less than 5% on total services revenues the overall impact on total revenues was less than 1%.
Both MTR and roaming cuts have been pressing Optimus operator revenues that have been falling since 3rd quarter 2008 from €39.2mn to €28.8 in 3rd quarter 2009.
PAGE 17/34
Estimates
Looking into Optimus performance in recent years we observe that it have been following a strategy focused on growth instead of profitability; we believe Optimus shifted its strategy during the present year to a strategy of more profitability to the detriment of growth. Our assumption is supported by the management’s commitment to delivering positive FCF in the coming years.
After presenting the main market trends, we verify that the future of the wireless market is supported not so much by voice, which will become a common service, but by mobile broadband. Revenue growth among wireless providers is slowing due to already-high penetration rates in Portugal and also due to MTR cuts weakening mobile service revenues; for the next years, we expect mobile broadband to be the driver for mobile market growth; if we compare Portuguese penetration in 2008 (12.1%) with countries such as Spain, Austria or even with the European average (13%) we perceive an opportunity for growth as our penetration rate for mobile broadband is still much above the others. Today’s Optimus weight of data service is 28.1% and we expect it to achieve 40% in 2019. We could expect MTR cuts to continue to have an impact on both operator revenues and interconnection costs.
REVENUES
We incorporate in our expectations the slowdown in the penetration rate growth;
considering a 2% CAGR (2010-2012) and from then on declining until a
residual 0.5% annual growth value in 2019. Our base case does not expect significant changes in wireless market shares; we assume Optimus will be able to maintain a stable market share (around 20%) through the next years. Our assumption is supported by the following evidence: first of all Optimus has been able to maintain its market share in recent years even facing a challenging environment (natural market share); we also took into account Zon Mobile (Mobile Voice and Internet services), and as previously mentioned, we believe that the potential inroad into the mobile sector is low since is only a complement for Zon and not part of a strategy as there is not space for an additional operator (ONI case).
Top line performance depends on the number of subscribers and on the average revenue per user (ARPU); ARPU can be divided into Customer (Monthly Bill) and Interconnection ARPU (Interconnection Bill).
Concerning Customer Revenuer, our forecasts for the current year 2009 and for 2010 consider the maintenance of moderate growth rate due to the present trend of low ARPU, forecasting a decrease of 10% in 2009 and 2% in 2010. We expect Available capacity in
bb will be a key success factor for the industry
Optimus will be able to maintain a stable market share
High level of Mobile Service penetration proves that there is not much capacity to grow.
Graph XIII: European BBpenetration rate
PAGE 18/34
39% 38% 37% 32% 28% 27% 26% 61% 62% 63% 68% 72% 73% 74%
0% 20% 40% 60% 80% 100% 120%
Q1 08 Q2 08 Q3 08 Q4 08 Q1 09 Q2 09 Q3 09
Graph XV: Optimus SMS/ Non-SMS
Non-SMS
SMS
Source: Company data 20,60% 20,90% 22,70% 25,70% 27,40% 27,60% 28,10% 0,00% 5,00% 10,00% 15,00% 20,00% 25,00% 30,00%
Q1 08 Q2 08 Q3 08 Q4 08 Q1 09 Q2 09 Q3 09
Graph XIV: Optimus % data of service revenue
Source:Company data
81,7% 77,8% 73,1% 69,9% 68,0%
18,3% 22,2% 26,9% 30,1% 32,0%
0,0% 20,0% 40,0% 60,0% 80,0% 100,0% 120,0%
2005 2006 2007 2008 2009E
Graph XVI: Optimus % Pre-paid/Pos-paid cards
Pos-paid
Pre-paid
Source: Company data
that the next bunch of subscribers will primarily be low income, increasing TAG users which mean lower ARPU (€5) and therefore lower revenues.
We forecast an inversion of the current trend from 2011 onwards, which would be driven by the private consumption recovery and higher importance of data services from total revenues which already accounts for 28.1% versus 22.7% in 9M 2008.
Optimus BB users have been increasing at a very fast rate, driven by Kanguru and e-escolas programme; both drivers are already reaching a mature phase. From 2011 onward we expect broadband to be driven mainly by Smartphone use; according to a study provided by pyramid research, Smartphone’s market is in expansion and Smartphone’s sales will continue to grow in Europe about 22% YoY. It is expected to capture 37% of the total world phone market in 2014 compared with the current 16% of total market. Navigation, email and internet access are top of the necessary features for new mobile phones and, therefore, that which was previously mostly for business use is becoming conventional. As adoption of Smartphones expands, more customers are likely to take contract plans that include some form of data services.
We do not expect BB prices to increase; we rather expect the mix of ARPU to change. Pure broadband ARPU (€22) is higher than voice ARPU (€13); we believe consumer use of broadband and especially Smartphones will increase. Therefore, the proportion of users with higher ARPU will increase, leading to a rise in the total average ARPU.
This tendency is also reflected in the increasing number of post-paid cards which usually imply a higher ARPU.
Operator Revenues (Interconnection Bill) are under pressure, being affected by both MTR and Roaming cuts. Favourable asymmetry on MTR to Optimus finished at the end of 3rd quarter and now tariffs are at the same level (€ 0,065) for all operators. Moreover, we believe Anacom will determine further reduction on MTR from 2010 until 2014 (€ 0.04). We expect the downward glide in Roaming tariffs that took effect in July 2009 to continue but at a lower level.
We anticipate MTR and roaming pressure to continue penalizing interconnection revenues until 2014, which is when we expect MTR to stabilize. From 2014 onwards we anticipate that operator revenues will become stable.
We could expect BB penetration to grow leading to higher ARPU
Smartphones will become more popular increasing the number of subscribers using mobile phone to access the internet
PAGE 19/34
Table: XII Mobile operators margin
EBITDA mg 3Q 08 3Q 09 YoY % Optimus 26,30% 27,50% 1,2 pp
Vodafone 32,90% 32% (-)0,9 pp
TMN 43,80% 44,70% 0,9 pp
Source: Companies data and Nova
Equity Research Team
Table XI:Optimus operating data
2007 2008 2009E 2010E 2011E 2012E 2013E 2014E 2019E CAGR 08-14E
CAGR 14-19E Market Penetration 131,5% 144,2% 149,5% 151,7% 154,0% 156,3% 157,9% 158,7% 162,0% - -Optimus Market Share 20,7% 20,8% 20,6% 20,3% 20,0% 20,0% 20,0% 20,0% 20,0% - -Optimus Subscribers 2.893.500 3.191.600 3.275.549 3.279.213 3.282.164 3.334.395 3.370.770 3.390.673 3.478.065 2,3% 0,5% ARPU 18,2 € 16,8 € 15,0 € 14,7 € 14,9 € 15,2 € 15,5 € 15,7 € 17,2 € -1,0% 1,8% Source: Com pany data and Nova Equity Reseacrh Team
EBITDA
Although revenues are under pressure, EBITDA margin is improving. Nine months results confirmed a Robust EBITDA generation; these profitability gains were possible as a combined effect of cost savings and favourable asymmetry towards Optimus. Cost savings were mainly network and interconnection costs related with MTR cuts and with the 2008 upgrade of their 3G and fixed infrastructures which allowed backhaul costs to be reduced. We expect these cost reductions to be sustainable in the coming years as they are structural cost savings.
The rationale behind this analysis is the fact that although MTR cuts negatively affect Revenues, the positive effect in costs is even greater resulting from
the reduction in interconnection fees paid to operators, allowing increasing
EBITDA margin.
According to data provided by SNC management, an additional cut of €0.0025 would be an upside in terms of profitability of €4mn.
All in all, we expect profitability margins to remain strong in the given period (2011-2019) as the company has proven its ability to increase margins in its business through operational cost reduction and also helped by MTR cuts. As we can see by looking at both Optimus and the competitors’ margins, Optimus was the operator benefiting more from MTR cuts since last year which we expect to continue with further MTR cuts.
CAPEX
Regarding Capex, Optimus efforts to improve 3G/3.5G coverage and network capacity in 2008 should allow it to lower its investments from 2009 onwards. SNC lowered its capex level in the current year and announced it is planning to slightly decrease its investments due to recent updates. We are more conservative with regard to this issue. We do not believe that is possible to cut capex much further as, even though it is the smaller operator, SNC has to have the same infrastructures as big players. Therefore we expect capex for the next years to be in line with the previous year’s level. This discrepancy between capex level and turnover in comparison with main competitors has huge negative impact on SNC Cash Flow. We expect Optimus Capex Revenues to be 15% until 2013 and after that we would expect marginal decrease until reaching 13% of revenues in 2019 which is in line with the previous year’s capex level.
PAGE 20/34 Table XI c:Sensitivity Analysis
Market Share -1% 0% 1%
Price Target 2,08 2,2 2,32
Arpu growth rate -2% 2% 2%
Price Target 1,96 2,2 2,47
EBITDA mg -2% 0% 2%
1,71 2,2 2,68
Source: Nova Equity Research Team
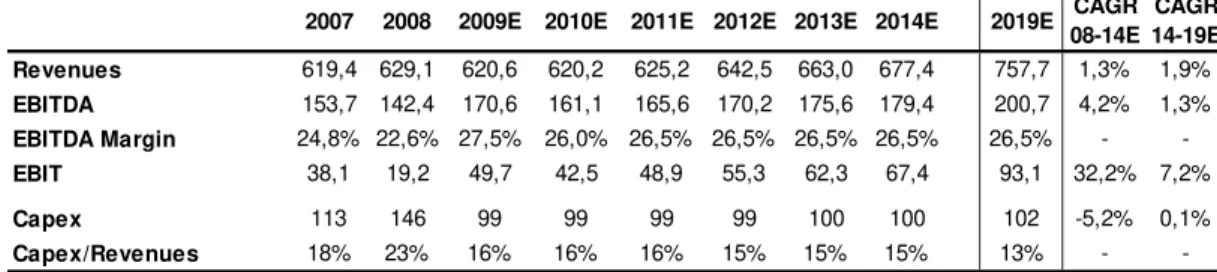
Table XI:Optimus Income Statement
2007 2008 2009E 2010E 2011E 2012E 2013E 2014E 2019E CAGR 08-14E
CAGR 14-19E Revenues 619,4 629,1 620,6 620,2 625,2 642,5 663,0 677,4 757,7 1,3% 1,9%
EBITDA 153,7 142,4 170,6 161,1 165,6 170,2 175,6 179,4 200,7 4,2% 1,3%
EBITDA Margin 24,8% 22,6% 27,5% 26,0% 26,5% 26,5% 26,5% 26,5% 26,5% -
-EBIT 38,1 19,2 49,7 42,5 48,9 55,3 62,3 67,4 93,1 32,2% 7,2%
Capex 113 146 99 99 99 99 100 100 102 -5,2% 0,1%
Capex/Revenues 18% 23% 16% 16% 16% 15% 15% 15% 13% -
-Source: Com pany data and Nova Equity Research Team
2009E 2010E 2011E 2012E 2013E 2014E 2019E
EBIT x (1-t) 36,5 31,2 36,0 40,6 45,8 49,6 68,5
Depreciation (+) 120,9 118,6 116,6 114,9 113,3 112,0 107,5
Capex (-) -99 -99 -99 -99 -100 -100 -102
Change in Ner Working Capital -20,5 1,5 -0,9 -2,0 -2,4 -2,1 -1,8
DCF 37,7 52,3 52,7 54,1 57,1 59,3 72,5
Source: Nova Equity Research Team Table XI b : Optimus DCF
Sensitivity Analysis
Given the huge importance of Optimus for Sonaecom, as well as the challenging prospects that this unit is facing in terms of competition and regulatory environment we ran a sensitivity analysis of Sonaecom’s valuation to different levels of critical variables to assess the potential impact on our price target. The variables that we have influenced in Optimus in order to make a sensitivity analysis are: Arpu growth rate, market share and EBITDA margin.
Deviations of these variables from base case reflect: regulatory environment alterations, macroeconomic environment uncertainty and competitive intensity. As we can observe, our price target is most vulnerable to variations of EBITDA margins; EBITDA mg would have to be 2% lower in each year of the 10 years valuation to jeopardize our 2010 price target, which we do not consider reasonable taking into account recent improvements in terms of operational savings.
Wireline Business – Sonaecom Fixed
Sonaecom’s opportunity to join the Fixed Market came with the liberalization of the Portuguese telcos market in January 2000. Before that, Portugal Telecom was the only operator and, therefore, it was a monopoly market. The fixed unit offers services to three segments: residential, corporate and SMES and wholesale.
Sector Overview
PAGE 21/34 Graph XII:Adhesions to multiple-play offers (th.)
2007 2008 YoY CAGR (06-08)
Total 565 744 31,70% 26,50%
Double 385 391 1,50% 7,80%
Triple 179 343 91,30% 63,70%
Quadruple 0 9 -
-Source: Anacom
Graph XIII:Penetration rate per 100 houses
2007 2008 YoY CAGR (06-08)
Total 10,1 13,3 3,20% 2,50%
Double 6,9 7 0,10% 0,50%
Triple 3,2 6,1 2,90% 1,90%
Quadruple 0 0,2 0,2 0,1
Source: Anacom
change in the consumer behaviour to bundle offers. Regarding voice, we detect an inflexible tendency for decline in the number of clients.
We believe the only drivers for the Fixed Business Growth are Pay TV and Broadband (integrated in a bundle offer). This fact is also supported by the E.U penetration ratio of each of these segments, which are substantially higher than in Portugal, meaning that we still have scope for market growth (15.4% in Portugal versus 22.9% E.U in 2008 for Fixed Broadband7). In this segment, the main players are: PT, ZON, Sonaecom and also Cabovisão in the pay-tv market. Zon has a complete triple and quadruple-play offer with a strong subscriber base and an established position in their core market. It is now the leader in the Pay-tv market and is gaining market share in Broadband. PT continues to aggressively expand its presence in pay-TV and is rolling out fibre. PT fibre investment seeks to improve capacity limit, bandwidth and geographic cover, given that they believe market needs have changed and are now more demanding. Thus, there is a need to provide added value providing additional reliability, faster internet services, high definition TV and advanced communication along with entertainment services. In the first half of 2009 PT announced it had surpassed 500,000 houses and was now aiming to reach 1 million houses by the end of 2009. Regarding Sonaecom and its fibre investment, the company fixed a target to surpass 200,000 in 2009, which has already been accomplished and which represents around 7000 subscribers; a partnership with DST was also announced and a joint-venture with Vodafone to explore alternative solutions for expanding fibre offers to other regions as a way of sharing investment risk.
Portuguese landlines reached 4.198M accesses in 3rd quarter. This value represents a 1.5% YoY and 1% QoQ growth. According to data provided by the Portuguese regulator, landline marginal growth was mainly supported by new subscribers of multiple play offers; these are integrated offers comprising combinations of: voice, internet and pay-tv; as in Portugal we have been observing a growth pay-tv adherence it has been contributing to also increase multiple play penetration (13/100 houses in 2008). In terms of population, penetration reaches 6.9/100 inhabitants which means it is above the E.U. average (10/100).
Despite this marginal growth, we must refer to the inverse evolution tendency of direct accesses vs. indirect.
Whereas direct accesses customers slightly increased, boosted by package offers, we could verify that indirect accesses customers suffered a severe drop
7
[2]
Relatório Anacom 2008PAGE 22/34 0
1000000 2000000 3000000
2007 2008 2009E
Graph XVII: Portuguese pay-Tv subscribers
Portuguese pay‐Tv …
Source: ICP-ANACOM
Table XIV: Wireline Customers
3Q08 2Q09 3Q09 YOY%
Direct Access 3.141 3.252 3.285 4,60%
Indirect Access 342 291 276 -19,30%
Pre-selection 195 161 151 -22,40%
Call-to-call 25 6 7 -74,70%
VOIP 122 124 118 -2,80%
Source: Anacom
Table XV:Pay-tv subscribers market share
Zon PT Cabovisão SNC Others
66,60% 20,70% 10,60% 0,90% 1,20%
Source: Anacom
which started in the 2º half of 2006. We expect this tendency to continue as new operators are focused on other segments which are more attractive in terms of profitability and also due to a new competitive tariff of the incumbent operator.
Voice
Regarding voice traffic we have seen a quarter after quarter fall tendency (-3.4% fall in terms of minutes and -3.9% fall in terms of number of calls on a QoQ basis). This evolution is explained by the reduction in fixed-mobile traffic and also by the substitution of dial-up accesses by broadband ones.
Pay-Tv
Pay-tv subscribers continue to growth and, according to data provided by Anacom, reached 2.4m in 3rd quarter 2009. This represents an annual and quarter growth of 11% and 3% respectively.
This service could be supported by different technologies; cable continues to be the main technology, followed by DTH and IPTV. Sonaecom offers its Pay-Tv service on the back of Xdsl/IP technology (IPTV) and also through fibre. Zon is the main player in this segment (66.6% market share). Besides Zon there are two operators with significant market shares: PT and Cabovisão. Recently Vodafone launched its offer of Pay-tv supported through Xdsl/IP.
We believe this segment has a lot of space to grow if we consider current penetration of 44/100 houses in comparison with other E.U. countries such as the Netherlands that already has a penetration ratio near to 100%; we verify that the Portuguese pay-tv market is far from being saturated. Moreover, according to a survey by Anacom, high price is the main barrier for subscribers of this service. Therefore, as prices are decreasing, more subscribers will join.
As we can see, Sonaecom has a very irrelevant position in this segment (1%),
which we do not expect to change as a consequence of its weak pay-tv offer. SNC immaterial position in this segment is a consequence, firstly, of a low market addressable base of only around 1.5mn line, in comparison with ZON which has an addressable base of 3.5mn; commercial efforts are substantially lower than its competitors and people are much more aware of MEO and ZON offer; SNC offer is mainly supported through Xdsl/IP technology which does not provide a high quality service due to its limited HD capacity. This technology also does not allow for provision of this service for more than one TV. Moreover, according to a survey by Anacom, operator choice by subscribers is made in accordance with two main factors: best contents and lower prices; for both, Zon and PT are respectively the players in a better position to attract new subscribers.
PAGE 23/34
0 5 10 15 20 25 30 35 40
BG PL RO SK EL HU LV PT CZ LT IT ES CY IE AT SI
EU2
7
MT EE BE UK FR DE FI LU SE NL DK Graph XVIII: Fixed Broadband
penetration rate in UE27 - 2Q 09
Source: ICP-ANACOM
Table XVI:Fixed broadband subs. (mn) 2Q 09 3Q 09 % QoQ % YoY
1.752 1.806 3.1% 13.2%
Source: ICP-ANACOM
Table XVII
Fixed broadband Market Share Evolution
3Q 08 41 08 1Q 09 2Q 09 3Q 09
ZON 35.3% 37.2% 44% 44.7% 45%
PT 34.2% 36.2% 33% 32.8% 31.7%
SNC 14.4% 11.8% 11% 11.1% 10%
Cabov9.9% 7.9% 5.8% 5.2% 7.1%
Source: ICP-ANACOM
Although we believe this is going to be the main driver for this segment we do not expect SNC to take advantage of this opportunity as it has only 1% of
market share and does not have a competitive offer.
Fixed Broad Band
Fixed Broadband reached 1.8mn subscribers in 3rd quarter 2009. This figure has been increasing but SNC’s position has been deteriorating and has not been following this evolution, losing not only market share but absolute numbers of subscribers.
We believe this is a driver for fixed segment growth in the coming years, offering high growth potential; at the end of 3rd quarter 2009 fixed broadband penetration in Portugal was 17/100 inhabitants (+0.5% QoQ and 2% YoY), which means it is below the EU average (23.8% versus Portugal 17.6% in July 2009) and also much below top countries such as Denmark (37.2). Most European countries, including France (29.1%) and the UK (29.8%), have already achieved higher levels of penetration rates, which leads us to assume this is a service in expansion in Portugal which we expect to boost revenues in the fixed segment in coming years. Even if we perceive a growth potential of this service, we do not expect SNC to follow this evolution. Rather, we expect further losses in market shares in the coming years.
According to a survey provided by Anacom, the choice of BB provider is connected with low price offers and if the client already has another service from the same operator. In both cases, Sonaecom has a weak position as it has a fragile bundle offer and it is impossible to attract new clients based on other provided services. Moreover, SNC management has already stated that it does not wish to enter the war prices that have been happening between ZON and PT; instead, the company will focus on providing additional services for the existing subscribers and not focus on attracting new customers.
Fibre Plan
Sonaecom announced its fibre roll out plan in February 2008. This strong investment came as a result of the recognition that the LLU model remains fragile compared with Zon’s competitive cable infrastructure and strong market position and with the possibility of PT starting to invest in NGN’s, which actually happened. SNC Management rationale behind fibre plan:
PAGE 24/34
Table XVIII: SNC Wireline Business
3Q08 2Q09 3Q09 YoY% QoQ%
Dir.Accesses 476 432 426 -10% -2%
Ind. Accesses 168 95 87 -48% -9%
Total 644 528 513 -20% -3%
Source: Company data and Nova Equity Research
• Increase customer loyalty providing unlimited bandwidths and a wide range of applications and functionalities (enhancing its bundle offer);
• Lower Operational Cost (leased lines and other network costs);and, • Increase 3-Play subscribers as could provide much better contents.
Our model considers a mix between LLU and fibre as we perceived that even if SNC increases its level of subscribers’ penetration to homes passed, there will always be direct clients connected through LLU.
Under fibre offer, SNC will provide services with HD and it will be possible to have pay-tv in more than one division at the customer’s house. Taking into account the limitations in terms of addressable market, low commercial activity and the fact that SNC is only following competitors’ offers, fibre upside potential is limited to LLU transfers to fibre and to an up selling opportunity of double-play customers who have not yet subscribed to pay-tv due to low definition quality or because of the weak signal.
Estimates
The Market Share in the Fixed Business is declining as a result of the tough competitive environment as the two main competitors, ZON and PT, are cutting their prices aggressively (PT-Tv, Zon-Fixed Voice and Vodafone- Fixed Broadband) and, as was stated in the 3Q Sonaecom Conference Call, Sonaecom does not want to replicate this “Market Destruction” in order to capture new clients.
REVENUES
Sonaecom has been losing accesses in the last quarters, as a result of the fixed market deterioration and due to a lack of a competitive triple-play offer. We expect previous trends in terms of declining net adds to continue but at a lower rate; we are going to continue observing this ongoing fixed line loss and we should not expect the competitive environment to recede.
Concerning direct losses, Wholesale and Corporate SMES are contributing to attenuate the decline of net adds. Residential segment (1/3 of this segment) is having the worst performance.
Moreover, revenues are immediately benefiting from transferring LLU clients to fibre in the residential segment. Although we expect these improvements to continue, we expect it at a moderate and limited rate as fibre investment pace has been slowing down.
Regarding indirect assesses, we believe this is an irreversible trend and we expect it to continue to fall until 2019 at an average annual rate of 10%.
SNC does not want do capture clients “at any price”
Residential Market is now a duopoly (Zon and PT)