ACPD
13, 8233–8260, 2013Fire smoke impacts
M. Val Martin et al.
Title Page
Abstract Introduction
Conclusions References
Tables Figures
◭ ◮
◭ ◮
Back Close
Full Screen / Esc
Printer-friendly Version Interactive Discussion
Discussion
P
a
per
|
Dis
cussion
P
a
per
|
Discussion
P
a
per
|
Discussio
n
P
a
per
|
Atmos. Chem. Phys. Discuss., 13, 8233–8260, 2013 www.atmos-chem-phys-discuss.net/13/8233/2013/ doi:10.5194/acpd-13-8233-2013
© Author(s) 2013. CC Attribution 3.0 License.
Atmospheric Chemistry and Physics
Open Access
Discussions
Geoscientiic Geoscientiic
Geoscientiic Geoscientiic
This discussion paper is/has been under review for the journal Atmospheric Chemistry and Physics (ACP). Please refer to the corresponding final paper in ACP if available.
A decadal satellite analysis of the origins
and impacts of smoke in Colorado
M. Val Martin1, C. L. Heald2, B. Ford1, A. J. Prenni1, and C. Wiedinmyer3
1
Atmospheric Science Department, Colorado State University, Fort Collins, CO, USA
2
Department of Civil and Environmental Engineering & Department of Earth, Atmospheric, and Planetary Sciences, Massachusetts Institute of Technology, Cambridge, MA, USA
3
National Center for Atmospheric Research, Boulder, CO, USA
Received: 22 February 2013 – Accepted: 13 March 2013 – Published: 26 March 2013 Correspondence to: M. Val Martin (mval@atmos.colostate.edu)
ACPD
13, 8233–8260, 2013Fire smoke impacts
M. Val Martin et al.
Title Page
Abstract Introduction
Conclusions References
Tables Figures
◭ ◮
◭ ◮
Back Close
Full Screen / Esc
Printer-friendly Version Interactive Discussion
Discussion
P
a
per
|
Dis
cussion
P
a
per
|
Discussion
P
a
per
|
Discussio
n
P
a
per
|
Abstract
We analyze the record of aerosol optical depth (AOD) measured by the MODerate res-olution Imaging Spectroradiometer (MODIS) aboard the Terra satellite in combination with surface PM2.5to investigate the impact of fires on aerosol loading and air quality over Colorado from 2000 to 2012, and to evaluate the contribution of local versus trans-5
ported smoke. Fire smoke contributed significantly to the AOD levels observed over Colorado. During the worst fire seasons of 2002 and 2012, average MODIS AOD over the Colorado Front Range corridor were 20–50 % larger than the other 11 yr studied. Surface PM2.5was also unusually elevated during fire events and concentrations were
in many occasions above the daily National Ambient Air Quality Standard (35 µg m−3)
10
and even reached locally unhealthy levels (>100 µg m−3) over populated areas during
the 2012 High Park fire and the 2002 Hayman fire. Over the 13 yr examined, long-range transport of smoke from northwestern US and even California (>1500 km distance) oc-curred often and affected AOD and surface PM2.5. During most of the transport events,
MODIS AOD and surface PM2.5 were reasonable correlated (r 2
=0.2–0.9), indicating 15
that smoke subsided into the Colorado boundary layer and reached surface levels. However, that is not always the case since at least one event of AOD enhancement was disconnected from the surface (r2<0.01 and low PM2.5 levels). Observed plume heights from the Multi-angle Imaging SpectroRadiometer (MISR) satellite instrument and vertical aerosol profiles measured by the space-based Cloud-Aerosol LIdar with 20
Orthogonal Polarization (CALIOP) showed a complex vertical distribution of smoke emitted by the High Park fire in 2012. Smoke was detected from a range of 1.5 to 7.5 km altitude at the fire origin and from ground levels to 12.3 km altitude far away from the source. The variability of smoke altitude as well as the local meteorology were key in determining the aerosol loading and air quality over the Colorado Front Range 25
ACPD
13, 8233–8260, 2013Fire smoke impacts
M. Val Martin et al.
Title Page
Abstract Introduction
Conclusions References
Tables Figures
◭ ◮
◭ ◮
Back Close
Full Screen / Esc
Printer-friendly Version Interactive Discussion
Discussion
P
a
per
|
Dis
cussion
P
a
per
|
Discussion
P
a
per
|
Discussio
n
P
a
per
|
1 Introduction
Millions of hectares of forest burn over North America every year (van der Werf et al., 2010), releasing large amount of gases and aerosols that affect human health, impair visibility and can impact climate. Fire smoke exposure is associated with increased hospital admissions, bronchitis, asthma and chest pain (e.g. Vedal and Dutton, 2006; 5
Naeher et al., 2007; Kochi et al., 2012). Climate change is most likely responsible for the observed increased trend in fire activity over western US (Westerling et al., 2006), which may result in a near doubling of carbonaceous aerosol, and a significant increase in annual mean PM2.5and haze by 2050 (Spracklen et al., 2009).
Smoke plumes generated by fires can be confined within the boundary layer (BL) or 10
injected into the free troposphere (FT) (Val Martin et al., 2010). Smoke within the BL typically is well mixed and remains near the source region (e.g. Trentmann et al., 2002), whereas smoke lofted into the FT is often transported thousands of kilometers mixing down to the surface and potentially affecting air quality over regions far downwind. (e.g. Val Martin et al., 2006; Duck et al., 2007). Thus, the altitude of the smoke is key 15
to determining the air quality impacts of smoke and understanding the link to human health.
In the last decade, satellite observations of total column aerosol optical depth (AOD) have provided an important tool to estimate PM2.5levels at the ground (e.g. Engel-Cox et al., 2004), with the objective of developing smoke air quality advisories (Al-Saadi 20
et al., 2005) and establishing links to human health (Evans et al., 2013). Studies have used fixed statistical relationships between AOD and surface PM2.5 as well as more sophisticated approaches that take into account meteorology and surface information and chemical transport model simulations (Hoffand Christopher, 2009, and references therein). However, the use of vertical AOD column observations to provide an accurate 25
ACPD
13, 8233–8260, 2013Fire smoke impacts
M. Val Martin et al.
Title Page
Abstract Introduction
Conclusions References
Tables Figures
◭ ◮
◭ ◮
Back Close
Full Screen / Esc
Printer-friendly Version Interactive Discussion
Discussion
P
a
per
|
Dis
cussion
P
a
per
|
Discussion
P
a
per
|
Discussio
n
P
a
per
|
Colorado experienced one of its worst fire seasons in 2012. A series of devastating fires burned from May to July due to an extraordinarily dry winter and extreme hot summer temperatures across the state. Table 1 summarizes the main 2012 Colorado fires. Smoke generated during large fires such as the High Park fire in Fort Collins and the Waldo Canyon fire in Colorado Springs blanketed almost the entire state for weeks 5
at a time (CBSNews, 2012). Smoke plumes from wildfires in the northwestern US also impacted Colorado in 2012 (Mitchell, 2012). Previous to 2012, the fire event associated with the most extreme air quality degradation in Colorado was the June 2002 Hayman fire, which engulfed the city of Denver with smoke for days (Vedal and Dutton, 2006).
The objective of this work is to observationally assess the impact of fires on aerosol 10
loading and air quality over Colorado over the last decade, and to evaluate the degree to which local and transported smoke contribute to this impact. For this purpose, we use multiple satellite observations from the MODerate resolution Imaging Spectrora-diometer (MODIS) and the Cloud-Aerosol LIdar with Orthogonal Polarization (CALIOP) in combination with surface PM2.5(particulate matter less than 2.5 µm) measurements.
15
We also retrieve smoke plume heights from the High Park fire using Multi-angle Imag-ing SpectroRadiometer (MISR) observations and CALIOP aerosol vertical profiles to investigate the importance of smoke vertical distribution on air quality near and far away from the fire source.
2 Data and methods
20
In this study, we make use of a suite of satellite observations from MODIS, CALIOP and MISR in combination to daily area burned extracted from the NCAR Fire INventory (FINN) Model (Wiedinmyer et al., 2011) and surface PM2.5 measurements collected by the Colorado Department of Public Health and Environment (CDPHE) network and Colorado State University (CSU).
ACPD
13, 8233–8260, 2013Fire smoke impacts
M. Val Martin et al.
Title Page
Abstract Introduction
Conclusions References
Tables Figures
◭ ◮
◭ ◮
Back Close
Full Screen / Esc
Printer-friendly Version Interactive Discussion
Discussion
P
a
per
|
Dis
cussion
P
a
per
|
Discussion
P
a
per
|
Discussio
n
P
a
per
|
2.1 Satellite observations
To study the impact of smoke over Colorado, we combine satellite observations from MODIS, CALIOP and MISR. For this work, we use data from the MODIS instrument aboard the NASA Terra Satellite from 2000 to 2012. Specifically, we use daily AOD data from Collection 5.1, Level 3 with a 1◦
×1◦horizontal resolution. We use land optical
5
depth retrievals and filter the MODIS data to include only grid boxes with cloud fractions below 0.8 and aerosol optical depths less than 1.5, following Zhang and Reid (2006). Our results do not change if we use all the data from the standard MODIS AOD product. For example, monthly average AOD over Colorado in June 2012 is 0.2 and 0.23 from the standard and filtered data, respectively. We use the filtered AOD data as they agree 10
best with other satellite observations and surface measurements (e.g. Ford and Heald, 2012).
The MODIS sensor has middle- and long-wave infrared bands designed specifically to observe actively burning fires (Kaufman et al., 1998; Giglio et al., 2003). We use fire pixels from MODIS (Level 2, Collection 5) to identify potential active fire locations in 15
2002 and 2012. Each active fire location represents the center of a 1 km pixel that is flagged by the algorithm as containing a fire within the pixel (Giglio et al., 2003).
CALIOP is aboard the CALIPSO satellite which was launched in 2006. CALIOP measures the backscatter intensity and the orthogonally polarized components of the backscatter signal at two wavelengths, 532 and 1064 nm. We use Level 2, version 20
3.01 data from 2007 to 2012. Details of the data processing algorithms are given by Winker et al. (2009). CALIOP also provides an aerosol type classification (i.e. clean marine, clean-continental, dust, polluted-dust and smoke) based on an algorithm that uses properties of depolarization ratio, surface type, integrated backscatter, altitude and color ratio (Omar et al., 2009). The aerosol type classification can be used to sug-25
ACPD
13, 8233–8260, 2013Fire smoke impacts
M. Val Martin et al.
Title Page
Abstract Introduction
Conclusions References
Tables Figures
◭ ◮
◭ ◮
Back Close
Full Screen / Esc
Printer-friendly Version Interactive Discussion
Discussion
P
a
per
|
Dis
cussion
P
a
per
|
Discussion
P
a
per
|
Discussio
n
P
a
per
|
volume descriptors, extinction quality control flags and total column optical depths. We assume that all extinction observations with a corresponding atmospheric volume de-scriptor that indicates clear air have zero aerosol extinction, rather than the fill value of
−9999. Additional information on the filtering and sampling methods can be found in
Ford and Heald (2012). 5
The MISR instrument also is aboard the Terra satellite (Diner et al., 1998). MISR acquires multi-angle radiance imagery from a set of nine push-broom cameras, from
−70◦ to+70◦viewing angles, in-line with the ground track of the satellite. The width of
the MISR swath common to all 9 cameras is about 380 km, enabling global coverage every 9 days at the equator and every 4–6 days over the lower 48 states. MISR’s 10
multiple viewing angles allow the retrieval of cloud, smoke plume, and other aerosol layer heights above the terrain, as well as motion vectors, using stereoscopic methods, with a typical vertical resolution of 500 m or better, and a horizontal resolution of 1.1 km, provided the cloud or aerosol contains features that can be identified in the multiple views (e.g. Moroney et al., 2002; Kahn et al., 2007).
15
To determine the smoke plume heights for the High Park Fire, we use the MISR Interactive Explorer (MINXv2) software package (http://www.openchannelfoundation. org/projects/MINX). This software combines MISR and MODIS data to retrieve smoke stereo-heights. The MINX software is available free to the public and has been used previously to develop climatologies of fire smoke plume heights over North America 20
(Val Martin et al., 2010) and Indonesia (Tosca et al., 2011). A detailed review of limita-tions and errors of the plume heights retrieved by MINX is presented in Val Martin et al. (2010). In this study, we retrieve smoke plume heights following the work of Val Martin et al. (2010).
2.2 NCAR Fire INventory model
25
ACPD
13, 8233–8260, 2013Fire smoke impacts
M. Val Martin et al.
Title Page
Abstract Introduction
Conclusions References
Tables Figures
◭ ◮
◭ ◮
Back Close
Full Screen / Esc
Printer-friendly Version Interactive Discussion
Discussion
P
a
per
|
Dis
cussion
P
a
per
|
Discussion
P
a
per
|
Discussio
n
P
a
per
|
uses satellite observations of active fires and land cover, in combination with emissions factors and estimated fuel loadings. The uncertainty in the FINNv1 emission estimates is about a factor of two. However, the global estimates agree reasonably well with other global inventories of biomass burning emissions for CO, CO2, and other species with
less variable emission factors (Wiedinmyer et al., 2011). In this work, we extract daily 5
area burned and carbonaceous aerosol emissions over Colorado from 1 May –1 Octo-ber 2002–2012.
2.3 Surface PM2.5observations
Surface PM2.5observations for the fire seasons from 2000 to 2012 were obtained from the Air Pollution Control Division (APCD) of the CDPHE. The APCD operates and main-10
tains a network of ambient air quality monitoring sites for Colorado (PM10, PM2.5, O3,
CO and NO2). In 2000–2011, surface PM2.5was measured as 24-h samples collected on a Teflon filter and analyzed pre- and post-sample for net weight, whereas surface PM2.5in 2012 was measured continuously with a tapered element oscillating
microbal-ance (TEOM 1400a, Thermo Scientific) with a Filter Dynamic Measurement System 15
(8500C FDMS) (Bradley Rink, CDPHE, personal communication, 2012). The TEOM provides a direct mass measurement of PM2.5and the FDMS accounts for volatile and
semi-volatile components, which may be present in smoke plumes. We average obser-vations collected over 10 sites within the Colorado Front Range corridor, comprising 7 cities (i.e. Fort Collins, Greeley, Longmont, Boulder, Denver, Colorado Springs and 20
Pueblo), and present daily PM2.5 for 2000–2012, in addition to hourly PM2.5 for 2012 since higher resolution observations are available for this season.
In addition to the CDPHE PM2.5network, we use surface PM2.5measurements
col-lected on the CSU Department of Atmospheric Science campus. These particle mass concentrations were obtained using a TEOM 1405-DF (Thermo Scientific), housed in 25
ACPD
13, 8233–8260, 2013Fire smoke impacts
M. Val Martin et al.
Title Page
Abstract Introduction
Conclusions References
Tables Figures
◭ ◮
◭ ◮
Back Close
Full Screen / Esc
Printer-friendly Version Interactive Discussion
Discussion
P
a
per
|
Dis
cussion
P
a
per
|
Discussion
P
a
per
|
Discussio
n
P
a
per
|
a broad dynamic range, high resolution, and relatively high time resolution. The mobile laboratory was located within a few kilometers of the southeastern edge of the Hewlett Gulch and High Park fires, and the laboratory was frequently impacted by smoke from the fires. For this study, we use daily and 1-h averages.
3 Results
5
3.1 Fire seasons in Colorado
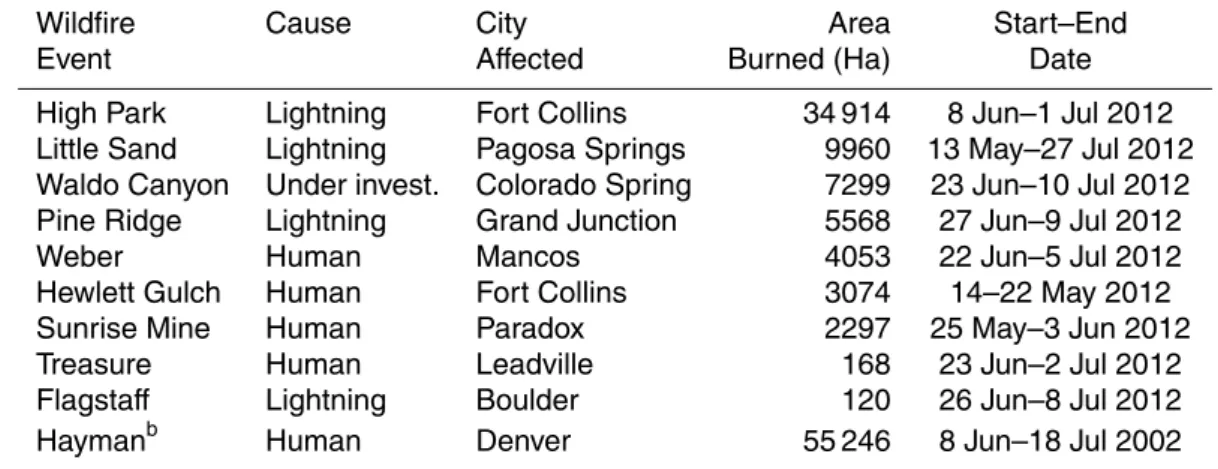
We study the magnitude of the Colorado fire seasons over the last decade using FINN daily area burned from 2002 to 2012, and climatological aerosol observations from MODIS (2000–2012). Figure 1 shows daily area burned over Colorado for the last decade. For clarity, we separately show daily area burned for two high active fire sea-10
sons (2002 and 2012) and the minimum and maximum range reported for all other fire seasons (2003–2011). We define the fire season as the period from 1 May to 1 Octo-ber.
As detailed in Sect. 1, Colorado experienced its worst fire seasons in 2002 and 2012. According to FINN, total area burned were 730 and 377 km2 in 2002 and 2012, with 15
carbonaceous aerosol emissions totaling 1.43 and 1.33 Tg in each fire season, respec-tively. Between 2003 and 2011, a total of about 150 km2 were burned and 0.25 Tg of aerosol were emitted on average every fire season. In 2012, about 80 % of the area (300 km2) burned from mid-June to mid-July, mainly due to the High Park and Waldo Canyon fires (Table 1); about 86 % of the total aerosol for the fire season were emit-20
ted during that period (1.14 Tg). In comparison, 0.74 Tg of aerosol were emitted during the 2002 Hayman fire, with a larger area burned (488 km2). In 2012 larger emissions, but lower area burned (than those in 2002) were most likely the result of different fuel types. During the High Park and Waldo Canyon fires, fuel loads consisted of spruce, mixed conifers and pine in thick forests (Barnes et al., 2012), whereas the Hayman fire 25
ACPD
13, 8233–8260, 2013Fire smoke impacts
M. Val Martin et al.
Title Page
Abstract Introduction
Conclusions References
Tables Figures
◭ ◮
◭ ◮
Back Close
Full Screen / Esc
Printer-friendly Version Interactive Discussion
Discussion
P
a
per
|
Dis
cussion
P
a
per
|
Discussion
P
a
per
|
Discussio
n
P
a
per
|
important to note that, in absolute values, the FINN area burned does not agree very well with that reported by the National Interagency Fire Center in Table 1. However, both sources of information agree on the relative magnitude of the fires.
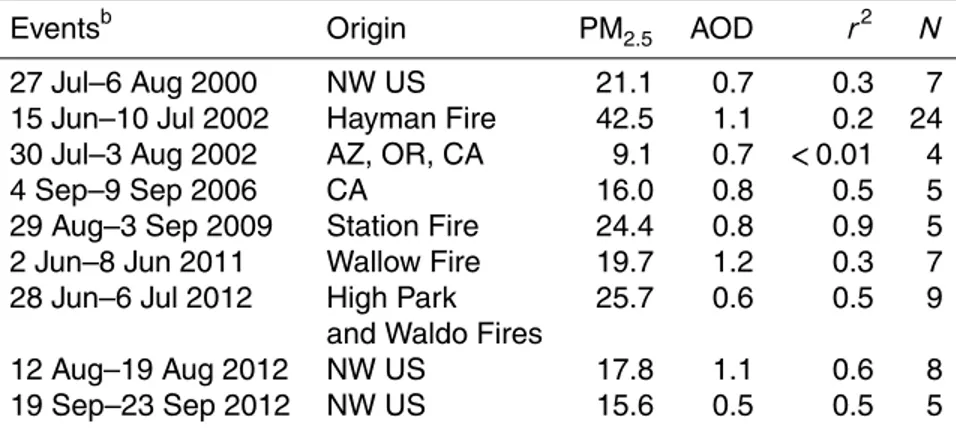
Figure 2 shows average AOD over the western US for the fire seasons of 2002, 2012, and 2000–2001/2003–2011. In this work, we focus on the state of Colorado 5
and, in particular the Colorado Front Range (CFR) corridor since this region comprises 86 % of the whole state population (http://www.census.gov). We identify both regions in Fig. 2. Similar to the fire area burned, AOD levels over Colorado were larger during the two high fire seasons we have identified than in all other years. Average AOD levels over the CFR were 20–50 % larger in 2002 and 2012 than in 2000–2001/2003–2011, 10
with average values of 0.3, 0.24 and 0.2, respectively. These results suggest that fire smoke contributes significantly to the AOD levels observed over Colorado.
3.2 Impact of local versus transported smoke
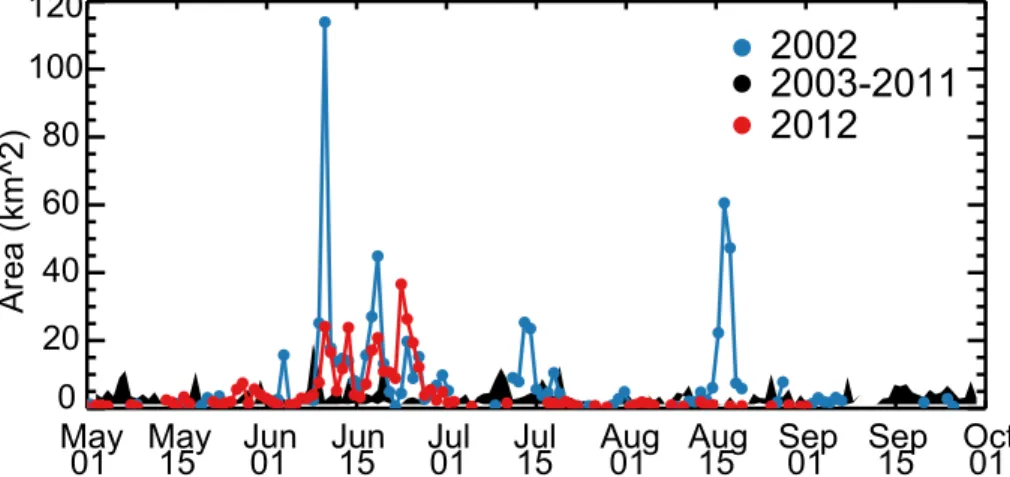
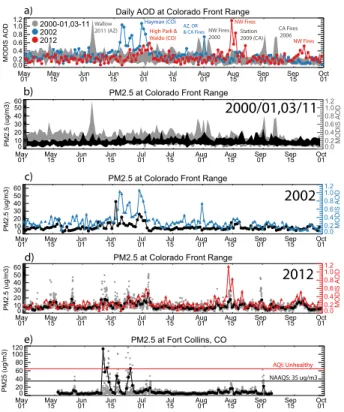
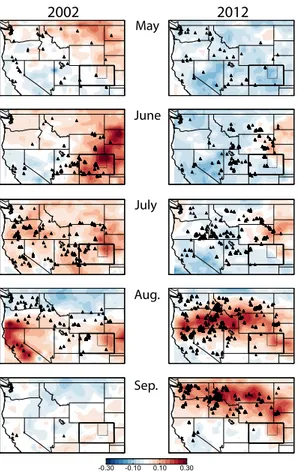
We assess the impact of local and transported smoke over Colorado using MODIS AOD observations. Figure 3a compares daily AOD averaged over the CFR in the 2002 15
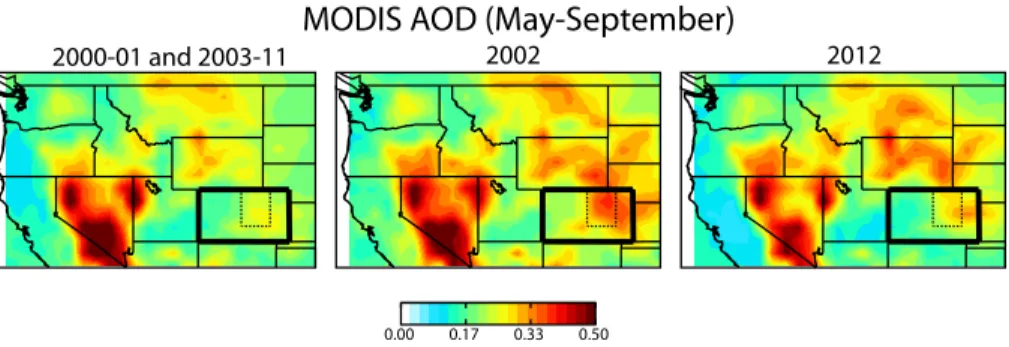
and 2012 fire seasons to the minimum and maximum AOD range recorded during the low active fire seasons (2000–2001 and 2003–2011). Key fires that affected AOD levels are identified in Fig. 3a. In addition, Fig. 4 shows monthly AOD anomalies over the western US (and Colorado) in 2002 and 2012. We consider AOD anomaly to be the difference between the monthly AOD and the monthly average obtained in the 20
climatology of low active fire seasons. MODIS fire pixels identifying active fire locations are also shown in Fig. 4.
AOD anomalies over the CFR are associated with both local and transported fire smoke. For example, unusually large AOD levels in June 2002 (AOD of up to 1.0 on 20–21 June and 1 July 2002 in Fig. 3a) were mainly associated with the local Hay-25
ACPD
13, 8233–8260, 2013Fire smoke impacts
M. Val Martin et al.
Title Page
Abstract Introduction
Conclusions References
Tables Figures
◭ ◮
◭ ◮
Back Close
Full Screen / Esc
Printer-friendly Version Interactive Discussion
Discussion
P
a
per
|
Dis
cussion
P
a
per
|
Discussion
P
a
per
|
Discussio
n
P
a
per
|
to 1.2 on 15 August 2012 (Fig. 3a). Although the local High Park and Waldo Canyon fires emitted significant amounts of aerosol (1.14 Tg from 8 June–10 July 2012), they did not lead to especially enhanced AOD over the CFR, with a maximum AOD recorded of 0.6 in 4 July 2012. This modest AOD increase may be due to the strong winds that blew during the peak of the fires (average 30 mph with gust of up to 50 mph) (Hanlon, 5
2012), which spread the smoke outside the study region (e.g. Colorado eastern plains, Nebraska and Wyoming as shown in Fig. 4 for June and July, 2012).
Impact of transported smoke from fires outside Colorado is a common phenomenon as shown in Fig. 3a. Record AOD levels (>1.1) observed by MODIS over the CFR were due to smoke from the Arizona Wallow fire that reached Colorado in 5 June 2011 (Gib-10
bons, 2011) and from the northwestern US in August 2012 as mentioned above. Long-range transport of smoke from California (>1500 km away) often impacts Colorado as well. For example, smoke from the Station fire reached the CFR on 1 September 2009, resulting in regional AOD of up to 0.8. Smoke from the Station fire was reported over Colorado associated with both elevated ice nuclei concentrations on 1 September 15
2009 (Prenni et al., 2012) and elevated aerosol number concentrations over the Rocky Mountain National Park in 31 August 2009 (Levin, 2013).
While the satellite AOD record provides a decadal context for the importance of local and out-of-state fires on aerosol loading over Colorado, these AOD enhancements do not necessarily imply corresponding surface impacts on human health.
20
3.3 Impact of smoke on surface PM2.5
To examine the impacts of fire smoke on surface particulate matter concentrations we use ground-level PM2.5measurements gathered by the CDPHE APCD and by CSU in
Fort Collins. We focus here on the effects in 2002 and 2012 as those were the most active fire seasons, as described in Sect. 3.1. Figure 3b–d shows daily PM2.5 over
25
ACPD
13, 8233–8260, 2013Fire smoke impacts
M. Val Martin et al.
Title Page
Abstract Introduction
Conclusions References
Tables Figures
◭ ◮
◭ ◮
Back Close
Full Screen / Esc
Printer-friendly Version Interactive Discussion
Discussion
P
a
per
|
Dis
cussion
P
a
per
|
Discussion
P
a
per
|
Discussio
n
P
a
per
|
campus. These observations were made a few kilometers downwind from the Hewlett Gulch and High Park fires.
It is apparent from Fig. 3c, d that fire smoke frequently impacted surface PM2.5 in
2002 and 2012, and measured PM2.5 levels were higher than the National Ambient
Air Quality Standard (NAAQS; 24-h PM2.5of 35 µg m− 3
) on several occasions. For ex-5
ample, daily PM2.5 during the Hayman fire reached levels up to 40 µg m− 3
over the entire CFR (Fig. 3c), with daily PM2.5 of 45–50 µg m−3 and 1-h peaks of 200 µg m−3
recorded in Denver as reported by Vedal and Dutton (2006). In 2012, smoke from the High Park and Waldo Canyon fires also significantly affected the CFR, with daily PM2.5
levels up to 30 µg m−3 recorded across the region (Fig. 3d). Closer to the High Park
10
fire, however, measurements at CSU show that daily PM2.5 was above 100 µg m− 3
at times, with 1-h peaks of up to 400 µg m−3. Air quality over this area was classified by
the Air Quality Index as unhealthy (65.5–150.4 µg m−3) for 4 days and as unhealthy for
sensitive groups (40.5–65.4 µg m−3) for almost a week; daily-mean PM
2.5 levels were
above the NAAQS for 7 days. Further downwind, measurements made by the CDPHE 15
over the city of Fort Collins (not shown) detected PM2.5concentrations also above the daily NAAQS during the Hewlett Gulch and High Park fires. Sameenoi et al. (2013) reported particulate matter oxidative activity values (31.1–43.5 pmol min−1µg−1) over
Fort Collins during the High Park fire comparable to highly polluted urban cities such as Los Angeles and Mexico city (20–50 pmol min−1µg−1). The oxidative capacity levels
20
on a clean day in Fort Collins are about 5.5–6.3 pmol min−1µg−1.
Surface PM2.5 has been shown to correlate well with MODIS AOD, in particular in cloud-free conditions with well-mixed BL heights, no overlying aerosols and aerosols with similar optical properties (Hoff and Christopher, 2009, and references therein). For example, Engel-Cox et al. (2004) reported a typical MODIS AOD–PM2.5 squared-25
av-ACPD
13, 8233–8260, 2013Fire smoke impacts
M. Val Martin et al.
Title Page
Abstract Introduction
Conclusions References
Tables Figures
◭ ◮
◭ ◮
Back Close
Full Screen / Esc
Printer-friendly Version Interactive Discussion
Discussion
P
a
per
|
Dis
cussion
P
a
per
|
Discussion
P
a
per
|
Discussio
n
P
a
per
|
eraged over the CFR in Fig. 3b–d; Table 2 presents a summary of the AOD–PM2.5 relationship for the main fire events identified in Fig. 3a.
MODIS AOD tracked surface PM2.5 reasonably well over the CFR, indicating that
smoke aerosol was often located near the ground, below the BL (Al-Saadi et al., 2005). Eight out of nine fire events identified as having AOD enhanced produced a significant 5
PM2.5enhancement, and MODIS AOD and PM2.5correlated reasonably well (r 2
=0.2–
0.9) during these events (Table 2). For example, MODIS AOD and PM2.5 were signif-icantly enhanced and well-correlated during the northwestern US event of 10–19 Au-gust 2012 (1.1, 17.8 µg m−3andr2
=0.6, respectively), during the California Station fire (0.8, 24.4 µg m−3 and r2
=0.9), and during the Arizona Wallow (1.2, 19.7 µg m−3 and
10
r2=0.2), suggesting that smoke aerosol from western US fires subsided to the BL over the CFR and affected the air quality over the broad region. This is not always the case. Smoke aerosol from California, Oregon and Arizona fires in August 2002 was trans-ported over the CFR as indicated by high levels of AOD (about 0.7) and NOAA AVHRR images of smoke plumes across the western US (NOAA’s NCDC, 2002). However, 15
the smoke plume did not reach the surface since PM2.5 concentrations remained at
background levels (<10 µg m−3) and there was a poor MODIS AOD–PM
2.5correlation
(r2<0.01), as shown in Table 2. Therefore, the smoke plume altitude, and subsequent descent into the boundary layer downwind, is critical to linking smoke with air quality impacts.
20
3.4 Vertical smoke injection heights
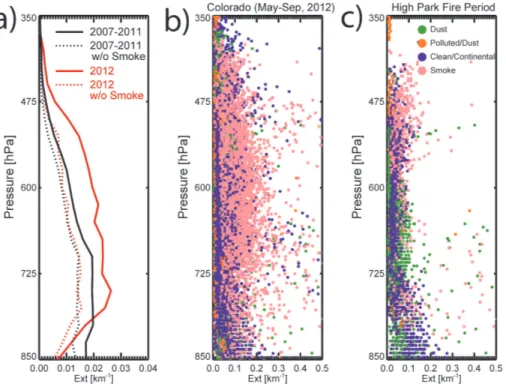
We use CALIOP extinction coefficient observations to assess the relationship between vertical smoke distribution and air quality impacts. Figure 5a shows extinction coeffi -cient profiles obtained by averaging all daytime and nighttime aerosol extinction values reported by CALIOP over Colorado during the fire seasons 2012 and 2007–2011. Us-25
ACPD
13, 8233–8260, 2013Fire smoke impacts
M. Val Martin et al.
Title Page
Abstract Introduction
Conclusions References
Tables Figures
◭ ◮
◭ ◮
Back Close
Full Screen / Esc
Printer-friendly Version Interactive Discussion
Discussion
P
a
per
|
Dis
cussion
P
a
per
|
Discussion
P
a
per
|
Discussio
n
P
a
per
|
Fig. 5a. In addition, in Fig. 5b we show the vertical distribution of all aerosol extinc-tion values for summer 2012, as an example of the typical summertime aerosol types present over Colorado.
Figure 5a confirms that the 2012 fire season had on average a larger extinction coefficient than the fire seasons of 2007–2011, in particular at pressure levels above 5
800 hPa. The typical average surface air pressure over the CFR is about 850 hPa. During summer 2012, aerosol types over Colorado were classified as smoke, dust, polluted-dust and clean-continental (Fig. 5b), with smoke aerosol being the predom-inant type; August was the month with the largest smoke aerosol load (not shown). Smoke aerosols were mostly concentrated at an altitude range of about 1.0–3.5 km 10
above ground level (a.g.l.) (i.e. 750–550 hPa). Therefore, while PM2.5 concentrations clearly show that smoke from the 2012 fires did impact surface air quality, much of the smoke plume was located in the lower free troposphere. In Fig. 5a, the aerosol extinc-tion profiles without smoke aerosol are very similar at all pressure levels for 2007–2011 and 2012. These results show that aerosol extinction over Colorado is fairly consistent 15
during the summertime and suggest that any changes in extinction coefficient (and AOD) are likely the result of the annual variability of fire smoke loading.
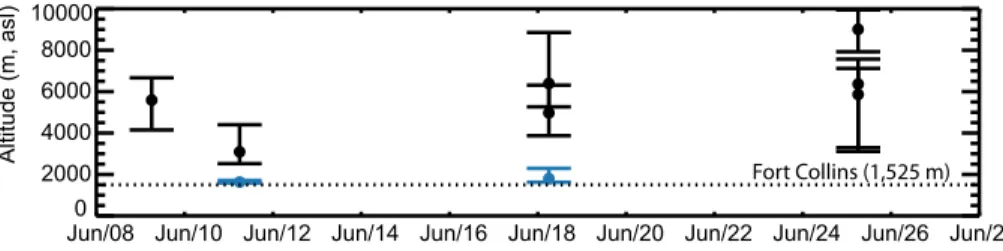
To further investigate smoke plume elevation and its link to air quality effects, we de-termine the aerosol plume height for the High Park fire using MINX. Figure 6 shows the vertical aerosol distribution for 7 smoke plumes observed by MISR at the fire source 20
during the fire peak (8–28 June 2012). Minimum and maximum smoke heights cal-culated by MINX are shown along with the best estimated median height, which rep-resents the height where most of the smoke is concentrated. An example of a MISR smoke plume digitized by MINX for a different fire can be seen in Fig. 1 of Val Martin et al. (2010). Additionally, we include two smoke clouds, i.e. smoke located relatively 25
ACPD
13, 8233–8260, 2013Fire smoke impacts
M. Val Martin et al.
Title Page
Abstract Introduction
Conclusions References
Tables Figures
◭ ◮
◭ ◮
Back Close
Full Screen / Esc
Printer-friendly Version Interactive Discussion
Discussion
P
a
per
|
Dis
cussion
P
a
per
|
Discussion
P
a
per
|
Discussio
n
P
a
per
|
The High Park fire median plume heights ranged from about 1.5 to 7.5 km a.g.l., with an average median plume height of 4.4 km a.g.l. The maximum altitude reached by the smoke was about 8.5 km a.g.l. The High Park fire burned intensely between 8 and 18 June 2012 because of strong winds and very dry conditions; about 40 % and 6 % of the perimeter burned at moderate and high severities (Barnes et al., 2012). Similar 5
smoke vertical injection heights were observed by CALIOP, with the smoke aerosols distributed from about 1 to 6 km altitude a.g.l. (i.e. about 750–400 hPa; Fig. 5c). Based on a 5-yr climatology of MISR plume heights over North America, Val Martin et al. (2010) determine that typical plume heights for temperate forests and shrubland are about 800 m a.g.l., and that those plumes rarely reach more than 4.4 km a.g.l. Smoke 10
plumes generated by the intense High Park fire reached extraordinary altitudes and the majority of the smoke was injected into the free troposphere since typical summertime BL heights over temperate biomes range from 1 to 1.8 km (Val Martin et al., 2010).
It is important to note that smoke from the High Park fire may have reached higher elevations than those observed at the time of the MISR overpass (11:00–13:00 LT), i.e. 15
later in the day, in part because fire intensity increases in the late afternoon (Giglio et al., 2006), and in part because of atmospheric processes unrelated to the fire itself (e.g. convection and/or advection) (Val Martin et al., 2010). For example, the Deep Convective Clouds and Chemistry (DC3) aircraft campaign intercepted a smoke plume from the High Park fire within the core of a storm at about 8 km over Wyoming on 20
22 June 2012. Smoke and high levels of CO and aldehydes produced by the fire were detected at altitudes as high as 12.3 km (Crawford, 2012).
Smoke from the High Park fire was at times also present at ground levels. Two smoke clouds were observed by MISR over Fort Collins on 11 and 18 June 2012 as shown in Fig. 6. Smoke from the fire blanked the whole city and significantly impacted the air 25
quality as described in Sect. 3.3. In particular, on 11 and 18 June, daily average PM2.5 levels reached about 40 µg m−3, indicating the significant impact that smoke from the
ACPD
13, 8233–8260, 2013Fire smoke impacts
M. Val Martin et al.
Title Page
Abstract Introduction
Conclusions References
Tables Figures
◭ ◮
◭ ◮
Back Close
Full Screen / Esc
Printer-friendly Version Interactive Discussion
Discussion
P
a
per
|
Dis
cussion
P
a
per
|
Discussion
P
a
per
|
Discussio
n
P
a
per
|
not retrieve high extinction values near the surface (Winker et al., 2009), and in part because it may not have detected the same smoke clouds (CALIOP’s swath is 4000 narrower than MISR’s) (Kahn et al., 2008). These results highlight the complex verti-cal structure of smoke, with defined plumes overlaying diffuse smoke clouds, and the challenges of estimating air quality impacts from total column measurements.
5
4 Conclusions
We show the significant effect that fire smoke had on aerosol concentrations, on the vertical column and at ground level, over the Colorado Front Range during high ac-tive fire seasons. Fire smoke adversely impacted air quality over an extended region. During the high active fire seasons of 2002 and 2012, PM2.5levels were often higher
10
than the daily NAAQS and reached unhealthy levels. For example, PM2.5 levels were elevated up to 40 µg m−3 over the entire CFR corridor during the 2002 Hayman fire,
and concentrations above 100 µg m−3 were detected over a populated area outside
Fort Collins during the 2012 High Park fire. AOD levels were also abnormally high during the high active fire seasons (20–50 % larger in 2002 and 2012 than in 2000– 15
2001/2003–2011).
In addition to local fire smoke pollution, long-range transport of smoke to Colorado occurs frequently, affecting AOD and surface PM2.5levels. Maximum MODIS AOD
lev-els over the CFR (spatial average of∼1.2) in the last decade were due to smoke
trans-ported from the northwestern US fires. Transtrans-ported smoke often subsides into the BL 20
and impacts the air quality over the region. During these events, MODIS AOD corre-lates well with surface PM2.5. For instance, in a smoke event from the California Station
fire (29 August–3 September 2009) the AOD–PM2.5relationship had anr 2
of 0.9. The MODIS AOD climatology provides a long-term record of the relative importance of lo-cal and transported smoke on the aerosol loading over Colorado. However, fire smoke 25
ACPD
13, 8233–8260, 2013Fire smoke impacts
M. Val Martin et al.
Title Page
Abstract Introduction
Conclusions References
Tables Figures
◭ ◮
◭ ◮
Back Close
Full Screen / Esc
Printer-friendly Version Interactive Discussion
Discussion
P
a
per
|
Dis
cussion
P
a
per
|
Discussion
P
a
per
|
Discussio
n
P
a
per
|
one event in which transported smoke, with a corresponding AOD enhancement, did not affect surface PM2.5.
The observed plume heights for the High Park fire show the complexity of the ver-tical distribution of smoke emitted by the fire and the important role that atmospheric processes unrelated to the fire itself play. Smoke was detected from a range of 1.0 5
to 7.5 km altitude at the fire origin to ground levels to 12.3 km altitude far away from the source. The variability in smoke injection heights from the High Park fire as well as the local meteorology were key in affecting the aerosol loading and air quality over the CFR. For example, smoke released from the High Park fire did not significantly enhance AOD over the CFR (up to 0.6), but increased daily PM2.5 to unhealthy con-10
centrations (>100 µg m−3) at times and on a local scale. This large variability in smoke
injection heights needs to be taken into account in future modeling studies to accu-rately simulate the impact of smoke on air quality on a regional scale (Val Martin et al., 2012).
To understand the link between health outcomes and air quality degradation from fire 15
activity, it is critical to have accurate information of the smoke vertical distribution and its connection to the surface. Characterization of the current impact of smoke, from both local and out-of-state fires, on Colorado air quality and its link to human health is key to developing predictive tools that help regional agencies create proper health advisories during fire episodes.
20
Acknowledgements. This work was supported by the US National Park Service (Grant H2370 094000/J2350103006). We thank the MODIS, CALIOP and MISR teams for the satellite ob-servations, and the Air Pollution Control Division of the Colorado Department of Public Health and Environment for the PM2.5 measurements. Measurements of PM2.5 at CSU were funded by the NOAA Atmospheric Composition and Climate Program (Award NA10OAR4310103) and
25
ACPD
13, 8233–8260, 2013Fire smoke impacts
M. Val Martin et al.
Title Page
Abstract Introduction
Conclusions References
Tables Figures
◭ ◮
◭ ◮
Back Close
Full Screen / Esc
Printer-friendly Version Interactive Discussion
Discussion
P
a
per
|
Dis
cussion
P
a
per
|
Discussion
P
a
per
|
Discussio
n
P
a
per
|
References
Al-Saadi, J., Szykman, J., Pierce, R. B., Kittaka, C., Neil, D., Chu, D. A., Remer, L., Gumley, L., Prins, E., Weinstock, L., MacDonald, C., Wayland, R., Dimmick, F., and Fishman, J.: Improv-ing national air quality forecasts with satellite aerosol observations, B. Am. Meteorol. Soc., 86, 1249–1261, doi:10.1175/BAMS-86-9-1249, 2005. 8235, 8244
5
Barnes, P., Cloudman, R., Mohr, A., and Engemoen, M.: Burn Area Emergency Response Report for High Park Fire, Tech. Rep., US Forest Service, available at: http://www.inciweb.org (last access: 20 December 2012), 2012. 8240, 8246
CBSNews: Smoke from wildfire 60 miles away blankets Denver, CBSNews (06/12/2012), available at: http://www.cbsnews.com/8301-201 162-57451498/
10
smoke-from-wildfire-60-miles-away-blankets-denver, last access: 5 February 2013, 2012. 8236
Crawford, J.: Science/Operations Report: 22 and 23 June, available at: http://catalog1.eol. ucar.edu/cgi-bin/dc3 2012/htmlwrap?file url=/dc3 2012/report/dc-8/20120622/report.DC-8. 201206221954.operations summary.html, last access: 2 February 2013, 2012. 8246
15
Diner, D. J., Beckert, J., Reilly, T., Bruegge, C., Conel, J., Kahn, R., Martonchik, J., Acker-man, T., Davies, R., Gerstl, S., Gordon, H., Muller, J.-P., Myneni, R., Sellers, P., Pinty, B., and Verstraete, M.: Multi-angle Imaging SpectroRadiometer (MISR) instrument description and experiment overview, IEEE T. Geosci. Remote, 36, 1072–1087, 1998. 8238
Duck, T. J., Firanski, B. J., Millet, D. B., Goldstein, A. H., Allan, J., Holzinger, R., Worsnop, D. R.,
20
White, A. B., Stohl, A., Dickinson, C. S., and van Donkelaar, A.: Transport of forest fire emis-sions from Alaska and the Yukon Territory to Nova Scotia during summer 2004, J. Geophys. Res., 112, D10S44, doi:10.1029/2006JD007716, 2007. 8235
Engel-Cox, J. A., Holloman, C. H., Coutant, B. W., and Hoff, R. M.: Qualitative and quantitative evaluation of MODIS satellite sensor data for regional and urban scale air quality, Atmos.
25
Environ., 38, 2495–2509, doi:10.1016/j.atmosenv.2004.01.039, 2004. 8235, 8243
Evans, J., van Donkelaar, A., Martin, R. V., Burnett, R., Rainham, D. G., Birkett, N. J., and Krewski, D.: Estimates of global mortality attributable to particulate air pollution using satellite imagery, Environ. Res., 120, 33–42, doi:10.1016/j.envres.2012.08.005, 2013. 8235
Ford, B. and Heald, C. L.: An A-train and model perspective on the vertical distribution of
30
ACPD
13, 8233–8260, 2013Fire smoke impacts
M. Val Martin et al.
Title Page
Abstract Introduction
Conclusions References
Tables Figures
◭ ◮
◭ ◮
Back Close
Full Screen / Esc
Printer-friendly Version Interactive Discussion
Discussion
P
a
per
|
Dis
cussion
P
a
per
|
Discussion
P
a
per
|
Discussio
n
P
a
per
|
Gibbons, C.: Smoke from Arizona fire blanketing Front Range, DenverPost (06/07/2011), avail-able at: http://www.denverpost.com/news/ci 18219851, last access: 5 February 2013, 2011. 8242
Giglio, L., Descloitres, J., Justice, C. O., and Kaufman, Y. J.: An enhanced contextual fire de-tection algorithm for MODIS, Remote Sens. Environ., 87, 273–282, 2003. 8237
5
Giglio, L., Csiszar, I., and Justice, C. O.: Global distribution and seasonality of active fires as observed with the Terra and Aqua Moderate Resolution Imaging Spectroradiometer (MODIS) sensors, J. Geophys. Res., 111, D02016, doi:10.1029/2005JG000142, 2006. 8246
Graham, R. T.: Hayman Fire Case Study: Summary, Tech. Rep., RMRS-GTR-115, US Depart-ment of Agriculture, Forest Service, Rocky Mountain Research Station, available online at:
10
http://www.fs.fed.us/rm/pubs/ (last access: 20 December 2012), 2003. 8240
Hanlon, T.: Colorado wildfire: High winds push High Park fire to 56 480 acres; more evac-uations, DenverPost (06/17/2012), available at: http://www.denverpost.com/breakingnews/ ci 20877792/high-park-fire-colorado-looting, last access: 5 February 2013, 2012. 8242 Hoff, R. M. and Christopher, S.: Remote sensing of particulate pollution from space: have
15
we reached the promised land?, J. Air Waste Manage., 59, 645–675, doi:10.3155/1047-3289.59.6.645, 2009. 8235, 8243
Kahn, R. A., Li, W.-H., Moroney, C., Diner, D. J., Martonchik, J. V., and Fishbein, E.: Aerosol source plume physical characteristics from space-based multi-angle imaging, J. Geophys. Res., 112, D11205, doi:10.1029/2006JD007647, 2007. 8238
20
Kahn, R. A., Chen, Y., Nelson, D. L., Leung, F.-Y., Li, Q., Diner, D. J., and Logan, J. A.: Wildfire smoke injection heights – two perspectives from space, Geophys. Res. Lett., 35, L04809, doi:10.1029/2007GL032165, 2008. 8247
Kaufman, Y. J., Justice, C. O., Flynn, L. P., Kendall, J. D., Prins, E. M., Giglio, L., Ward, D. E., Menzel, W. P., and Setzer, A. W.: Potential global fire monitoring from EOS-MODIS, J.
Geo-25
phys. Res., 103, 32315–32338, 1998. 8237
Kochi, I., Champ, P. A., Loomis, J. B., and Donovan, G. H.: Valuing mortality impacts of smoke exposure from major southern California wildfires, J. Forest Econ., 18, 61–75, doi:10.1016/j.jfe.2011.10.002, 2012. 8235
Levin, E. J. T.: Remote Continental Aerosol Characteristics in the Rocky Mountains of Colorado
30
and Wyoming, Ph.D. thesis, Colorado State University, Fort Collins, CO, 2013. 8242
ACPD
13, 8233–8260, 2013Fire smoke impacts
M. Val Martin et al.
Title Page
Abstract Introduction
Conclusions References
Tables Figures
◭ ◮
◭ ◮
Back Close
Full Screen / Esc
Printer-friendly Version Interactive Discussion
Discussion
P
a
per
|
Dis
cussion
P
a
per
|
Discussion
P
a
per
|
Discussio
n
P
a
per
|
health-advisory-issued-due-smoke-colorado-from-wyoming, last access: 5 February 2013, 2012. 8236
Moroney, C., Davies, R., and Muller, J.-P.: Operational retrieval of cloud-top heights using MISR data, IEEE T. Geosci. Remote, 40, 1541–1546, 2002. 8238
Naeher, L., Brauer, M., Lipsett, M., Zelikoff, J., Simpson, C., and Koenig, J.: Woodsmoke health
5
effects: a review, Inhal. Toxicol., 19, 67–106, 2007. 8235
NOAA’s NCDC: Climate of 2002: Wildfire Season Summary (12/16/2002), NOAA’s Na-tional Climatic Data Center (06/17/2012), available at: http://www.ncdc.noaa.gov/oa/climate/ research/fire02.html, last access: 5 February 2013, 2002. 8244
Omar, A. H., Winker, D. M., Vaughan, M. A., Hu, Y., Trepte, C. R., Ferrare, R. A., Lee,
K.-10
P., Hostetler, C. A., Kittaka, C., Rogers, R. R., Kuehn, R. E., and Liu, Z.: The CALIPSO automated aerosol classification and lidar ratio selection algorithm, J. Atmos. Ocean. Tech., 26, 1994–2014, doi:10.1175/2009JTECHA1231.1, 2009. 8237
Prenni, A. J., DeMott, P. J., Sullivan, A. P., Sullivan, R. C., Kreidenweis, S. M., and Rogers, D. C.: Biomass burning as a potential source for atmospheric ice nuclei: western wildfires and
15
prescribed burns, Geophys. Res. Lett., 39, L11805, doi:10.1029/2012GL051915, 2012. 8242 Sameenoi, Y., Panymeesamer, P., Supalakorn, N., Koehler, K., Chailapakul, O., Henry, C., and Volckens, J.: Microfluidic paper-based analytical device for aerosol oxidative activity, Environ. Sci. Technol., 47, 932–940, doi:10.1021/es304662w, 2013. 8243
Spracklen, D. V., Mickley, L. J., Logan., J. A., Hudman, R. C., Yevich, R., Flannigan, M. D.,
20
and Westerling, A. L.: Impacts of climate change from 2000 to 2050 on wildfire activity and carbonaceous aerosol concentrations in the western United States, J. Geophys. Res., 114, D2030, doi:10.1029/2008JD010966, 2009. 8235
Tosca, M., Randerson, J., Zender, C., Nelson, D., Diner, D., and Logan, J.: Dynamics of fire plumes and smoke clouds associated with peat and deforestation fires in Indonesia, J.
Geo-25
phys. Res., 116, D08207, doi:10.1029/2010JD015148, 2011. 8238
Trentmann, J., Andreae, M. O., Graf, H.-F., Hobbs, P. V., Ottmar, R. D., and Trautmann, T.: Simulation of a biomass-burning plume: comparison of model results with observations, J. Geophys. Res., 107, D24013, doi:10.1029/2001JD000410, 2002. 8235
Val Martin, M., Honrath, R., Owen, R. C., Pfister, G., Fialho, P., and Barata, F.: Significant
30
ACPD
13, 8233–8260, 2013Fire smoke impacts
M. Val Martin et al.
Title Page
Abstract Introduction
Conclusions References
Tables Figures
◭ ◮
◭ ◮
Back Close
Full Screen / Esc
Printer-friendly Version Interactive Discussion
Discussion
P
a
per
|
Dis
cussion
P
a
per
|
Discussion
P
a
per
|
Discussio
n
P
a
per
|
Val Martin, M., Logan, J. A., Kahn, R. A., Leung, F.-Y., Nelson, D. L., and Diner, D. J.: Smoke injection heights from fires in North America: analysis of 5 years of satellite observations, Atmos. Chem. Phys., 10, 1491–1510, doi:10.5194/acp-10-1491-2010, 2010. 8235, 8238, 8245, 8246
Val Martin, M., Kahn, R. A., Logan, J. A., Paugam, R., Wooster, M., and Ichoku, C.:
Space-5
based observational constraints for 1-D plume rise models, J. Geophys. Res., 117, D22204, doi:10.1029/2012JD018370, 2012. 8248
van der Werf, G. R., Randerson, J. T., Giglio, L., Collatz, G. J., Mu, M., Kasibhatla, P. S., Mor-ton, D. C., DeFries, R. S., Jin, Y., and van Leeuwen, T. T.: Global fire emissions and the contribution of deforestation, savanna, forest, agricultural, and peat fires (1997–2009),
At-10
mos. Chem. Phys., 10, 11707–11735, doi:10.5194/acp-10-11707-2010, 2010. 8235
Vedal, S. and Dutton, S. J.: Wildfire air pollution and daily mortality in a large urban area, Environ. Res., 102, 29–35, doi:10.1016/j.envres.2006.03.008, 2006. 8235, 8236, 8243 Westerling, A. L., Hidalgo, H. G., Cayan, D. R., and Swetnam, T. W.: Warming and
Earlier Spring Increase Western US Forest Wildfire Activity, Science, 313, 940–943,
15
doi:10.1126/science.1128834, 2006. 8235
Wiedinmyer, C., Akagi, S. K., Yokelson, R. J., Emmons, L. K., Al-Saadi, J. A., Orlando, J. J., and Soja, A. J.: The Fire INventory from NCAR (FINN): a high resolution global model to estimate the emissions from open burning, Geosci. Model Dev., 4, 625–641, doi:10.5194/gmd-4-625-2011, 2011. 8236, 8238, 8239
20
Winker, D. M., Vaughan, M. A., Omar, A., Hu, Y., Powell, K. A., Liu, Z., Hunt, W. H., and Young, S. A.: Overview of the CALIPSO mission and CALIOP data processing algorithms, J. Atmos. Ocean. Tech., 26, 2310–2323, doi:10.1175/2009JTECHA1281.1, 2009. 8237, 8247 Zhang, J. and Reid, J. S.: MODIS aerosol product analysis for data assimilation: assessment
of over-ocean level 2 aerosol optical thickness retrievals, J. Geophys. Res., 111, D22207,
25
ACPD
13, 8233–8260, 2013Fire smoke impacts
M. Val Martin et al.
Title Page
Abstract Introduction
Conclusions References
Tables Figures
◭ ◮
◭ ◮
Back Close
Full Screen / Esc
Printer-friendly Version Interactive Discussion
Discussion
P
a
per
|
Dis
cussion
P
a
per
|
Discussion
P
a
per
|
Discussio
n
P
a
per
|
Table 1.Summary of main 2012 Colorado fires, organized by area burned.a
Wildfire Cause City Area Start–End Event Affected Burned (Ha) Date High Park Lightning Fort Collins 34 914 8 Jun–1 Jul 2012 Little Sand Lightning Pagosa Springs 9960 13 May–27 Jul 2012 Waldo Canyon Under invest. Colorado Spring 7299 23 Jun–10 Jul 2012 Pine Ridge Lightning Grand Junction 5568 27 Jun–9 Jul 2012 Weber Human Mancos 4053 22 Jun–5 Jul 2012 Hewlett Gulch Human Fort Collins 3074 14–22 May 2012 Sunrise Mine Human Paradox 2297 25 May–3 Jun 2012 Treasure Human Leadville 168 23 Jun–2 Jul 2012 Flagstaff Lightning Boulder 120 26 Jun–8 Jul 2012 Haymanb Human Denver 55 246 8 Jun–18 Jul 2002
aData from http://www.nifc.gov.
ACPD
13, 8233–8260, 2013Fire smoke impacts
M. Val Martin et al.
Title Page
Abstract Introduction
Conclusions References
Tables Figures
◭ ◮
◭ ◮
Back Close
Full Screen / Esc
Printer-friendly Version Interactive Discussion
Discussion
P
a
per
|
Dis
cussion
P
a
per
|
Discussion
P
a
per
|
Discussio
n
P
a
per
|
Table 2.Statistical summary of main fire events identified over the CFR from 2000 to 2012.a
Eventsb Origin PM2.5 AOD r2 N
27 Jul–6 Aug 2000 NW US 21.1 0.7 0.3 7 15 Jun–10 Jul 2002 Hayman Fire 42.5 1.1 0.2 24 30 Jul–3 Aug 2002 AZ, OR, CA 9.1 0.7 <0.01 4 4 Sep–9 Sep 2006 CA 16.0 0.8 0.5 5 29 Aug–3 Sep 2009 Station Fire 24.4 0.8 0.9 5 2 Jun–8 Jun 2011 Wallow Fire 19.7 1.2 0.3 7 28 Jun–6 Jul 2012 High Park 25.7 0.6 0.5 9
and Waldo Fires
12 Aug–19 Aug 2012 NW US 17.8 1.1 0.6 8 19 Sep–23 Sep 2012 NW US 15.6 0.5 0.5 5
aReported maximum PM
2.5and AOD, squared-correlation coefficient (r2) and number of observations (N) within each period.
bFire events identified in Fig. 3a. Each episode includes two days before and after the fire
ACPD
13, 8233–8260, 2013Fire smoke impacts
M. Val Martin et al.
Title Page
Abstract Introduction
Conclusions References
Tables Figures
◭ ◮
◭ ◮
Back Close
Full Screen / Esc
Printer-friendly Version Interactive Discussion
Discussion
P
a
per
|
Dis
cussion
P
a
per
|
Discussion
P
a
per
|
Discussio
n
P
a
per
|
May
01 May15 Jun01 Jun15 Jul01 Jul15 Aug01 Aug15 Sep01 Sep15 Oct01 0
20 40 60 80 100 120
Area (km^2)
2002
2003-2011
2012
Fig. 1.Daily area burned in Colorado from 1 May to 1 October estimated by the NCAR FINN
ACPD
13, 8233–8260, 2013Fire smoke impacts
M. Val Martin et al.
Title Page
Abstract Introduction
Conclusions References
Tables Figures
◭ ◮
◭ ◮
Back Close
Full Screen / Esc
Printer-friendly Version Interactive Discussion
Discussion
P
a
per
|
Dis
cussion
P
a
per
|
Discussion
P
a
per
|
Discussio
n
P
a
per
|
2000-01 and 2003-11
2002
0.00 0.17 0.33 0.50
2012
MODIS AOD (May-September)
Fig. 2.Average MODIS AOD over the western US for the fire seasons (May–September) of
ACPD
13, 8233–8260, 2013Fire smoke impacts
M. Val Martin et al.
Title Page Abstract Introduction Conclusions References Tables Figures ◭ ◮ ◭ ◮ Back Close
Full Screen / Esc
Printer-friendly Version Interactive Discussion Discussion P a per | Dis cussion P a per | Discussion P a per | Discussio n P a per |
Daily AOD at Colorado Front Range
May
01 May15 Jun01 Jun15 Jul01 Jul15 Aug01 Aug15 Sep01 Sep15 Oct01 0.0 0.2 0.4 0.6 0.8 1.0 1.2 MODIS AOD 2000-01,03-11 2002 2012
PM2.5 at Colorado Front Range
PM2.5 at Fort Collins, CO
0 20 40 60 80 100 120 PM25 (ug/m3) AQI: Unhealthy
NAAQS: 35 ug/m3
2002 2012 a) c) d) e) Hayman (CO)
High Park & Waldo (CO) Wallow
2011 (AZ) AZ, OR & CA Fires
NW Fires Station 2009 (CA) CA Fires 2006 NW Fires 0 10 20 30 40 50 60
PM2.5 (ug/m3) 0.00.2
0.4 0.6 0.8 1.0 1.2 MODIS AOD 0 10 20 30 40 50 60
PM2.5 (ug/m3) 0.00.2
0.4 0.6 0.8 1.0 1.2 MODIS AOD
PM2.5 at Colorado Front Range 0 10 20 30 40 50 60
PM2.5 (ug/m3) 0.00.2
0.4 0.6 0.8 1.0 1.2 MODIS AOD
b) PM2.5 at Colorado Front Range
2000/01,03/11
NW Fires 2000
May
01 May15 Jun01 Jun15 Jul01 Jul15 Aug01 Aug15 Sep01 Sep15 Oct01
May
01 May15 Jun01 Jun15 Jul01 Jul15 Aug01 Aug15 Sep01 Sep15 Oct01
May
01 May15 Jun01 Jun15 Jul01 Jul15 Aug01 Aug15 Sep01 Sep15 Oct01
May
01 May15 Jun01 Jun15 Jul01 Jul15 Aug01 Aug15 Sep01 Sep15 Oct01
Fig. 3.Fire season time series (1 May to 1 October) of(a)average AOD over the Colorado Front
ACPD
13, 8233–8260, 2013Fire smoke impacts
M. Val Martin et al.
Title Page
Abstract Introduction
Conclusions References
Tables Figures
◭ ◮
◭ ◮
Back Close
Full Screen / Esc
Printer-friendly Version Interactive Discussion
Discussion
P
a
per
|
Dis
cussion
P
a
per
|
Discussion
P
a
per
|
Discussio
n
P
a
per
|
2002 2012
May
June
July
Aug.
Sep.
-0.30 -0.10 0.10 0.30
Fig. 4.Monthly MODIS AOD anomalies for the fire seasons of 2002 and 2012. The state of
ACPD
13, 8233–8260, 2013Fire smoke impacts
M. Val Martin et al.
Title Page
Abstract Introduction
Conclusions References
Tables Figures
◭ ◮
◭ ◮
Back Close
Full Screen / Esc
Printer-friendly Version Interactive Discussion
Discussion
P
a
per
|
Dis
cussion
P
a
per
|
Discussion
P
a
per
|
Discussio
n
P
a
per
|
Fig. 5.Extinction Coefficient observed by CALIOP over Colorado (37◦N to 41◦N and 109◦W to
102◦W):(a)average extinction profiles for the fire season of 2012 (solid red) and 2007–2011
ACPD
13, 8233–8260, 2013Fire smoke impacts
M. Val Martin et al.
Title Page
Abstract Introduction
Conclusions References
Tables Figures
◭ ◮
◭ ◮
Back Close
Full Screen / Esc
Printer-friendly Version Interactive Discussion
Discussion
P
a
per
|
Dis
cussion
P
a
per
|
Discussion
P
a
per
|
Discussio
n
P
a
per
|
Jun/08 Jun/10 Jun/12 Jun/14 Jun/16 Jun/18 Jun/20 Jun/22 Jun/24 Jun/26 Jun/28 0
2000 4000 6000 8000 10000
Altitude (m, asl)
Fort Collins (1,525 m)
Fig. 6. MISR smoke plume (black) and smoke clouds (blue) for the High Park fire. Circles