arXiv:1707.03500v1 [math.OC] 11 Jul 2017
Banking risk as an epidemiological model:
an optimal control approach
∗†
Olena Kostylenko
1Helena Sofia Rodrigues
1,2Delfim F. M. Torres
11
Center for Research and Development in Mathematics and Applications (CIDMA),
Department of Mathematics, University of Aveiro, 3810-193 Aveiro, Portugal
2
School of Business Studies, Polytechnic Institute of Viana do Castelo,
4930-678 Valen¸ca, Portugal
Abstract
The process of contagiousness spread modelling is well-known in epidemiology. However, the application of spread modelling to banking market is quite recent. In this work, we present a system of ordinary differential equations, simulating data from the largest European banks. Then, an optimal control problem is formulated in order to study the impact of a possible measure of the Central Bank in the economy. The proposed approach enables qualitative spec-ifications of contagion in banking obtainment and an adequate analysis and prognosis within the financial sector development and macroeconomic as a whole. We show that our model de-scribes well the reality of the largest European banks. Simulations were done using MATLAB and BOCOP optimal control solver, and the main results are taken for three distinct scenarios.
Keywords: banking risk, contagion spread, epidemic approach, optimal control.
1
Introduction
Mathematical models of spread of epidemics are widely used in different fields of studies and directly related to everyone’s life. They are well used in medicine for the purpose of studying an epidemiological process, analysis and forecasting outbreaks of such infections as influenza, cholera, HIV/AIDS, syphilis and others [7, 14, 19, 20]; in computer science, for studying the spread of computer viruses [6, 17]; in psychology, for studying how individuals could change their behaviour in response to others (for example, an applause, contagious yawning, the use of social networks such as MySpace, Facebook and others) [3, 15]; in marketing, for modelling a viral distribution of advertising [9, 22, 23]; in economics and finance, in order to study the financial crisis transmission, contagion in banking [5, 26, 29]; and even in science fiction, to describe the propagation of zombies attacks [13, 16, 21].
The economic field has gained a special spotlight in recent years. This is due to the global economic decline during the early 21st century. In terms of overall impact, it was the worst global downturn since Second World War, by the conclusions of the International Monetary Fund. The crisis touched every country and it has led to the financial sector’s collapse in the world economy, the effects of which can be seen and felt till today [2, 4, 8].
∗This work is part of first author’s Ph.D., which is carried out at University of Aveiro under the Doctoral
Program in Applied Mathematics MAP-PDMA, of Universities of Minho, Aveiro and Porto.
†This is a preprint of a paper whose final and definite form is in Operational Research, Springer Proceedings in
Mathematics & Statistics, available at [http://www.springer.com/series/10533]. Paper Submitted 23/March/17; Revised 29/May/17; Accepted 11/July/2017.
Several scientists, from all over the world, have proposed their theories about the development of the financial crisis and methods to prevent it. However, this topic has not been studied yet completely. Indeed, there is a lack of consensus among scientists, and financial crises continue to occur from time to time. These arguments support the importance, relevance and necessity to continue to study such phenomena.
This paper is focused on studies of contagion in banking market using an epidemiological approach through mathematical modelling. Initially, it is important to understand that the con-temporary economy is an open system, which is based on direct and inverse, vertical and horizontal linkages, and can be developed successfully only with effective management of these relations at both macro and micro levels [12].
Banks serve the needs of market participants, and constitute the horizontal linkages in the market environment. They do not just form their own resources, but also provide domestic accu-mulation of funds for the national economy development. Therefore, banks organize the monetary-lending process (moving money from lenders to borrowers) and issue banknotes. Banks are thus, constantly, faced with many risks in their activity. As an example, the credit risk (risk of not fulfilling liabilities to the credit institution by a third party) may occur during the loan or other equivalent actions, which are reflected on the balance sheet and could have the off-balance char-acter. The occurrence of this risk can cause infection and even bank failure. That could trigger the contagion of other banks and the emergence of a banking crisis.
The risk of contagion in the financial sector presents a serious threat for a country’s economy. Failure of one particular institution in the financial sector threatens the stability of many other institutions. This situation is called a systemic risk [10]. Moreover, the spread of one type of crisis is able to initiate the development of other types of crises as well. For example, the external debt crisis could undermine the stability of banks; problems in the banking sector can launch a debt crisis; and the banking crisis, in its turn, often precedes currency crisis. Thus, the risky lending and loan defaults, generally, precede crisis in banking [24]. Banking crises often are accompanied by panic among population. It usually happens when many banks suffer runs simultaneously, as people have suspicions and mistrust to banks, and they suddenly try to withdraw their money from bank accounts.
Banks are directly at the centre of the financial system and it is easy to understand that a crisis in banking is one of the most serious type of financial crisis. Therefore, it is very important to study how the crisis spreads in banking market, to find its basic laws and methods to control it. A good understanding of their propagation mechanism makes possible to find and propose suitable policy interventions, which can most effectively reduce their contagious spread. This is the main goal of our research. Namely, we show that the application of epidemiological models is able to describe well the nature and character of the contagion spread and its behaviour over time. Our analysis identifies which measures to adopt and when they must be taken in order to prevent effects and serious negative consequences for a particular bank, and for economy as a whole.
The paper is structured as follows. In Section 2, we introduce the main bank concepts into the epidemic model. Various scenarios of contagion and the results of simulations are presented in Section 3. An optimal control problem is then formulated in Section 4, where the control simulates the European Central Bank. In Section 5, the main conclusions are carried out.
2
The SIR mathematical model
The availability of interactions between banks in a financial system confirms the possibility of a contagion occurrence. Contagion, by definition, refers to the idea that any type of financial crisis may spread from one subject (financial institution) to another. As an example, if a large number of bank customers are withdrawing their funds, then it provokes a bank run that may spread from a few banks to many others within the country, or even spreading from one country to another. Currency crisis is one type of financial crisis, which also may spread from one country to another. Even sovereign defaults and stock market crashes spread across countries. Such processes of contagion in economy are very similar to the disease propagation in a population
(from one individual to another). This similarity allows us to consider contagion in such type of financial sectors, as banking, using the same mathematical models of infection spreading as used in epidemiology.
There are many kinds of epidemiological models of spread of infection, which differ in the different assumptions about the disease’s nature and character, about the structure of population that are under consideration, and others constraints in which the model is based. In our work, we assume that contagion can be transmitted from an infected bank to another one, which has not yet been infected, and after recovery the bank produces immunity for a long time. Our assumptions about the process of contagion spreading in the banking sector are very similar to the characteristics of many childhood diseases, including chickenpox, measles, rubella and others, after which a strong immunity is produced. In order to simulate an epidemiological process of such diseases, there is a well-known suitable model, called SIR, which was first introduced in the works of Kermack and McKendrick [11]. The model is named SIR for the reason that population is divided into three classes: class S of susceptible, those who are susceptible to the disease; class
I of infected, those who are ill/infected; class R of recovered, those who are recovered and have
become immune to the disease.
Mathematically, the SIR model is a multi-parameter system of ordinary differential equations, where each equation defines the current state of health of an investigated object. This model is relevant and frequently used in current research. Our work is also based on its application to the transmission of a contagious disease between banks. The model must be, however, adapted to the banking sector, in order to have a deeper understanding of how the process of infection transmission is carried out, and especially how banks, as financial institutions, become contagious. The earlier formulated rules of bank transitions from one condition to another lead to the following system of differential equations:
dS(t) dt = −βS(t)I(t), dI(t) dt = βS(t)I(t) − γI(t), dR(t) dt = γI(t), (1)
t ∈[0, T ], subject to the initial conditions
S(0) = S0, I(0) = I0, R(0) = R0. (2)
The first equation defines the number of banks that leave the group S by becoming a target of market speculation at time t; the second equation defines the number of contagious banks at time t; and the third equation defines the number of banks that have recovered from the crisis at time t, where t ∈ [0, T ], T > 0.
Model (1)–(2) depends on two parameters. Parameter β denotes the contagion spreading rate. It represents the strength of contagion, where a susceptible bank, that is in contact with a single infected bank, changes its state to infected with probability β. The second parameter, γ, denotes the speed of recovery. It represents the resistance to contagion. Therefore, an infected bank changes its state to recover with probability γ.
A susceptible bank from group S can obtain contagion if it has a relationship with a contagious bank from group I, and if it has not enough money in reserve to cover possible risk losses. In other words, the bank may be contaminated, if it has not enough strong “health” in order to resist an epidemic. According to the standard SIR methodology, we are assuming that all banks are similar, and both parameters β and γ are constant for the entire sample. However, in reality, these data are unique for each bank and depend on the force of contagion of the affected bank and the financial stability of the susceptible. Dynamics of the strength of banks is not taken into consideration in the present study.
It is assumed that N , the number of institutions during the period of time under study, is fixed throughout the contamination time (in our simulations, N = 169 — see Section 3). It means that
S(t) + I(t) + R(t) = N for all t ∈ [0, T ]. Moreover, we assume that the initial conditions (2) at the beginning of the period under study satisfy
S(0) ≫ I(0) > 0 and R(0) = 0. (3)
3
SIR model simulations with real data
The contagion and recovery propagation rates used in our paper, β and γ, follow the statistics and empirical findings of Philippas, Koutelidakis and Leontitsis [18]. The statistical data is taken, with respect to the year 2012, for the 169 largest European banks with total assets over than 10 bn Euro. The values of parameters β and γ were calculated in [18] by assuming that all banks of a country are infected; then, using Monte Carlo simulations, the parameters β and γ were tracked for each bank in a country; and aggregated in such a way they represent the average over simulations, with respect to the country in which the bank originates. Therefore, using the information that the total number of banking institutions (N ) is equal to 169, and assuming that only one bank is contagious at the initial time, the values of initial conditions for the SIR model were obtained: S(0) = 168, I(0) = 1, and R(0) = 0. The parameters β and γ are presented for each bank with respect to the country in which the bank originates.
In our work, in order to present contrast scenarios of contagion spreading among European banks, we have chosen three countries that have completely different values of parameters β and γ:
1. in the first scenario, the initially contagious bank is located in Portugal;
2. in the second scenario, the group I of infected consists only of a bank from Spain; 3. while in the third scenario the contamination begins from a United Kingdom’s bank. Such countries were chosen from [18]. However, it should be mentioned that our scenarios are different from those of [18]. Indeed, in [18] they begin with one or more random banks among three different levels of assets. In contrast, here we do not look to the assets level of the banks and, instead, we chose countries by their contagion and recovery rates, respectively β and γ. Moreover, in our cases all the three scenarios begin with exactly one random infected bank in the chosen country, while in [18] more than one is allowed.
Data of the contagion spreading rate and the speed of recovery for these three scenarios are shown in Figure 1 and the behaviour of the contagion risk model (1)–(2), during the same time scale of T = 100 days, is shown in Figure 2.
0 20 40 60 80 100 0 20 40 60 80 100 120 140 160 180 Time Banks Susceptible Infected Recovered (a) Portugal 0 20 40 60 80 100 0 20 40 60 80 100 120 140 160 180 Time Banks Susceptible Infected Recovered (b) Spain 0 20 40 60 80 100 0 20 40 60 80 100 120 140 160 180 Time Banks Susceptible Infected Recovered (c) UK
Figure 2: The SIR contagion risk model (1)–(2) with parameters β and γ as in Figure 1, S(0) = 168, I(0) = 1, R(0) = 0 and T = 100.
In the first scenario, contagion spreads rapidly. In a short span of time, contagion reaches its peak and then swiftly decreases. The recovery process takes fast. See Figure 2a. Regarding the second scenario, Figure 2b demonstrates that contamination occurs rapidly as in the first scenario. The contagion affects a large number of banks but the recovery process takes longer. In Figure 2c, we see what happens in the third scenario: the spread of contagion occurs in a longer period of time and, consequently, the recovery process goes slowly too. The graphs of Figure 2 show that the processes of contagion take place in different ways, depending on the country where it begins. Figure 2 also shows that, in case of the first scenario, contagion has almost reached the contagion-free equilibrium (I(T ) = 0) at the end of 100 days. However, T = 100 is not enough to reach the contagion-free equilibrium for the second and third scenarios. In those cases, it makes sense to increase the time. The results of such simulations are reflected in Figure 3.
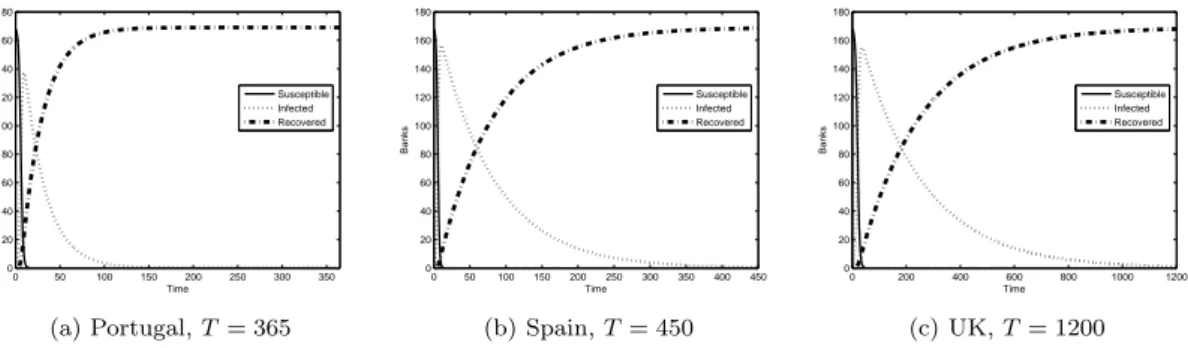
0 50 100 150 200 250 300 350 0 20 40 60 80 100 120 140 160 180 Time Banks Susceptible Infected Recovered (a) Portugal, T = 365 0 50 100 150 200 250 300 350 400 450 0 20 40 60 80 100 120 140 160 180 Time Banks Susceptible Infected Recovered (b) Spain, T = 450 0 200 400 600 800 1000 1200 0 20 40 60 80 100 120 140 160 180 Time Banks Susceptible Infected Recovered (c) UK, T = 1200
Figure 3: The SIR contagion risk model (1)–(2) with parameters β and γ as in Figure 1, S(0) = 168, I(0) = 1 and R(0) = 0: illustration of the time needed to achieve the contagion-free equilibrium.
As seen from Figure 3a, in case of bank contagion starting in Portugal, less than in half a year the contagion spreading stops. Figure 3b demonstrates that a spreading of contagion starting in Spain will only stop after a full year. The third scenario is the most severe: the contagion will disappear and the banks will be recovered only after three years (see Figure 3c).
The reason behind the differences found, for the three scenarios considered, rely in the different economic relevance, in the global banking market, of the countries where contagion begins. So, if one of the large and important banks of United Kingdom will be the starting point in the spread of contagion, then the global banking market will experience serious problems, the negative effects of which will continue during a long period of time. In other words, United Kingdom is one of the main financial markets to have into account at European level. On the other hand, Portugal has a less powerful and influential economy on an European scale.
4
Optimal control
Given the horizontal linkages in market environment, all banks are equally needed to be under financial supervision. Such supervision is necessary in order to prevent global contamination and avoid serious consequences due to spread of contagion between banks. This partially explains why the Central European Bank exists. The Central Bank is a supervisory competent authority that implements vertical connections among interacting commercial banks. Since one of the main goals is to avoid the wide dissemination of a contagion, we pose the following optimal control problem:
min J [I(·), u(·)] = I(T ) +
T
Z
0
bu2
(t)dt −→ min (4)
subject to the control system dS(t) dt = −βS(t)I(t), dI(t)
dt = βS(t)I(t) − γI(t) − u(t)I(t),
dR(t)
dt = γI(t) + u(t)I(t),
(5)
where S(0) = S0, I(0) = I0, R(0) = R0, satisfying (3), and the weight b > 0, are fixed. In our
simulations, the initial values of the state variables are given as discussed in Section 3, while the weight b, associated with the cost of control measures, is taken to be 1.5, motivated by the value of possible recapitalization with state funds considered in [18]. The first term of the objective functional (4) reflects the fact that the control organization should take care about the number of contagious institutions I(T ) at the final time T . The integral represents the general cost of financial assistance necessary to prevent the spread of contagion and economic decline in the period [0, T ]. The control u(·) is a Lebesgue function with values in the compact set [0, 1]: 0 ≤ u(t) ≤ 1, with u(t) denoting the rate at which assistance will be provided to contagious banks, that is, it is the ratio between the financial support from the Central Bank at time t and the financial needed by the banks at that time. In this way, u(t) = 1 means full support from the Central Bank at time
t (all money needed by the banks is being covered by Central Bank), while u(t) = 0 means no
financial lending or recapitalization from the Central Bank at time t.
In order to use the BOCOP optimal control solver [1, 25], the optimal control problem in Bolza form (4)–(5) is rewritten in the following equivalent Mayer form:
min J [S(·), R(·), Y (·)] = N − S(T ) − R(T ) + Y (T ) −→ min (6) subject to dS(t) dt = βS 2 (t) + βS(t)(R(t) − N ), dR(t) dt = γ(N − S(t) − R(t)) + u(t)(N − S(t) − R(t)), dY(t) dt = bu 2 (t), S(0) = S0, R(0) = 0, Y(0) = 0, u(t) ∈ [0, 1]. (7)
The optimal control problem (6)–(7) is approximated by BOCOP into a nonlinear programming problem (NLP) using a standard time discretization. The NLP problem is then solved by the open-source Ipopt optimization solver [27], using sparse exact derivatives computed by the Adol-C (Automatic Differentiation by OverLoading in C++) package [28]. Figures 4, 5 and 6 show the
results of simulations of our SIR bank contagion risk model, with and without optimal control, for a period of 30 days (T = 30) for the first, second and third scenarios of Section 3, respectively.
Figure 4a shows that if we have no interest to stop contagiousness or just do not want to spend any money on it, that is, u(t) ≡ 0, then, in case of the first scenario, the number of contagious banks at final time T = 30 will be equal to 64. If the control u(t) is chosen as the solution of our optimal control problem, then in one month the number of contagious banks will become smaller than J = 2, see Figure 4b.
0 5 10 15 20 25 30 0 20 40 60 80 100 120 140 160 180 Time Banks Susceptible Infected Recovered
(a) without control
0 5 10 15 20 25 30 0 20 40 60 80 100 120 140 160 180 Time Banks Susceptible Infected Recovered
(b) with optimal control
0 5 10 15 20 25 30 0 0.05 0.1 0.15 0.2 0.25 Time Control Control
(c) the extremal control u(t)
Figure 4: Contagion risk from Portugal (Scenario 1) with and without optimal control. In case of the second scenario, Figure 5a shows that the number of contagious without control is equal to 124. In contrast, the number of contagious banks at time T = 30 using optimal control, taking into account the costs associated with the control interventions during all the period [0, 30], is equal to 2 (see Figure 5b). On the other hand, after one month, the number of banks that already recovered from the risks are less than fifty without control; while with optimal control measures this number is almost double.
0 5 10 15 20 25 30 0 20 40 60 80 100 120 140 160 180 Time Banks Susceptible Infected Recovered
(a) without control
0 5 10 15 20 25 30 0 20 40 60 80 100 120 140 160 180 Time Banks Susceptible Infected Recovered
(b) with optimal control
0 5 10 15 20 25 30 0 0.05 0.1 0.15 0.2 0.25 Time Control Control
(c) the extremal control u(t)
Figure 5: Contagion risk from Spain (Scenario 2) with and without control.
Finally, when the contagion begins from United Kingdom (third scenario), the number of contagious banks at final time T = 30 is 149 without control (Figure 6a) with that number decreasing to less than 4 when the Central Bank applies optimal control (see Figure 6b).
The results of the three scenarios just reported, with respect to the value of the cost functional
J, are summarized in Table 1 for a better comparison.
Table 1: Values of the cost functional J (4).
Scenario # no control measures with optimal control
Scenario 1(bank contagion starting in Portugal) 64 2
Scenario 2(bank contagion starting in Spain) 124 2
0 5 10 15 20 25 30 0 20 40 60 80 100 120 140 160 180 Time Banks Susceptible Infected Recovered
(a) without control
0 5 10 15 20 25 30 0 20 40 60 80 100 120 140 160 180 Time Banks Susceptible Infected Recovered
(b) with optimal control
0 5 10 15 20 25 30 0 0.05 0.1 0.15 0.2 0.25 Time Control Control
(c) the extremal control u(t)
Figure 6: Contagion risk from UK (Scenario 3) with and without control.
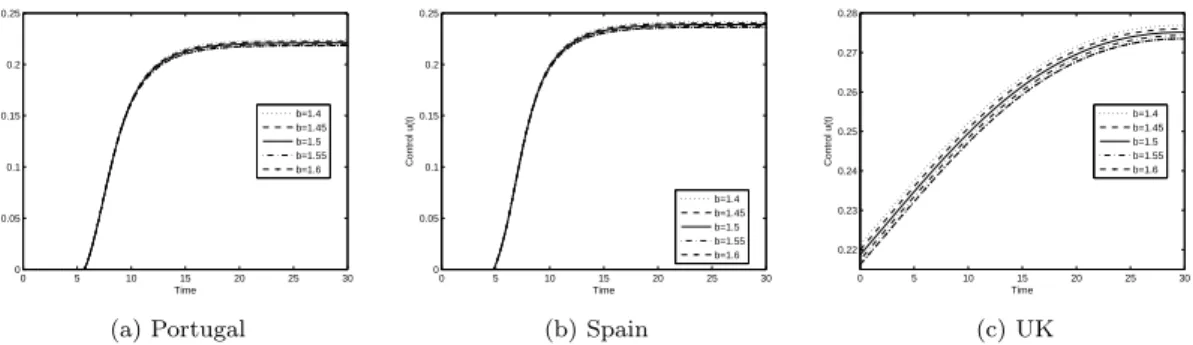
It is worth to mention that the qualitative results of the paper do not change with the particular choice of the weight b: the extremal curves change continuously with the change of parameter b. For illustrative purposes, we show in Figure 7 the optimal control u(t), t ∈ [0, 30] days, for different values of the weight b. We see that an increase of the value of the parameter b corresponds to a decrease of the control u, meaning that the financial support from the Central Bank diminishes when we penalize the use of the control by increasing the value of b. The role of parameter b is more visible in Scenario 3 than in Scenarios 1 and 2.
0 5 10 15 20 25 30 0 0.05 0.1 0.15 0.2 0.25 Time Control u(t) b=1.4 b=1.45 b=1.5 b=1.55 b=1.6 (a) Portugal 0 5 10 15 20 25 30 0 0.05 0.1 0.15 0.2 0.25 Time Control u(t) b=1.4 b=1.45 b=1.5 b=1.55 b=1.6 (b) Spain 0 5 10 15 20 25 30 0.22 0.23 0.24 0.25 0.26 0.27 0.28 Time Control u(t) b=1.4 b=1.45 b=1.5 b=1.55 b=1.6 (c) UK
Figure 7: The optimal control u(t) for different values of the weight b.
5
Conclusions
We investigated the dynamic behaviour of contagiousness in the banking sector, at the macroe-conomic level, using a SIR epidemic model and optimal control. The features of contamination were shown to depend on the parameter values of the transmission and recovery rates, as well as on the country for which the process of infection begins. The scale of negative consequences for three different scenarios of bank risk contagion were identified. Banks at risk from countries with greater financial influence in Europe tend to propagate more severely the banking crisis; at the same time, the recovery period is longer. An optimal control problem was proposed, in order to reduce the number of contagious banks, to prevent large-scale epidemic contagiousness, and to avoid serious financial and economic consequences.
Acknowledgements
This research was supported in part by the Portuguese Foundation for Science and Technology
De-velopment in Mathematics and Applications, within project UID/MAT/04106/2013. Kostylenko is also supported by the Ph.D. fellowship PD/BD/114188/2016.
We are very grateful to the authors of [18] for providing us the parameter values that they have obtained in their work; and to two anonymous referees for valuable remarks and comments, which significantly contributed to the quality of the paper.
References
[1] Bonnans F., Martinon P., Giorgi D., Grelard V., Maindrault S., Tissot O.: BOCOP 2.0.4 User Guide. Inria-Saclay (2015).
[2] Caballero R.J.: On the macroeconomics of asset shortages. NBER Working Paper (2006) no. 12753.
[3] Cannarella J, Spechler J. A.: Epidemiological modeling of online social network dynamics (2014) (preprint).
[4] Davis B.: What’s a Global Recession? The Wall Street Journal (2013).
[5] Garas A., Argyrakis P., Rozenblat C., Tomassini M., Havlin S.: Worldwide spreading of economic crisis. New Journal of Physics 12 (2010), 113043.
[6] Han X., Tan Q.: Dynamical behavior of computer virus on Internet. Applied Mathematics and Computation 217 (2010), 2520–2526.
[7] Hooten M.B., Anderson J., Waller L.A.: Assessing North American influenza dynamics with a statistical SIRS model. Spat Spatiotemporal Epidemiol. 1 (2010), no. 2-3, 177–185. [8] International Monetary Fund: World Economic Outlook: Crisis and Recovery. World
Eco-nomic and Financial Surveys (2009).
[9] Kandhway Kundan, Kuri Joy: How to run a campaign: Optimal control of SIS and SIR information epidemics. Applied Mathematics and Computation 231 (2014), 79–92.
[10] Kaufman G.G., Scott K.E.: What is systemic risk, and do bank regulators retard or contribute to it? The Independent Review 7 (2003), no. 3, 371–391.
[11] Kermack W.O., McKendrick A.G.: A contribution to the mathematical theory of epidemics. The Royal Society of London A 115 (1927), no. 772, 700–721.
[12] Kostylenko O.O., Nazarenko O.M.: Modelling and identification of macroeconomic system dynamic interindustry balance. Mechanism of Economic Regulation 1 (2014), no. 63, 76–86. [13] Langtangen H. P., Mardal K.A., Rotnes P.: Escaping the zombie threat by mathematics. In: Zombies in the Academy - Living Death in Higher Education Chicago: University of Chicago Press (2013).
[14] Li D., Ma W.: Asymptotic properties of a HIV-1 infection model with time delay. Journal of Mathematical Analysis and Applications 335 (2007), no. 1, 683–691.
[15] Mann R.P., Faria J., Sumpter D.J.T., Krause J.: The dynamics of audience applause. Journal of the Royal Society Interface 10 (2013) no. 85, 20130466.
[16] Munz P., Hudea I., Imad J., Smith R.: When zombies attack!: Mathematical modelling of an outbreak of zombie infection. In: Tchuenche, J.M., Chiyaka, C. (eds.) Infectious Disease Modelling Research Progress Nova Science Publishers (2009), 133–150.
[17] Ozturka Y., Gulsub M.: Numerical solution of a modified epidemiological model for computer viruses. Applied Mathematical Modelling 39 (2015), no. 23-24, 7600–7610.
[18] Philippas D., Koutelidakis Y., Leontitsis A.: Insights into European interbank network con-tagion. Managerial Finance 41 (2015), no. 8, 754–772.
[19] Rachah A., Torres D.F.M.: Modeling, dynamics and optimal control of Ebola virus spread. Pure and Applied Functional Analysis 1 (2016), no. 2, 277–289. arXiv:1603.05794
[20] Rachah A., Torres D.F.M.: Optimal control strategies for the spread of Ebola in West Africa. J. Math. Anal. 7 (2016), no. 1, 102–114. arXiv:1512.03395
[21] Rodrigues H.S.: Application of SIR epidemiological model: new trends. International Journal of Applied Mathematics and Informatics 10 (2016), 92–97.
[22] Rodrigues H.S., Fonseca M.J.: Viral Marketing as epidemiological model. Proceedings of the 15th International Conference on Computational and Mathematical Methods in Science and Engineering (2015), 946–955.
[23] Rodrigues H.S., Fonseca M.J.: Can information be spread as a virus? Viral marketing as epidemiological model. Mathematical Methods in the Applied Sciences 39 (2016), 4780–4786. [24] Simkovic M.: Competition and crisis in mortgage securitization. Indiana Law Journal 88
(2013), no. 1, 213–217.
[25] Team Commands, Inria Saclay. BOCOP: an open source toolbox for optimal control,
http://bocop.org(2017).
[26] Toivanen M.: Contagion in the interbank network: an epidemiological approach. Bank of Finland Research Discussion Paper (2013) no. 19.
[27] W¨achter A., Biegler L.T.: On the implementation of an interior-point filter line-search al-gorithm for large-scale nonlinear programming. Math. Program. 106 (2006), no. 1, Ser. A, 25–57.
[28] Walther A., Griewank A.: Getting started with ADOL-C. In: U. Naumann and O. Schenk, Combinatorial Scientific Computing, Chapman-Hall CRC Computational Science, pp. 181– 202 (2012).
[29] Wu Y.: Reputation risk contagion and control of rural banks in China based on epidemic model. Computer Modelling & New Technologies 18 (2014) no. 7, 229–235.
![Figure 1: Summary statistics for β and γ based on the data of [18].](https://thumb-eu.123doks.com/thumbv2/123dok_br/15852251.1085738/4.892.233.672.835.1095/figure-summary-statistics-β-γ-based-data.webp)