D
OES ENTREPRENEURSHIP CONVEY HIGHER LEVELS OF HAPPINESS?
A
N ANALYSIS BY TYPE OF ENTREPRENEURSHIP AND NATIONAL CULTURESRayanne Vasque Gonçalves
Dissertation
Master in Management
Supervised by
Aurora A. C. Teixeira
Bio
Rayanne Vasque was born in Brazil on March 19th, 1992. She graduated in International Relations from the Escola Superior de Propaganda e Marketing do Rio de Janeiro. Since 2015 has decided to change its area of operation in the market and to enter a new journey in the fashion market. With that, she undertook a post-graduate degree in Fashion Marketing, allowing her to have the opportunity to work in a big Brazilian brand of fashion retail, called Farm being his position Outsourcing and Cobranding Analyst. Since July 2017 she has held the cargo of Buyer Trainee at Parfois. She loves to travel and to know new cultures and her subjects of interest are, quality of life, sustainability and equality matters.
Acknowledgments
I thank all the people who supported me in carrying out this work, especially Professor Aurora A. C. Teixeira, who assisted me in the conduction of this project, providing the necessary support to prepare the report, always being available and interested in my ideas. Raphael de Figueiredo, who had a lot of patience and gave me all the support, to achieve my goals. To all my family and friends present in my life who have somehow contributed to my achieving this goal. Thank you above all my mother and grandmother, those who believed me the most and always motivated me to follow my dreams even if they seemed impossible.
Abstract
Entrepreneurship became the key factor in many countries to promote economic growth and reduce poverty rates, through the creation of new businesses.
Considerable research has been made in the entrepreneurship area. However, few studies so far have explored the impact of entrepreneurship and entrepreneurship types (opportunity vs necessity) on individuals’ life satisfaction/ happiness. Those few studies have not yet analyse the extent to which the impact of entrepreneurship and entrepreneurship types is intermediated by ‘national cultures’.
Based on the literature and in a broader set of contexts/countries, the present study was conducted using the latest (2016) World Value Survey (WVS) dataset, encompassing 90350 individuals from 60 countries over the period of 2010-2013 (6th wave), combined with information provided by the GLOBE Framework on cultural measures, which enabled to categorize the distinct countries into ten ‘culture clusters’ (Eastern Europe; Middle East; Confucian Asia; Southern Asia; Latin America; Nordic Europe; Anglo; Germanic Europe; Latin Europe and Sub-Sahara Africa).
Resorting to fixed effect panel data techniques, and controlling for a set of factors that are likely to affect happiness (education, gender, age, and ‘culture’), we found considering the whole set of countries in analysis that being an entrepreneur (i.e., self-employed) increases the chances of happiness; our results further suggest that being an opportunity entrepreneur is associated with higher levels of happiness. Finally, when considering the distinct ‘clusters of culture’ in separate, results clearly evidence that culture does matter in the sense that the impact of entrepreneurship (and entrepreneurship types) on happiness varies, being positive for Sub-Sahara Africa and Eastern Europe and negative for Middle East culture clusters.
Resumo
O empreendedorismo tornou-se o fator chave em muitos países para promover o crescimento económico e reduzir as taxas de pobreza, através da criação de novos negócios. Existe já uma investigação considerável na área de empreendedorismo. No entanto, poucos estudos até à data exploraram o impacto do empreendedorismo e seus tipos (oportunidade versus necessidade) na satisfação com a vida / felicidade dos indivíduos. Esses poucos estudos não analisam ainda em que medida o impacto do empreendedorismo e seus tipos são mediados pela ‘cultura’.
Com base na literatura e considerando um conjunto mais amplo de contextos / países, o presente estudo foi conduzido usando o mais recente (2016) conjunto de dados da World Value Survey (WVS), abrangendo 90350 indivíduos de 60 países, no período de 2010-2013 (6ª onda), combinado com informações fornecidas pela ferramenta GLOBE sobre medidas culturais, que permitiram categorizar os países distintos em dez 'clusters culturais' (Europa Oriental; Oriente Médio; Ásia Confucionista; Sul da Ásia; América Latina; Europa Nórdica; Anglo; Europa Germânica; Europa Latina e África Subsaariana).
Recorrendo a técnicas de dados de painel de efeitos fixos e controlando para conjunto de fatores que tendem a afetar a felicidade dos indivíduos (e.g., educação, género, idade e 'cultura'), constatamos, para o conjunto de países na análise, que ser um empreendedor aumenta as chances de felicidade. Os nossos resultados sugerem ainda que ser um empreendedor de oportunidades está associado a níveis mais elevados de felicidade. Finalmente, ao considerar os distintos 'clusters culturais' em separado, os resultados evidenciam claramente que a cultura é importante no sentido de que o impacto do empreendedorismo (e tipos de empreendedorismo) na felicidade é variável de cultura para cultura, sendo positivo para os clsuters de cultura da África Subsaariana e Europa Oriental e negativo para Médio Leste.
Index of contents Bio ... i Acknowledgments ... ii Abstract ...iii Resumo ... iv Index of tables ... vi
Index of Figures ... vii
1. Introduction ...1
2. Literature review on entrepreneurship and happiness ...3
2.1. Main concepts ...3
2.1.1. Entrepreneurship and types of entrepreneurship ...3
2.1.2. Happiness, life satisfaction and well-being ...5
2.2. Entrepreneurship, happiness and culture: a literature review ...6
2.2.1. Entrepreneurs, non-entrepreneurs and happiness: key explanatory mechanisms ...6
2.2.2. Entrepreneurs happiness across cultures ...7
2.2.3 Empirical studies relating happiness/ well-being, entrepreneurship, and culture: main hypotheses to be tested ...9
3. Methodology ... 12
3.1. Main hypotheses, method of analysis and the corresponding econometric specification... 12
3.2. Selection of the estimation technique ... 15
3.3. Data source and variable proxies ... 16
4. Empirical results ... 21
4.1. Description of the sample... 21
4.2. Estimation results ... 25
4.2.1. Initial considerations ... 25
4.2.2. Total entrepreneurship and happiness ... 26
4.2.3. Types of entrepreneurship and happiness ... 28
5. Conclusion ... 33
References ... 36
Index of tables
Table 1. Summary table on the definition of entrepreneurship ...4
Table 2. Summary table on the definition of Happiness ...5
Table 3. Relation between (types of) entrepreneurs and happiness/well-being/satisfaction ... 11
Table 4. Methodologies of some of the studies reviewed ... 13
Table 5:Countries divided according to the GLOBE Framework and Hofstede ... 17
Table 5. Description of the relevant variables and proxies... 20
Table 7. Happiness (lato sensu: very happy and very good health) and entrepreneurship: logistic estimations ... 29
Table 8. Happiness (stricto sense: very happy) and entrepreneurship: logistic estimations ... 30
Table 9. Happiness and types of entrepreneurship: logistic estimations ... 32
Table A 1: Correlation matrix HAP LATO ... 41
Table A 2: Correlation matrix HAP STRICT ... 42
Table A 3: List of Countries in the Entrepreneur analysis (Hap Lato and Hap Stricto) ... 43
Index of figures
Figure 1. Countries categorized according to the GLOBE Framework and Hofstede ... 18 Figure 2. Average comparison between happiness (lato sensu: very happy and very good health),
entrepreneur and non-entrepreneur in each cluster ... 22 Figure 3. Average comparison between happiness (stricto sense: very happy), entrepreneur and
non-entrepreneur in each cluster ... 23 Figure 4. Average comparison between happiness (lato sensu: very happy and very good health),
opportunity entrepreneur, necessity entrepreneur and non-entrepreneur in each cluster 24 Figure 5. Average comparison between happiness (stricto sense: very happy), opportunity
1. Introduction
A major point for many economies in their growth strategies is to generate or facilitate processes that promote new firms, new and better jobs and, in this way, reduce poverty rates (Figueroa-Armijos & Johnson, 2016). Countries around the world have implemented policies to promote entrepreneurship, seeing this latter as a platform for sustainable economic growth (Feki & Mnif, 2016). Indeed, as Åstebro (2017, p. 323) contents "policy makers have embraced entrepreneurship as the opportunity to create new jobs", elevating it as one of their main endeavors. As such, there is increased acknowledgment of the importance and the role played by the new businesses in the economy, reflecting the assumption that it is likely that reduced business activity will lead to reduced economic growth (Figueroa-Armijos & Johnson, 2016).
The entrepreneur is an individual who perceive good opportunities for starting a business and believe that he / she has the necessary competence (GEM, 2017). In a more encompassing perspective, Morris, Pryor, Schindehutte, and Kuratko (2012) summarize some fundamental motives for people to engage in entrepreneurship; these include survival, income generation, wealth, independence, accomplish a dream, improving aspects in the local society, and changing the world. To some extent, such motives seems to indicate that entrepreneurship might be related to higher levels of happiness, satisfaction with life or increased well-being (Morris et al., 2012).
Although there is a vast amount of studies that focus on entrepreneurship - we found 14034 documents in Scopus bibliographic database that have entrepreneurship as keyword -,1 studies that relate entrepreneurship and individuals’ happiness or well-being are in much lower number. Indeed, search in Scopus crossing ‘entrepreneurship’ with ‘happiness’ or ‘well-being’ or ‘life satisfaction’ resulted in only 25 articles. Among these latter articles stand that of Binder and Coad (2013) which focus on two groups of UK entrepreneurs, the ‘opportunity’ and ‘necessity’ entrepreneurs, that is, respectively individuals who start business because they saw an opportunity for a business, and those who move to self-employment because of unemployment and not being able to find a job. Binder & Coad (2013) analyze around 8000 individuals per year over the period of 1996 until 2006 and concluded that the opportunity entrepreneurs evidence high life satisfaction, whereas the necessity entrepreneurs are not happy with being self-employment. Summing up, the relation between entrepreneurship and life satisfaction/happiness is ambiguous.
We aim to complement Binder & Coad’s (2013) contribution by analysing how (the type of) entrepreneurship impact on happiness and life satisfaction in a wider set of contexts/countries. Additionally, we aim at testing whether the relationship between (types of) entrepreneurship and life satisfaction/ happiness is intermediated by national culture by resorting to the GLOBE Framework (GLOBE, 2014; House., 2004) an extension of the Hofstede’s study (Hofstede, 2016) about cultural measures.
The main research questions of the present dissertation are:
Do entrepreneurs evidence higher levels of life satisfaction/ happiness than non-entrepreneurs?
Do opportunity entrepreneurs evidence higher levels of life satisfaction/happiness than necessity entrepreneurs?
Is the impact of (type of) entrepreneurship on life satisfaction/happiness intermediated by ‘national cultures’?
The present study is relevant because it brings knowledge to a yet overlooked question – the extent to which entrepreneurship and entrepreneurship types impact on individuals’ happiness/ life satisfaction across nations and distinct ‘national cultures’.
Methodologically, we resort to logistics regressions based on data from the World Values Survey 2016, reported to the period 2010-2013, which comprises 90350 individuals from 60 countries.
The dissertation is structured as follows. The next section analyses the relevant literature by clarifying the key concepts, providing a notion about the happiness / well-being of the entrepreneur and non-entrepreneur, with a special focus on the differences between countries and cultures. Section 3 presents a brief description of the methodology and procedures for data collection. In Section 4 the empirical results are described and discussed. Finally, Section 5 concludes the dissertation highlighting the main contributions of the present study, policy implications, limitations and paths for future research.
2. Literature review on entrepreneurship and happiness 2.1. Main concepts
2.1.1. Entrepreneurship and types of entrepreneurship
We can find in the literature a multitude of definitions of entrepreneurship and entrepreneurs (see Table 1). For instance, Xu and Xiao (2014, p. 1483) establish that “entrepreneurship [is] the identification and exploitation of previously unexploited opportunities …in which new goods, services, raw materials and organizing methods can be introduced and sold at greater than their cost of production.”. In this line, entrepreneurs are those individuals who seek to develop some value through the creation or enlargement of an economic activity, detecting and analysing new means of processes, products or markets, to generate economic growth (Lackéus, 2017; Sihombing, Pramono, Zulganef, & Ismanto, 2016). More recently, Lackéus (2017) reinforces the idea that entrepreneurship is the creation of new business, more precisely, the capability to creating new independent investments.
There are several types of entrepreneurs (Lackéus, 2017): those who discovery and exploit new opportunities, but are focused on competition, search for power, freedom and money; and those who discovery and exploit new opportunities, being aligned with the values of the community and focused on undertaking for the collective, creating significant actions creation for the benefit of others. In this context, "entrepreneurship involves bringing about change to achieve some benefit. This benefit may be financial but it also involves the satisfaction of knowing you have changed something for the better” (Chew, Hoe, Kim, & Kiaw, 2016, p. 716).
For some (e.g.,Naudé, Amorós, & Cristi, 2014), entrepreneurship involves a person who is a self- employed business owner, searching for autonomy and independence , whereas to others (e.g.,Zhang & Yang, 2010) entrepreneurship usually focuses on the development of internal processes, which is a source of competitive advantage.
According to the Global Entrepreneurship Monitor (GEM), one can identify four types of entrepreneurship (GEM, 2017, p. 18): 1) ‘Early stage entrepreneurial activity associated with small business’, which involves a person who is on the process of starting a new business; 2) ‘Early stage entrepreneurial activity associated with established business’ or ‘Start up Entrepreneurship’, that involves a person who has paid salaries, or any other payments, focusing on highly innovated products; 3) ‘Entrepreneurial employee activity’, which involves a person who when in the state of employee has launched new products, services or set up a new establishment and ‘large company entrepreneurship’ that most grow through
sustaining innovation, offering new products; and 4) ‘Social entrepreneurial activity’, which encompasses an innovate business whose focus is on creating products or services that has as ultimate goal solve social needs and problems.
Table 1. Summary table on the definition of entrepreneurship
Entrepreneurship Definition Explanation Authors Self-employment
Entrepreneurship as self-employment, implies a career choice; it comprises a self- employed business owner searching for autonomy and independence.
(Ali, 2014; Binder & Coad, 2013; Naudé et al., 2014; Zampetakis, Kafetsios, Lerakis, & Moustakis,
2017)
Creation of a new business
Is recognized as the capability to create new and independent business. That is, creating new business models,
innovations, new products and services, new job opportunities that can create value.
(Åstebro, 2017; Figueroa-Armijos & Johnson, 2016; Lackéus, 2017; Nataraajan & Angur, 2014; Zhang & Yang,
2010)
Identification of an unexploited opportunity to generate
economic growth
Entrepreneurship is understood as the act of formation that requires the effectiveness of recognizing an
opportunity. With this, entrepreneurship generate value through the creation or expansion of economic activity, identifying and exploring new products and services of innovation to the market.
(Chew et al., 2016; Schumpeter, 2008; Sihombing et al., 2016; Xu
& Xiao, 2014)
Source: Own elaboration.
All the above mentioned definitions share some common points namely that of defining “entrepreneurial activity as the enterprising human action in pursuit of the generation of some value, through the creation or expansion of economic activity, by identifying and exploiting new products, processes or markets.” (Chew et al., 2016, p. 716).
Additionally, the literature also refers to two main types of entrepreneurs (Angulo-Guerrero, Pérez-Moreno, & Abad-Guerrero, 2017; Binder & Coad, 2013): the opportunity and necessity entrepreneurs. The first type is the entrepreneur who understands and identifies an business opportunity, whereas the second type became a business owner or a self-employee because of the lack of better work opportunities (Fuentelsaz, González, Maícas, & Montero, 2015). Although both types indicate new entrepreneurial activities, they are likely to affect economic growth in different ways, and evidence different profiles in what concerns individuals’ expectations (GEM, 2017).
It is generally accepted that ‘opportunity entrepreneurs’ tend to have more economic freedom and the business associated responds to an economic opportunity which generates flexibility, high rewards, and high levels of satisfaction (Fuentelsaz et al., 2015). In contrast, ‘necessity entrepreneurs’ move to self-employment usually due to unemployment spells and impossibility of finding a job in the structured sector of the economy; as such, they tend to have little economic power, and be less satisfied (Angulo-Guerrero et al., 2017; Fuentelsaz et al., 2015).
2.1.2. Happiness, life satisfaction and well-being
Happiness interacts in important ways with the economic reality; therefore, to understand the link between happiness and economic variables may have significant implications for the economy (Pirinsky, 2013).
The study of happiness is considered so precious and indisputable today that, as an emblematic example, we can cite the US Declaration of Independence, which establishes that “every [person] has the inalienable right to life, liberty, and the pursuit of happiness” (Lunt, 2004, p. 93).
There are many definitions of happiness, and most of them mention a positive emotional state, with feelings of well-being and pleasure (Ali, 2014; Coelho do Vale, 2016; Lackéus, 2017; Naudé et al., 2014).
According to the study from “Observatório da Sociedade Portuguesa – Católica Lisbon” (Coelho do Vale, 2016), happiness consists in the state of being happy, a state of contentment and well-being that depends on several biopsychosocial and environmental factors. It is a state of satisfaction in which a person feels happy, fulfilled, and usually without suffering. Happiness is therefore associated with a wide range of positive emotions and feelings. The literature generally considers as synonymous of happiness, terms such as life satisfaction and well-being (see Table 2).
For some studies (e.g.,Ali, 2014; Sihombing et al., 2016), happiness is purely reflected to the state of being happy. Happy people are more confident and are willing to face the unknown to achieve goals (Ali, 2014, p. 3). Complementary, Naudé et al. (2014, p. 525) establish that happiness can be defined as ‘‘the degree to which an individual judges the overall quality of his or her life as favorable’’. Earlier, Layard (2003, in Naudé et al. (2014, p. 526)) concluded that the “drivers of happiness are found at the personal (genetic) level, at the level of society and environment, and at the level of the daily life choices.”
Table 2. Summary table on the definition of Happiness
Happiness Definition Explanation Authors Happiness Happiness is purely reflected to the state of being happy. Happy people are more confident and are
willing to face the unknown to achieve goals
(Ali, 2014; Sihombing et al., 2016)
Well- being quality of his or her life as favorable and is associated Is the degree to which an individual judge the overall with a wide range of emotions and feelings.
(Coelho do Vale, 2016; Dijkhuizen, Gorgievski, van Veldhoven, & Schalk, 2017; Fox, 2016; Nataraajan
& Angur, 2014; Naudé et al., 2014)
Life Satisfaction or Quality of Life
Is the search for improving the daily life the common construct knowing by “quality of life,”
stated that consist the objective human needs.
(Andersson, 2008; Binder & Coad, 2013; Lackéus, 2017) Source: Own elaboration.
It is likely that what constitutes the good and the beneficial varies across cultures. Indeed, Inglehart, & Klingemann (2000) comparisons made among large population samples from different countries demonstrated robust and stable differences in levels of happiness, motivations and what factors might envision happiness.
Evidence shows that wealthier nations tend to report higher levels of happiness compared to poorer nations (R. Inglehart, & Klingemann, H.-D, 2000; Mahadea & Ramroop, 2015; Morrison, Tay, & Diener, 2011). In general, individuals living in the richest regions of the globe (e.g., North America, Australia, Western Europe and Japan) report higher happiness scores than those living in poorer regions (e.g., Africa and Asia). But we also need to contemplate that happiness varies from place to place taking into consideration the cultures’ happiness, where in some places tends to be defined and experienced as personal achievement, while in others tends to be defined and experienced as a realization of social harmony (Oishi, Graham, Kesebir, & Galinha, 2013; Uchida, 2004).
In conclusion, we can state that happiness is a predominantly subjective phenomenon, being subordinated more to psychological and sociocultural traits than to external factors (Naudé et al., 2014).
2.2. Entrepreneurship, happiness and culture: a literature review
2.2.1. Entrepreneurs, non-entrepreneurs and happiness: key explanatory mechanisms
The relationship between happiness, well-being and work has been validated in numerous studies (Marques, 2017; Pryce-Jones & Lindsay, 2014; Rodríguez-Muñoz & Sanz-Vergel, 2013). In contrast, empirical evidence regarding the link between happiness or well-being and entrepreneurship is rarely explored and is focusses mainly on a specific country or culture. Notwithstanding, in the last few years there is a growing interest among researchers in understanding the differences between entrepreneurs and employees in relation to how they feel about their work and their degree of happiness.
A persistent result found is that self-employed/entrepreneurs are more satisfied with their professional status than employees (Andersson, 2008; Dijkhuizen, Veldhoven, & Schalk, 2016). Douglas and Shepherd (2014) compare employees with self-employed, and argue that an individual choose to be self-employed when the total benefit of what he/she expects (through profit, independence, risk, work effort, and other benefits associated with
self-employment) is higher than the expected value from his/her best employment option. Self-employed individuals obtain satisfaction from leading an independent lifestyle (Binder et al., 2013). The importance of independence is corroborated by Douglas and Shepherd (2014, p. 16) who found that “95% of respondents considered the level of independence in their assessment of career utility, while 47%, 26% and 16% used work, risk and income (respectively) as a significant determinant of the utility they expected to derive from the job offer.".
When compared with employees, entrepreneurs have high score on three of the four types of affective well-being (Dijkhuizen et al., 2016): work engagement, job satisfaction and higher exhaustion. Thus, although being self-employed gives a pleasant feeling of running one own business, it also “means coping with uncertainty about future income, coping with responsibility, making decisions and taking risks” (Dijkhuizen et al., 2016, p. 201).
In a nutshell, self-employment is something highly valued by individuals for the autonomy (Binder and Coad, 2013), and has been shown to be related to individuals’ higher satisfaction, happiness or well-being (Morris et al., 2012).
Besides comparing entrepreneurs with employees (non-entrepreneurs), Binder and Coad (2013) assessed the degree of happiness among distinct types of entrepreneurs, namely the necessity (individuals who move to self-employment because of unemployment and not being able to find a job) and the opportunity (individuals who start business because they saw an opportunity for a business) entrepreneurs. Specifically, Binder and Coad (2013), focusing on UK ‘opportunity’ and ‘necessity’ entrepreneurs, concluded that the opportunity entrepreneurs evidence higher life satisfaction, whereas the necessity entrepreneurs are not happy with being self-employment.
Summing up, albeit the evidence is scarce (only one study, focusing on the UK), the relation between entrepreneurship and life satisfaction/happiness seems to be ambiguous, depending among others on the type of entrepreneurship (opportunity vs necessity).
2.2.2. Entrepreneurs happiness across cultures
Culture is considered to be the collective identity of communities (Beugelsdijk & Maseland, 2010). Culture is the set of values latent to a community or a society, where the development of certain personality traits is molded which may motivate individuals to pursue certain behaviors that may not be so prevalent in other countries(Morrison et al., 2011; Oishi et al., 2013).
Entrepreneurial activity may be one of those behaviors that varies by country due to differences in cultural values and beliefs (Huggins & Thompson, 2014; Mueller & Thomas, 2001). In concrete, since culture might reinforce certain personal traits whereas it devalues others, some cultures tend to be more entrepreneurially led than others (Mueller & Thomas, 2001).
Cultural attitudes and the vision they convey of entrepreneurship might have an important impact on creating an 'entrepreneurial culture' (GEM, 2017). Mueller and Thomas (2001) explain that personal attributes such as independence, need for control, trust, initiative, pursuit of well-being and economic resources are often associated with entrepreneurial behavior. In addition, the authors argue that "since a country's culture influences the values, attitudes, and beliefs of its people, we can expect variety in the distribution of individuals with entrepreneurial potential in cultural contexts." (Mueller & Thomas, 2001, pp. 68-69). As Morrison et al. (2011, p. 166) suggest "[t]he country where you live has inescapable consequences for your life. It affects your job opportunities, the quality of your health care, and your risk of becoming a victim of crime or war.” Moreover, it is also likely that what constitutes the good and the beneficial might also varied across cultures, and the factors that envision happiness.
In short, entrepreneurs’ happiness might vary across cultures. Additionally, the meaning of an entrepreneur might also vary according the type of culture (Lackéus, 2017): 1) the pursuit for discovery and exploit new opportunities, but focused on competition, search for power, freedom and money; or 2) the discover and exploitation of new opportunities, but that are aligned with the values of the community, being focused on undertaking for the collective, creating meaningful acts of creation for the benefit of others.
The GLOBE Framework (Global Leadership and Organizational Behavior Effectiveness) is a research project that constitutes an extension of the study by Hofstede to identify and explain differences in cultural arrangement, adding to the latter 3 additional dimensions (Hofstede, 2006; House, Quigley, & Luque, 2010). The GLOBE is a cross-cultural research about leadership and national culture, embracing 62 different countries, which identify nine dimensions about cultural difference (GLOBE, 2014): institutional collectivism, in-group collectivism, power distance, performance orientation, gender egalitarianism, future orientation, humane orientation, assertiveness and uncertainty avoidance.
Although GLOBE and Hofstede studies did not specify a particular relationship between happiness and (the type of) entrepreneurship, their cultural dimensions might be useful to
act as a key moderating factor between (types of) entrepreneurship and life satisfaction/ happiness.
2.2.3 Empirical studies relating happiness/ well-being, entrepreneurship, and culture: main hypotheses to be tested
As referred earlier, there are few studies that relate entrepreneurship and happiness/ well-being (see Table 3). Moreover, those few that exist do not focus on whether (the type of) entrepreneurship impact on happiness and life satisfaction in a wider set of contexts/ countries.
Extant literature has concluded that when comparing entrepreneurs and non-entrepreneurs, the first group evidence positive and higher scores related to happiness/well-being and life satisfaction (see Table 3).
Specifically, from Table 3 we observe that entrepreneurs score higher levels of happiness than employees (non-entrepreneurs) (Andersson, 2008; Dijkhuizen et al., 2016; Douglas & Shepherd, 2014; Nataraajan & Angur, 2014; Naudé et al., 2014), and that self-employed are more satisfied with their professional status than wage-earners (Dijkhuizen et al., 2016; Nataraajan & Angur, 2014; Naudé et al., 2014). On the other side, when comparing the different types of entrepreneurs, the relation with happiness emerges as ambiguous (Binder & Coad, 2013). Indeed, high levels of happiness are positively associated to opportunity entrepreneurship, whereas self-employment or necessity entrepreneurs score lower in terms of well-being/life satisfaction rates (Binder & Coad, 2013).
Considering the selected studies, it is apparent that no analysis has been made in this area on the role of culture as an intermediate factor between (the type of) entrepreneurship and happiness. We content, that culture is likely to impact on such relation. Thus, it would be illuminating to investigate whether the value of happiness in the life of an entrepreneur, wholly considered and taking into account the type of entrepreneurs, is mediated by national culture.
Given the literature reviewed above, we put forward some hypotheses that the present study aims to test:
H1: Entrepreneurs evidence higher levels of life satisfaction/ happiness than non-entrepreneurs.
H2: Opportunity entrepreneurs evidence higher levels of life satisfaction/ happiness than necessity entrepreneurs.
H3: Countries’ culture mediates the impact that (the type of) entrepreneurship has on life satisfaction/ happiness.
Table 3. Relation between (types of) entrepreneurs and happiness/well-being/satisfaction
Study Country Observations/ Unit of
analysis Period Methodology
Dependent
variable Independent variables
Relation (types of) entrepreneurship and
happiness/well-being/satisfaction
(Naudé et
al., 2014) 34 countries Country 2000-2007
Econometric - Regression using three- stage least squares (3SLS)
Life satisfaction score
Entrepreneurship measures: 1) total early-stage entrepreneurial activity (TEA) 2) opportunity-driven (OPP) 3) necessity-driven (NEC).
As control variables: national education, measure of the rule of law and a measure of economic freedom and GDP per capita. + (Nataraajan & Angur, 2014) 13 countries country 2008 Logistic regression
analysis Quality of Life [QOL]
Entrepreneurship measures: Knowledge Economy Index [KEI]; Global Entrepreneurship Index [GEI]. Other variables: innovation/ creativity, education, information technology and economic incentives regime
+
(Dijkhuizen
et al., 2016) The Netherlands
135 entrepreneur’s
vs employees 2013-2014
Multiple regression using Smart PLS method. work engagement, job satisfaction, exhaustion and workaholism Entrepreneurship measures:
Work performance and business performance. Other variables: turnover, profit and number of employees over the year
Self-employed are more satisfied with their jobs than wage-earners.
(Douglas & Shepherd,
2014) Australia 300 alumni 2000
Multiple Regression using
cross section data Entrepreneurial intention Attitudes towards work, risk, independence and income
Individuals opt to be entrepreneur when the level of independence is combined with great level of life satisfaction.
(Andersson,
2008) Sweden 2000 individuals 1991-2000 Logistic regression
Six different outcomes: if the job is stressful, if the job is mentally straining, mental health problems, bad general health, job satisfaction and life satisfaction
Entrepreneurship measures: self-employment or wage-earners
As control variables: age, Place of residence and Health
conditions +
(Binder &
Coad, 2013) UK
8000 individuals per
year 1996 -2006 Panel data random effect Well-being Entrepreneurship measures: Self-employment, and job status
Opportunity entrepreneurs: + Necessity entrepreneurs: -. (Mahadea &
Ramroop,
2015) South Africa 300 individuals 2015
Ordinal logistic
regression Happiness
Explanatory variables in the model are: age, gender, education, ethnicity, employment, ideas and personal
growth +
(Martínez &
Pardo, 2013) Chile 7.195 individuals 2011 Logistic regression Happiness Entrepreneurial intention in the first phase of entrepreneurship
This work examined the effect of happiness on the entrepreneurial intention not the effect of entrepreneurship on happiness. So, the hypothesis was not satisfactory Source: Own elaboration.
3. Methodology
3.1. Main hypotheses, method of analysis and the corresponding econometric specification
The main research aim of the present study is to analyse the extent to which (the type of) entrepreneurship impacts on happiness and life satisfaction in a wider set of contexts/ countries. Specifically, we aim at testing whether the relationship between entrepreneurship (and the types of entrepreneurship) and life satisfaction/ happiness is intermediated by national culture.
According to the literature review (Section 2) three main hypotheses are to be tested: H1: Entrepreneurs evidence higher levels of life satisfaction/ happiness than
non-entrepreneurs.
H2: Opportunity entrepreneurs evidence higher levels of life satisfaction/ happiness than necessity entrepreneurs.
H3: Countries’ culture mediates the impact that (the type of) entrepreneurship has on life satisfaction/ happiness.
In the scientific field of happiness and entrepreneurship several different methodologies, qualitative, quantitaive and mixed methodologies are used (Molina-Azorín., López-Gamero., Pereira-Moliner., & Pertusa-Ortega, 2012).
Qualitative methodologies can be useful when the topic/field of study is new and heterogeneous and one does not yet have the necessary knowledge to answer all possible hypotheses and to analyze all the differences between the different levels of entrepreneurs in different populations (Davidsson, 2005). Qualitative research is traditionally based on small, non-random samples and often used for exploratory purposes rather than for hypothesis testing, which means that qualitative research results can not be generalized (Molina-Azorín. et al., 2012). Quantitative based methodologies, in contrast, usually involves large groups/population, aim at reaching generalized results, or assessing the key relationship between different variables by establishing a cause and effect and testing the corresponding hypotheses (Davidsson, 2005).
In the present study, and in line with extant literature (see Section 2), we resort to quantitative methodologies. Indeed, is apparent that the analysis of the determinants of well-being, quality of life or life satisfaction and their relationship with (the types of) entrepreneurship has resorted mainly to quantitative type of methods (see Table 4). Specifically, the selected
studies used regression analysis, namely three-stage least squares (Naudé et al., 2014), logistic regressions (Andersson, 2008; Mahadea & Ramroop, 2015; Martínez & Pardo, 2013; Nataraajan & Angur, 2014), multiple regression (Dijkhuizen et al., 2016; Douglas & Shepherd, 2014) and unbalanced panel data (Binder & Coad, 2013).
Table 4. Methodologies of some of the studies reviewed
Studies Unit of analysis, observati ons, country
Proxy of the dependent
variable Proxy of the independent variables
Meth odolo gy of analys is (N au dé et al ., 20 14) 34 countries
Happiness: ranging from
1(dissatisfied) to 10 (satisfied)
TEA: Percentage of adult population (aged 18–
64) starting a new business that has paid salaries, to the owners for fewer than 42 months
OPP: Percentage of those involved in TEA who
claim to be driven by opportunity, main driver is being independent or increasing income rather than simply maintaining income
NEC: Percentage of those involved in TEA who
are involved in entrepreneurship because they had no other option for work
GDP per capita
Income Gini: Gini coefficient for income
distribution
Education index: Component of human
development index-adult literacy rate retrieve from Human Development Report-UNDP
Rule of law: Perceptions about the measure of
trust and compliance with the rules of society
Total economic freedom: Index of economic
freedom Th re s ta ge le as t s qu are s (3SLS) (An ders so n, 20 08 ) 2000 individuals in Sweden
Several dimensions of well-being: 1 if job is perceived as stressful, 0 otherwise. 1 if job is perceived as mentally straining, 0 otherwise
1 if one has had sleeping problems, been tired, been depressed or anxious, 0 if no such problems.
1 if general health is perceived to be bad or not so good, 0 if general health is perceived to be good. 1 if one is very satisfied with work, 0 otherwise.
1 if one is satisfied with life most of the time, 0 otherwise
Occupation: self-employment or wage-earners
(divide as Unskilled blue collar, Skilled blue-collar, White-collar (low level), White-blue-collar, (middle level) and White-collar (high level))
Age: measure by years
Place of residence: City>30 000 inhabitants
City<30 000 inhabitants
Health conditions: Bad general health, mental
health problems, feeling overstrained, job is mentally straining, job is stressful, life-satisfaction and job-satisfaction. Lo gis tic re gre ss io n
(...) (Ma had ea & R am roop , 20 15) 300 individuals in South Africa
Happiness was measured on a Likert scale, from 1 to 5, with lower values indicating ‘least happy’ (1) and higher values reflecting ‘extremely happy’ (5).
Income was measured along a continuum from low (R1000) to high (R18000 and above). Ethnicity: black, coloured and Indian Employment status: self-employment or wage employee
Educational level: grade, matric, diploma, degree and postgraduate
Lo gis tic re gre ss io n (Ma rt ín ez & Par do, 20 13) individuals 7195 in Chile
Happiness: result of the
World Happiness Report
Age: measure by years Gender: male or female
Employment status: self-employment or
intention to start a business in the next 3 years
Educational level: at least university degree
(N at ar aaj an & An gu r, 20 14) 13 countries
EIU-QOL Survey results
determinants where it shows that most important QOL factors were health, material well-being, political stability and security, followed by family relations and community life.
KEI: Index that represents the general preparation of a country or region towards a knowledge economy.
GEI: Index of Global Entrepreneurship and
Development Index.
Innovation/ creativity: Royalty payments and
receipts [US$ per person], technical journal articles per million people and patents granted to nationals per million people
Education: Adult literacy rate Information technology: Telephones,
computer and internet users per 1,000 people.
Economic incentives regime: tariff and
non-tariff barriers, regulatory quality and rule of law (D ijkhu iz en et al ., 20 16 ) 135 individuals in Netherlands
Workaholism: four- point scale (1 = ‘never’; 4 = ‘always’)
Exhaustion: four-point scale with 0 = never, 1 = sometimes, 2 = often and 3 = always.
Engagement: seven-point scale, 1 = never to 7 = daily Satisfaction: This is a five-point scale with 1 = totally disagree to 5 = totally agree.
Business Performance: measured by self-reported turnover, profit and number of employees M ulti ple re gre ss io n (D ou gl as & Sh ep herd , 20 14) 300 alumni in Australia Conjoint analysis to determine the decision policies (based on expected utility) of career decision-makers who may or may not intend to be entrepreneurs.
Several dimensions of Attitudes towards: Work: the requirement for time and effort in the workplace
Risk: the variance of profit outcomes around an expected level of profit
Independence: a preference for decision-making control, a preference to serve one’s own objectives rather than follow another’s orders and a preference to choose one’s own path to that objective
Income: – dollar remuneration.
(B in der & C oad , 20 13) 8000 individuals per year in UK BHPS’s life satisfaction question. Question ‘‘How
dissatisfied or satisfied are you with your life overall?’’7 points scale for individual’s life satisfaction ‘‘not satisfied at all’’ (1) to ‘‘completely satisfied’’ (7)
GHQ-12 ‘‘mental well-being’’ variable, which is
relates to mental health. It is an index from the 12 questions that assess happiness, mental distress (such as existence of depression or anguish), and
Job Conditions: unemployed, employed and
self-employed.
Gender: male or female Age: measure by years
Income: “net equivalised annual household
income (in British Pound Sterling) before housing costs and deflated to the price level of 2008.”
Education: ranging from one (‘‘none’’) to nine
(‘‘higher tertiary’’), giving intermediate values to the middle education levels.
Unbalan ced panel
data method
Studies Unit of analysis, observations, country Proxy of the dependent variable Proxy of the independent variables Methodology of analysis
In light of the literature reviewed, the baseline econometric specification regresses the degree of individual’s happiness/ wellbeing/ life satisfaction against individual’s entrepreneurial status (ENTR), the cluster of culture of the country where the individual belongs (C), the interaction between the individual’s entrepreneurial status and country’s culture, and a set of control variables, X (individuals’ characteristics – age, gender, education attainment).
𝐻𝐴𝑃𝑖 = 𝛽1+ 𝛽2𝐸𝑁𝑇𝑅𝑖 + 𝛽3(𝐸𝑁𝑇𝑅𝑖× 𝐶𝑖) + 𝛽4𝐶𝑖 + 𝛽5𝕏𝑖+ 𝜇𝑖, where:
i is the individual;
𝜇𝑖 is the error term.
The extended econometric specification is similar to the baseline, but instead of considering the individual’s entrepreneurial status, it includes the type of entrepreneur, opportunity entrepreneurs (OE) and necessity entrepreneurs (NE).
𝐻𝐴𝑃𝑖 = 𝛽′1+ 𝛽′2𝑂𝐸𝑖 + 𝛽′3𝑁𝐸𝑖 + 𝛽′4(𝑂𝐸𝑖 × 𝐶𝑖) + 𝛽′5(𝑁𝐸𝑖 × 𝐶𝑖) + 𝛽′6𝐶𝑖 + 𝛽′7𝕏𝑖 + 𝜇′𝑖.
3.2. Selection of the estimation technique
In line with Andersson (2008); ;Mahadea and Ramroop (2015); Martínez and Pardo (2013); Nataraajan and Angur (2014), we selected logistic regression techniques for estimating the econometric specifications described above.
Logistic regressions are used to describe data and to explain the relationship between one binary dependent variable and one or more independent variables. Indeed, the objective of the present study is to explain the dependent variable, happiness (HAP), which is a dummy/binary variable, having two possible states. 1 (very happy & with very good health) or 0 (otherwise).2 It is possible then to estimate the probability of a binary response based on one or more independent variables, namely total, opportunity, and necessity entrepreneurship, national culture, and other control variables.
2 Specifically, we compute two alternative happiness variable, HAP, happiness, in lato sensu and HAP, happiness,
in stricto sensu, which assume the value 1 when the individual consider him/herself very happy and with very good health (lato sensu) or very happy (strict sensu), respectively.
Summing up, we aim at examining how the independent variables explain the dependent variable and assess the extent to which the (type of) entrepreneurship impacts on happiness/ quality of life.
3.3. Data source and variable proxies
The data for the analysis was gathered in the context of the latest (2016) World Value Survey (WVS), is publicly available upon registration at http://www.worldvaluessurvey.org/, and encompasses 90350 individuals from 60 countries. The questionnaire reports to the period 2010-2013.
The dependent variable is quality of life (HAP), which is one of the best-known indicators of happiness/ wellbeing/ life satisfaction (Andersson, 2008; Binder & Coad, 2013; Lackéus, 2017), and it is used also by studies such as Nataraajan and Angur (2014); Naudé et al. (2014), and Binder and Coad (2013). The literature presents many definitions of happiness, conveying it as a positive emotional state, with feelings of well-being, pleasure and usually without suffering (Ali, 2014; Coelho do Vale, 2016; Lackéus, 2017; Naudé et al., 2014). In the WVS respondents are asked directly about quality of life / happiness and also about the health condition, status that directly affects the state of well-being. Our dependent variable is computed based on the responses to these two questions. Specifically, we calculated two alternative happiness variables, HAP 1 in lato sensu, which assume the value 1 when the individual responds to being very happy and with very good health and 0 otherwise (individuals who responded rather happy, Good health, Not very happy, not at all happy, fair and poor). And the second alternative, HAP 2, happiness, in strict sensu, where it assumes the value 1 when the individuals consider themselves very happy and 0 otherwise.
Our core independent variable relates to the entrepreneurship status. Using WVS question V229 that ask the professional status of the individuals, we recoded it as 1 when the answer was self-employed and 0 otherwise (employee). This follows a vast number of studies which consider self-employed as proxy for entrepreneur (Ali, 2014; Binder & Coad, 2013; Naudé et al., 2014; Zampetakis et al., 2017).
The proxies for opportunity (OE) and necessity entrepreneurs (NE) are computed based on the questions V229 (Employment status) & MN_228L (Employment preference) of the WVS (see Table 5). We consider as opportunity entrepreneurs (OE) those who answered that their professional status is self-employed, and their professional status preference is also
self-employed. Diversely, the necessity entrepreneurs (NE) were considered those individuals that have the professional status of self-employed but who would prefer being employee instead. In short, those who are entrepreneurs because at that moment they were not able to find a job and thus by ‘necessity’ have created their own business to be able to sustain themselves.
Countries were categorized in ten ‘national cultural’ groups (see Table 5) using the GLOBE Framework model of Nine Dimensions of National Cultures (House et al., 2010) building on findings by authors such as, among others, Hofstede (1980) Schwartz (1994), Smith (1995), and Inglehart (1997).
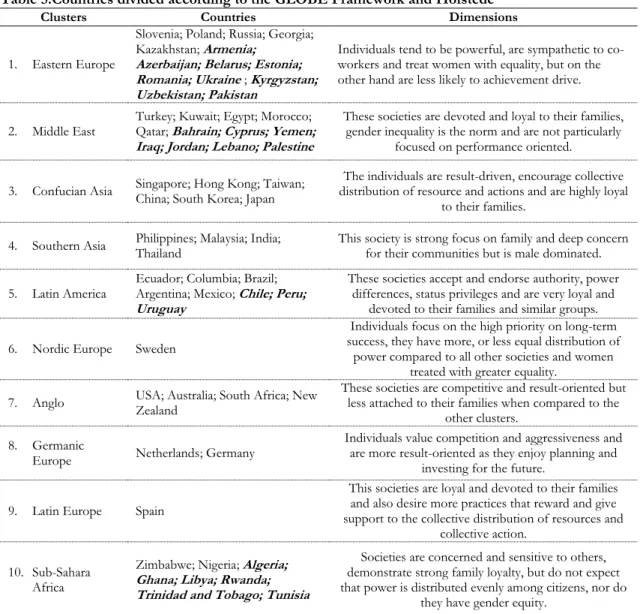
Table 5:Countries divided according to the GLOBE Framework and Hofstede
Clusters Countries Dimensions
1. Eastern Europe
Slovenia; Poland; Russia; Georgia;
Kazakhstan; Armenia;
Azerbaijan; Belarus; Estonia; Romania; Ukraine ; Kyrgyzstan; Uzbekistan; Pakistan
Individuals tend to be powerful, are sympathetic to co-workers and treat women with equality, but on the other hand are less likely to achievement drive.
2. Middle East Turkey; Kuwait; Egypt; Morocco; Qatar; Bahrain; Cyprus; Yemen;
Iraq; Jordan; Lebano; Palestine
These societies are devoted and loyal to their families, gender inequality is the norm and are not particularly
focused on performance oriented.
3. Confucian Asia Singapore; Hong Kong; Taiwan; China; South Korea; Japan distribution of resource and actions and are highly loyal The individuals are result-driven, encourage collective
to their families.
4. Southern Asia Philippines; Malaysia; India; Thailand This society is strong focus on family and deep concern for their communities but is male dominated.
5. Latin America
Ecuador; Columbia; Brazil;
Argentina; Mexico; Chile; Peru;
Uruguay
These societies accept and endorse authority, power differences, status privileges and are very loyal and
devoted to their families and similar groups.
6. Nordic Europe Sweden
Individuals focus on the high priority on long-term success, they have more, or less equal distribution of
power compared to all other societies and women treated with greater equality.
7. Anglo USA; Australia; South Africa; New Zealand These societies are competitive and result-oriented but less attached to their families when compared to the
other clusters. 8. Germanic
Europe Netherlands; Germany
Individuals value competition and aggressiveness and are more result-oriented as they enjoy planning and
investing for the future.
9. Latin Europe Spain
This societies are loyal and devoted to their families and also desire more practices that reward and give support to the collective distribution of resources and
collective action. 10. Sub-Sahara
Africa
Zimbabwe; Nigeria; Algeria;
Ghana; Libya; Rwanda; Trinidad and Tobago; Tunisia
Societies are concerned and sensitive to others, demonstrate strong family loyalty, but do not expect that power is distributed evenly among citizens, nor do
they have gender equity. Source: Own elaboration using GLOBE and Hofstede Six Dimensions Frameworks
*Although in the GLOBE tool there are 62 countries listed and divided by the above clusters, when compared to the survey used - World Value Survey, there were countries that were not in both studies. As a result, we removed countries that were not studied in the WVS from the cluster and added the countries that are in bold, following their histories, religions, languages and geographical proximity.
** The following countries were removed from the clusters due to data unavailability are Greece, Hungary, Albania (Eastern Europe). Indonesia and Iran (Southern Asia). El Salvador, Bolivia, Guatemala, Costa Rica and Venezuela (Latin America). Denmark and Finland (Nordic Europe). Austria and Switzerland (Germanic Europe). Israel, Italy, Portugal and France (Latin Europe). Namibia and Zambia (Sub-Sahara Africa).
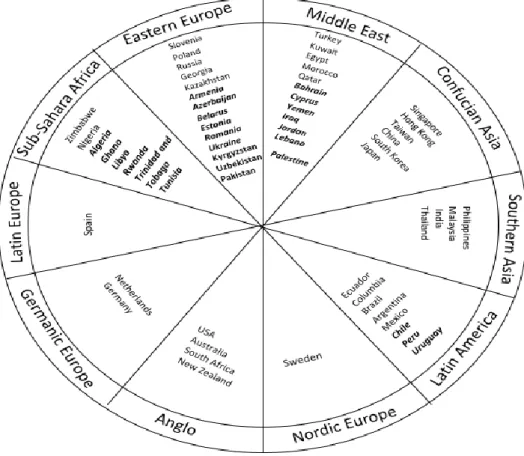
The ten groups were classified in terms of their culture proximity. In the book Culture, Leadership, and Organizations: The GLOBE Study of 62 Societies (House., 2004), it is shown the cluster in a graphic with wheel format, with cultural difference increasing the more distant they are apart on the wheel.
Figure 1. Countries categorized according to the GLOBE Framework and Hofstede Note: Bold presents the countries added, following their histories, religions, languages and geographical proximity
Source: Own elaboration adjust the GLOBE study using the WVS country data
The ‘Eastern Europe’ cluster is composed by 14 countries (Slovenia; Poland; Russia; Georgia; Kazakhstan; Armenia; Azerbaijan; Belarus; Estonia; Romania; Ukraine; Kyrgyzstan; Uzbekistan; Pakistan) whose citizens tend to be powerful, and treat women with equality, but on are less likely to achievement drive, meaning that they do not focus on high personal and professional standards (Combination of Power Distance + Gender Egalitarianism). The Middle East group (Turkey; Kuwait; Egypt; Morocco; Qatar; Bahrain; Cyprus; Yemen; Iraq; Jordan; Lebano; Palestine) show societies devoted and loyal to their families, with high scores on gender inequality and are not particularly focused on performance oriented, not encouraging performance improvement (Combination of Assertiveness + In-group collectivism).
The Confucian Asia (Singapore; Hong Kong; Taiwan; China; South Korea; Japan) has individuals focus on result-driven, encourage collective distribution of resource and actions, and are highly loyal to their families (Uncertainty Avoidance).
The Southern Asia (Philippines; Malaysia; India; Thailand) is the cluster that has one of the highest score in concern with family and their communities but is a male dominated society (Humane Orientation).
Latin America (Ecuador; Columbia; Brazil; Argentina; Mexico; Chile; Peru; Uruguay) includes societies that accept and endorse authority, power differences, status privileges and are very loyal and devoted to their families (Power Distance).
The Nordic Europe (Sweden) encompasses societies that have as high priority the long-term success, equal distribution of power where women are treated with greater equality (Institutional Collectivism).
The Anglo cluster (USA; Australia; South Africa; New Zealand) is competitive and result-oriented but less attached to their families when compared to the other clusters (Performance Orientation).
The Germanic Europe (Netherlands; Germany) is characterized by competition and aggressiveness and are more result-oriented as they enjoy planning and investing for the future (Future Orientation).
The Latin Europe only includes Spain because the other countries that belongs to this cluster (Israel, Italy, Portugal and France) are not included in WVS. In this cluster societies that are represented by individuals that are loyal to their families and organizations and also desire more practices that give support to the collective distribution of resources (Combination of Power Distance + In-Group Collectivism).
Sub-Sahara Africa (Zimbabwe; Nigeria; Algeria; Ghana; Libya; Rwanda; Trinidad and Tobago; Tunisia) cluster comprises individuals who are concerned and sensitive to others, demonstrate strong family loyalty, but do not expect that power is distributed evenly among citizens, or have gender equity (In-group Collectivism).
Beside the core independent variables, the econometric specification includes some control variables, which account for individuals’ characteristics - gender, age and educational level – that are likely to influence happiness. Gender variable assumes the value 1 when the respondent is a female and 0 a male. Age is measured in years. Educational level assumes the value 1 when the individual has University degree and 0 otherwise.
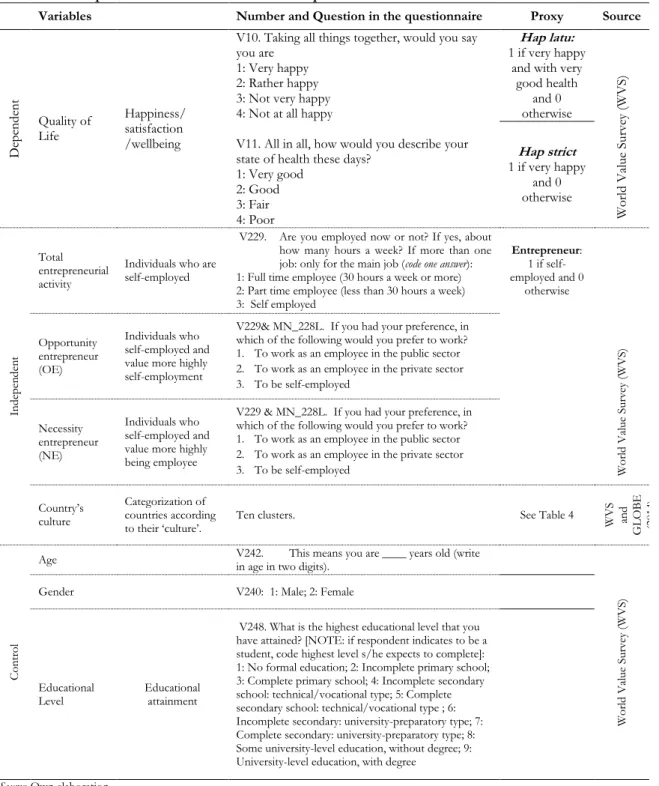
Table 5 summarizes the relevant variables and their descriptive statistics. Table 6. Description of the relevant variables and proxies
Variables Number and Question in the questionnaire Proxy Source
Dep en de nt Quality of Life Happiness/ satisfaction /wellbeing
V10. Taking all things together, would you say you are
1: Very happy 2: Rather happy 3: Not very happy 4: Not at all happy
V11. All in all, how would you describe your state of health these days?
1: Very good 2: Good 3: Fair 4: Poor Hap latu: 1 if very happy
and with very good health and 0 otherwise W orld V alue Su rve y (W V S) Hap strict 1 if very happy and 0 otherwise Ind epen den t Total entrepreneurial activity
Individuals who are self-employed
V229. Are you employed now or not? If yes, about how many hours a week? If more than one job: only for the main job (code one answer): 1: Full time employee (30 hours a week or more) 2: Part time employee (less than 30 hours a week) 3: Self employed Entrepreneur: 1 if self-employed and 0 otherwise W or ld V al ue Sur vey (W V S) Opportunity entrepreneur (OE) Individuals who self-employed and value more highly self-employment
V229& MN_228L. If you had your preference, in which of the following would you prefer to work? 1. To work as an employee in the public sector 2. To work as an employee in the private sector 3. To be self-employed Necessity entrepreneur (NE) Individuals who self-employed and value more highly being employee
V229 & MN_228L. If you had your preference, in which of the following would you prefer to work? 1. To work as an employee in the public sector 2. To work as an employee in the private sector 3. To be self-employed
Country’s culture
Categorization of countries according
to their ‘culture’. Ten clusters. See Table 4 W
V S and G L O B E (2 01 4) C on tr ol
Age V242. in age in two digits). This means you are ____ years old (write
W or ld V al ue Sur vey (W V S)
Gender V240: 1: Male; 2: Female
Educational
Level Educational attainment
V248. What is the highest educational level that you have attained? [NOTE: if respondent indicates to be a student, code highest level s/he expects to complete]: 1: No formal education; 2: Incomplete primary school; 3: Complete primary school; 4: Incomplete secondary school: technical/vocational type; 5: Complete secondary school: technical/vocational type ; 6: Incomplete secondary: university-preparatory type; 7: Complete secondary: university-preparatory type; 8: Some university-level education, without degree; 9: University-level education, with degree
4. Empirical results
4.1. Description of the sample
The data from the World Value Survey (WVS) encompasses 90350 individuals from 60 countries over the period 2010-2013.
As a first orientation, we start by analyzing our dependent variable – quality of life/Happiness (HAP) and its average for each of the ten culture clusters (Eastern Europe, Middle East, Confucian Asia, Southern Asia, Latin America, Nordic Europe, Anglo, Germanic Europe, Latin Europe and Sub-Sahara Africa), in order to assess the specific effects and interaction of the national culture.
Considering the relevant, non-missing data, 15% of the respondents considered themselves as ‘happy in a broad sense’ (HAP lato sensu), that is, reported being ‘very happy and with very good health’ (condition that we use to classify the level of happiness / quality of life), and 33% are ‘happy in the strict sense’ (HAP stricto sensu), i.e., reported being very happy (regardless their health condition).
Slightly more than half (52%) of the respondents are women and have a mean age of 39 years. Furthermore, 17% of respondents have a university degree, and 12% of are entrepreneurs, i.e. individuals who responded being self-employed.
Of the individuals who are entrepreneurs (12%), 41% are individuals who claim would like to be self-employed, i.e. individuals who are ‘opportunity entrepreneurs’, meaning that found an opportunity in a new business or market; almost 60% of self-employed would like to be employees, that is, are ‘necessity entrepreneurs’, those who are only entrepreneurs because they did not find job opportunities in the labour market.
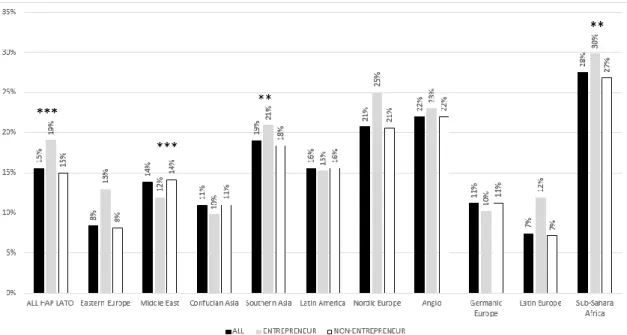
Observing Figures 2 and 3, we noticed that, in general, self-employed are happier than wage-earners. Of the total sample investigated, 15% of the individuals considered themselves very happy and with very good health (HAP lato sensu), of which 19% are entrepreneurs while only 15% are non-entrepreneurs, being the differences in happiness statistically very significant (p-value<0.01). When we analyse HAP in the stricto sensu, we observe that 37% of the entrepreneurs are very happy against 32% of the remaining individuals, with this difference being statistically significant (the p-value of Kruskal Wallis test is below 0.01). Assessing the differences between entrepreneurs and non-entrepreneurs taking into account each culture, we observe (see Figure 2) that culture seems to matter. Specifically, the highest proportion of ‘happy’ entrepreneurs in lato sensu is from ‘Sub-Sahara Africa’, with 30% of the
entrepreneurs who claim to be very happy and with very good health versus 27% for their non-entrepreneur’s counterparts. The next happiest is the ‘Southern Asia’ (21%), with Kruskal-Wallis test evidencing that entrepreneurs and non-entrepreneurs are statistically different (p-value<0.10). In the clusters of culture, ‘Nordic Europe’ (25%), ‘Anglo’ (23%), ‘Eastern Europe’ (13%) and ‘Latin Europe’ (12%) entrepreneurs evidence higher happiness rates among entrepreneurs than non-entrepreneurs but do not indicate significantly rates in terms of happiness. In contrast, in the ‘Confucian Asia’, ‘Latin America’ and ‘Germanic Europe’, entrepreneur and non-entrepreneurs do not differ significantly in terms of happiness. Additionally, for these ‘cultures’ the level of happiness (in lato sensu) is lower than those from the other ‘cultures’.
Figure 2. Average comparison between happiness(lato sensu: very happy and very good health), entrepreneur and non-entrepreneur in each cluster
Note: P-values: *** Significance at the 1 % level; ** Significance at the 5 % level; * Significance at the 10 % level
We further observe that regardless of how we measure happiness (in lato or stricto sensu), the results are similar, with, when statistically significant, the entrepreneurs being happier than non-entrepreneurs (see Figure 3). The only exception in both cases is the Middle East, where non-entrepreneurs are significantly happier than entrepreneurs.
Figure 3. Average comparison between happiness (stricto sense: very happy), entrepreneur and non-entrepreneur in each cluster
Note: P-values: *** Significance at the 1 % level; ** Significance at the 5 % level; * Significance at the 10 % level
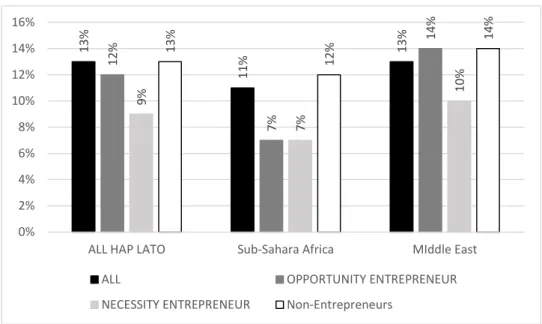
The analysis of the types of entrepreneurs (Figures 4 and 5) is highly constrained by the availability of data. Indeed, we only have data for two culture clusters, the Middle East and Sub- Sahara Africa, and within each cluster for only a reduced number of countries - 6 countries for the Middle East - Bahrain, Iraq, Jordan, Kuwait, Lebanon and Yemen -, and 2 countries - Algeria and Tunisia – for Sub-Sahara Africa. Considering the sample of whole individuals, we observe that 12% of the opportunity entrepreneurs are happy and with very good health, whereas for necessity entrepreneurs and non-entrepreneurs the corresponding percentage is, respectively 9% and 13% (see Figure 4). In Sub-Sahara Africa 12% of the non-entrepreneurs claim to be very happy and in very good health, above that of OE and NE (7%). Regarding the Middle-East, the percentage of OE and non-entrepreneurs who are happy in lato sensu is similar (14%) and above that of NE. According to the Kruskal-Wallis test such differences, however, are not statistically significant.
Figure 4. Average comparison between happiness(lato sensu: very happy and very good health), opportunity entrepreneur, necessity entrepreneur and non-entrepreneur in each cluster
The happiness in stricto sensu (Figure 5) convey a similar picture of the happiness in lato sensu. Indeed, we observe that 18% of both OE and NE are happy, a lower percentage (although not statistically significant) than that of non-entrepreneurs (22%) (see Figure 4). The percentage of NE who are happy is quite low in Sub-Sahara Africa (11%), but statistically not different from OE (14%) and non-entrepreneurs (18%). In the Middle-East the order is similar and again no significant differences emerge in the percentage of OE, NE and non-entrepreneurs who are happy (respectively, 19%, 20% and 23%).
Figure 5. Average comparison between happiness(stricto sense: very happy), opportunity entrepreneur, necessity entrepreneur and non-entrepreneur in each cluster
13% 11% 13% 12% 7% 14% 9% 7% 10% 13% 12% 14% 0% 2% 4% 6% 8% 10% 12% 14% 16%
ALL HAP LATO Sub-Sahara Africa MIddle East
ALL OPPORTUNITY ENTREPRENEUR
NECESSITY ENTREPRENEUR Non-Entrepreneurs
21% 18% 23% 18% 14% 20% 18% 11% 19% 22% 18% 23% 0% 5% 10% 15% 20% 25%
ALL HAP STRICT Sub-Sahara Africa MIddle East
ALL OPPORTUNITY ENTREPRENEUR
Regarding the correlations,3 in both cases happiness is positively related to entrepreneurship and negatively related to the opportunity entrepreneurs, necessity entrepreneurs and age. The only distinct concerns education, where in lato sensu it is negatively related to happiness whereas in stricto sensu is positively related. Thus, on average, entrepreneurs are happier than non-entrepreneurs, but opportunity and necessity entrepreneurs tend to be less happy than non-entrepreneurs. Such apparently contradictory results can be explained by the fact that the former correlations - happiness and types of entrepreneurship - are only valid for a very reduced number of observations (restricted to Middle East and Sub-Sahara countries). Additionally, highly educated and older individuals tend to be less happy than their lower educated and younger counterparts. Females tend to be less happy than their males’ counterparts when happiness includes both very happy and very good health; however, when happiness is measured in strict terms, considering only very happy, females are happier than males.
It is important to highlight that the correlation coefficient among independent variables are rather small, which means that there are no problems of multicollinearity.
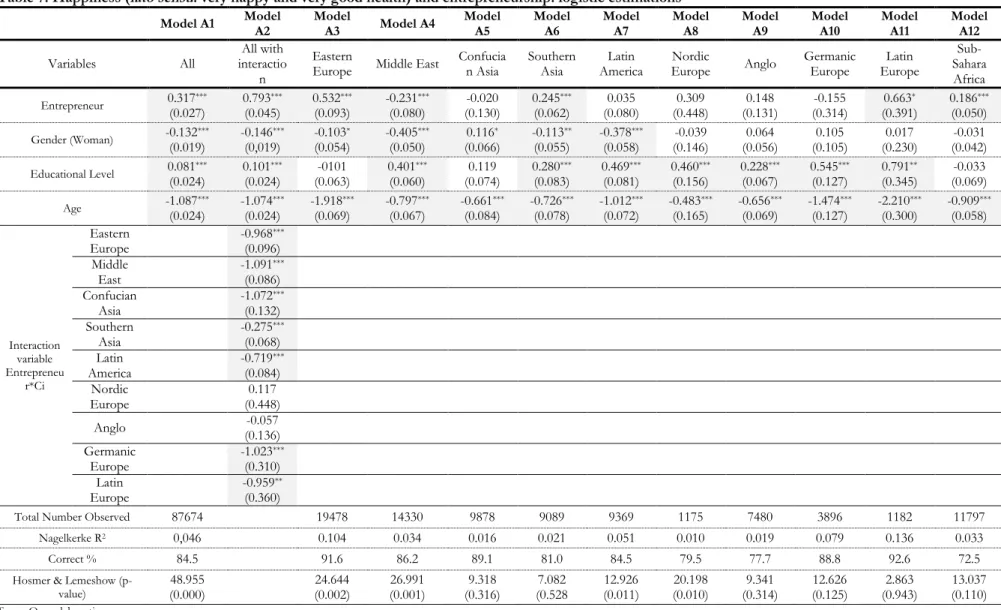
4.2. Estimation results 4.2.1. Initial considerations
We run the estimations considering the impact of entrepreneurship on both happiness in lato sensu (very happy and very good health) (Table 7) and in stricto sensu (very happy) (Table 8). For each set of these estimations, we run 12 distinct models: Models 1, which includes all ‘cultures’ without considering the interaction between cultures and entrepreneurship; Models 2, which includes all ‘cultures’ considering the interaction between cultures and entrepreneurship; Models 3-12, which includes the relevant variables for each of the 10 ‘cultures’ considered ( Model 3: Eastern Europe; Model 4: Middle East; Model 5: Confucian Asia; Model 6:Southern Asia; Model 7 :Latin America; Model 8: Nordic Europe; Model 9: Anglo; Model 10: Germanic Europe; Model 11:Latin Europe ; Model 12 Sub-Sahara Africa). Regarding the estimations for happiness which includes the types of entrepreneurship (Tables 9 and 10), we only have data available for 2 ‘cultures’, Middle East and Sub-Sahara Africa. Thus, we were only able to estimate 4 models: Model A’1: which includes the 2 ‘cultures’ without considering the interaction between cultures and entrepreneurship; Model