THIS REPORT WAS PREPARED BY “STUDENT’S NAME”, A MASTERS IN FINANCE STUDENT OF THE NOVA SCHOOL OF BUSINESS AND
ECONOMICS, EXCLUSIVELY FOR ACADEMIC PURPOSES.THIS REPORT WAS SUPERVISED BY ROSÁRIO ANDRÉ WHO REVIEWED THE VALUATION METHODOLOGY AND THE FINANCIAL MODEL. (SEE DISCLOSURES AND DISCLAIMERS AT END OF DOCUMENT)
See more information at WWW.NOVASBE.PT Page 1/32
M
ASTERS IN
F
INANCE
E
QUITY
R
ESEARCH
§ We conclude our coverage of Tesla Motors Inc. with a HOLD recommendation that is derived by a target price of $ 257.25 for the financial year 2017. Our target price includes a comprehensive scenario analysis, which comes together to an upside potential of 13.3%.
§ The electronic vehicle market growth is dependent on various
factors, which most of them will have a positive effect on the electronic
vehicle deployment. Nonetheless, the exceeding of single digit electronic vehicle market share is not expected before 2035.
§ The future success of Tesla Motors Inc. depends mainly on the
transition from a premium niche car manufacturer to an electronic
vehicle manufacturer that can meet mass market demand and price expectations, but we do not see mass-market volumes before 2025, which incorporates a long-term execution risk.
§ Tesla Motors Inc. is expected to continue with its high
expenditures into new production facilities and R&D, making further secondary stock issuance unavoidable, which will dilute current
shareholders even more.
§ The energy storage division with its new products enhanced by the Gigafactory, is capable of single digit billion dollar revenues but it is highly uncertain when customer demand reaches the possible supply.
Company description
Tesla Motors, Inc., founded in 2003, designs, manufactures, and sells premium long range electric vehicles, electric vehicle powertrain components and stationary energy storage systems. The Company owns its sales and service network. Its aspiration for the future is to become a fully vertically integrated energy company.
T
ESLA
M
OTORS
,
I
NC
.
C
OMPANY
R
EPORT
C
ONSUMER
G
OODS
05
D
ECEMBER2016
S
TUDENT
:
K
EVIN
M
AXIMILIAN
K
RÜGER
Kevin.kruger.2015@novasbe.pt
Recommendation: HOLD
Price Target FY17: 257.25 $
Price (as of 6-Jan-17) 226.99 $
Reuters: TSLA.OQ, Bloomberg: TSLA:US
52-week range ($) 141.05-269.34
Market Cap ($bn) 36.566
Outstanding Shares (m) 161.089
Free Float (m) 117.91
50 Days Avg. Daily Volume (m) 4.55 Expected Share Price Return 13.3% Source: Bloomberg, Analyst`s estimates
Source: Bloomberg
(Values in € millions) 2015 2016E 2017E
Revenues 5,291 9,229 13,099 EBITDA 213 (30.2) 310.5 Net Income (492.9) (426.3) (309.0) EPS (6.93) (2.6) (1.9) P/E NA NA NA D/E 1.6 0.5 0.5 EV/Sales 7.3 4.2 3.0 Current Ratio 1.3 1.4 1.4 Gross Margin 23.7% 24.0% 24.0% Source: Company data, Analyst estimates
The transition of a premium niche car
manufacturer
… driven by production ramp up and product range
expansion
TESLA MOTORS, INC. COMPANY REPORT PAGE 2/32
Table of Contents
COMPANY OVERVIEW ... 3
COMPANY DESCRIPTION ... 3
SHAREHOLDER STRUCTURE ... 3
ELECTRONIC VEHICLE MARKET ... 4
EXTERNAL DETERMAINTS ... 5
Greenism ... 5
Government Incentives ... 6
COMMODITIES ... 9
Electricity Prices ... 10
Oil Prices ... 10
Battery Prices and Durability ... 11
ELECTRONIC VEHICLE SPECIFICS ... 12
Charging Facilities ... 12
Model Diversity ... 13
Total Cost of Ownership ... 14
MARKET ASSESSMENT &OUTLOOK ... 15
COMPANY SETUP & ANALYSIS ... 17
BUSINESS UNIT ANALYSIS ... 17
Roadster ... 17
Model S ... 18
Model X ... 18
Model 3 ... 19
Energy ... 21
Powertrain & Service ... 22
TESLA MOTORS KEY OF ANALYSIS ... 22
Gigafactory ... 22
Super Charger & Tesla Store Network ... 23
FINANCIAL OUTLOOK & VALUATION ... 24
FINANCIAL STATEMENT ADJUSTMENTS ... 24
FORECAST ... 25
COST OF CAPITAL &TERMINAL GROWTH ... 26
VALUATION SUMMARY ... 27
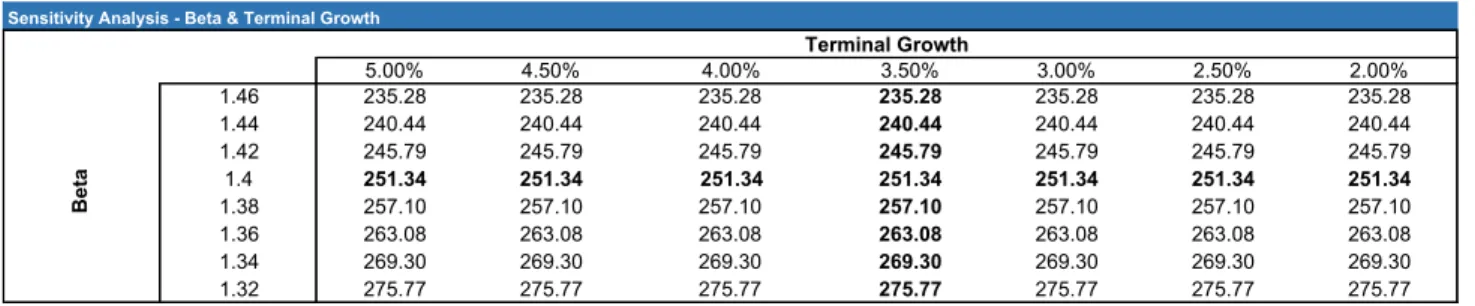
SENSITIVITY ANALYSIS ... 28
APPENDIX ... 29
FINANCIAL STATEMENTS ... 31
TESLA MOTORS, INC. COMPANY REPORT
PAGE 3/32
Company Overview
Company Description
Tesla Motors, Inc. founded in 2003 in Palo Alto, CA designs, develops, manufactures and sells electric vehicles (EVs) and stationary energy storage products internationally but mainly in the United States, China and Norway with its 13,058 employees. All vehicles are exclusively powered by lithium-ion batteries. The company also offers electric vehicle powertrain components and systems to other automotive manufacturers. Its distribution channels include a network of Tesla stores, galleries and an online shop.
In 2008 Tesla Motors started with its first EV the Roadster, which was the first highway legal serial produced Battery Electronic Vehicle (BEV) in the world. The sales of the Roadster and the IPO in 2010, made it possible to launch in 2012 the first premium electric sedan, the Model S. In 2012 Tesla Motors unveiled the third EV model, the Model X a luxury cross-over SUV, which is available since end of 2015. Tesla Motors vehicles are produced at its factory in Fremont, California. Furthermore, Tesla Motors is building with its strategic partners a Gigafactory to facilitate the production of the upcoming Model 3, that is supposed to cover the mass affordable market and the sufficient production of lithium ion batteries.
Shareholder structure
Analysing Tesla Motors shareholder structure, it is most important to mention that Elon Musk the CEO is holding 20.8% of Tesla, which shows first of all his personal trust and commitment in the company and its vision. Second, Elon Musk represents not only with its stake but also with its visionary business thinking a key role within the company. The success of Tesla Motors is highly dependent on his decisions which results in a key role risk.
Second biggest shareholder is Fidelity, a multinational financial service corporation that holds with its different investment funds 12.09% of Tesla Motors. Other significant shareholders are Baillie Gifford and T. Rowe Price, both investment firms with stakes of 7.97% and 5.7% respectively.
The shareholder type structure is dominated by institutional investors with a stake of 75.2%, which are followed by insiders with 21.2% and retail investors with 3.5%. The insider stake is dominated as mentioned by the Stake of Elon Musk and is complemented with minor stakes of Jeffrey Straubel (CTO), Stephen Jurvetson (BoD), Kimbal Musk (BoD), Ira Ehrenpreis (BoD), Douglas Field (Sr. Vice
TESLA MOTORS, INC. COMPANY REPORT
PAGE 4/32
President Engineering) and Brad Buss (BoD) with stakes of 0.21%, 0.15%, 0.10%, 0.01%, 0.01% and 0.01% respectively.
Major stakes of strategic partners are Toyota Group and Panasonic Corporation. Toyota Group signed in 2010 a joint development agreement with Tesla Motors in order to supply powertrains for the second generation of Toyota’s RAV4 EV model. Panasonic Corporation distributed already in the early days of Tesla Motors lithium-ion batteries and is till today an important strategic partner for different projects of Tesla Motors. Most importantly, Panasonic Corporation signed in 2014 an agreement to build a large-scale battery manufacturing plant with Tesla in Nevada, United States, which is better known as the Gigafactory.
Furthermore, Tesla Motors shareholder structure was mainly influenced by insider transactions such as option exercises from Elon Musk. We see the sale of shares worth approximately $593 million in May 2016 from Elon Musk not as a lack of trust, Tesla itself made the effort and explained that the sale is exclusively used for paying income taxes connected to option exercises. The constant investments with Elon Musk’s personal funds is showing his strong believe into the vision of Tesla Motors and we believe it ensures interest alignment between the management and Tesla’s shareholders.
Electronic Vehicle Market
The future success of Tesla and its competitors is highly dependent on the development of the electronic vehicle market. In our analysis, we consider only battery electric vehicles (BEVs) and it is focused on the main EV markets such as United States, Europe, Japan and China, where more than 90% of EV sales occur.1
Future growth and development is highly dependent on different factors that are going to be explained in the following. Our Analysis states that the EV market is influenced by external determaints, commodity prices and vehicle specific factors. External determaints are first the political setup for direct, indirect and complementary incentives from governments. Second we recognised that the awareness for environmental pollution and its long-term effects are crucial for a successful EV deployment. Furthermore, the price progression of oil and electricity has an impact on the further deployment of EVs. The fuel costs of an EV are directly correlated with the electricity price and the oil price in the future determines how economically justifiable a purchase of an EV will be. Our analysis is
1
Global EV Outlook 2016, International Energy Agency (IEA), Page 35
Elon Musk stake in Tesla incorporates a high key role risk
TESLA MOTORS, INC. COMPANY REPORT
PAGE 5/32
complemented by vehicle specific factors such as total cost of ownership (TCO) and the expansion of charger stations because the purchase of an EV must be economically attractive for customers and secondly an EV must satisfy the needs of customers regarding range flexibility.
The following analysis determines the future growth of EV market shares depending on each single factor, by assessing a best, base and worst-case scenario we will be able to conclude a comprehensive market share forecast of battery electronic vehicles. The market shares of BEVs are measured by total passenger car sales in the respective year. The different scenarios are adjusted by probabilities, which are 20%, 70% and 10% for the best, base and worst-case scenario respectively, to conclude a combined scenario.
External Determaints
External determaints can be described as influence factors coming not directly from within the EV industry but from third parties or coming from the mind-set regarding sustainable economies. Both factors have an interdependence relationship to each other and are highly diverse between different countries. Nonetheless, these factors can have tremendous influence on the pace of EV deployment.
Greenism
Greenism or better known as environmental awareness is the actual consciousness of a country and ultimately its customers that the current state of economy must change in order to reduce greenhouse gas (GHG) emissions. Governments of major economies coming together in conferences such as the Conference of Paris (COP21) to define recommendations of action and concrete GHG emission targets. Nonetheless, some countries are committing more to these targets than others. While the transport sector is accountable for 23% of total GHG it is obvious that this sector should get into a profound transformation to sufficiently reduce its GHG emissions.2 Stating that countries with more environmental consciousness having a higher EV deployment brings us to the conclusion that a growing awareness will have a positive influence on future EV market growth. Countries such as Norway can already register Plug-in Electric Vehicle (PEV) market shares of 23% in 2016, whereas China or the US have nearly 1% of PEV market share.
2
Global EV Outlook 2016, International Energy Agency (IEA), Page 7
Figure 2 EV deployment based on Greensim
TESLA MOTORS, INC. COMPANY REPORT
PAGE 6/32
We see this factor as crucial for further EV market growth and therefore attribute this factor with 20% influence in the overall market share growth. We are expecting an annual sales growth of 22.83% coming from environmental awareness with implied market shares of 3.29%, 12.13% and 26.15% for the years 2020, 2030 and 2040 respectively in our combined scenario. The environmental awareness is directly interrelated with government incentives which will be analysed next.
Government Incentives
Governments in the main markets are contributing with direct, indirect and complementary incentives to the market growth of EVs. The main goal of these incentives is to first make it economically more attractive for customers to buy an EV and second to support the automotive industry to further push the technological progress.
The United States as Tesla´s main market by revenue launched a $7.5 billion budget in 2012 to support the EV industry. New plug-in electric vehicles are incentivized with a $2,500 tax credit plus $417 for every kWh of battery capacity over 4kWh. The latter cannot exceed $5,000. Tesla customers are consequently allowed to activate the whole $7,500 of tax credit. The total budget of $7.5 billion is divided in the following parts, $1.8 billion are used for the tax credits, $2.4 billion are available for battery manufacturer in form of grants and $3.1 billion of loans are going to automotive companies to support the production of fuel-efficient vehicles. Considering an average tax credit of $3,500 the provided funds were sufficient to incentivize approximately 500,000 electronic vehicles until 2019.
In 2009 China decided to become one of the leading markets for EVs, to further reduce GHG emissions, to boost the Chinese automotive sector and to achieve less dependency on oil. China created an incentive system that supports new electric vehicles (NEV), which are all BEVs and all PHEVs with an electronic range more than 30 miles. EV customers in China are exempt from the registration and exercise tax which amounts for about $6,000 to $10,000. As of today, these incentives are only granted to vehicles produced in China, whereas Tesla has not yet any production site in China. Tesla and other international EV manufacturer are excluded from these incentives. This circumstance is leading to enormous market shares of Chinese (98.5%) and marginal shares of international EV manufacturers. Tesla is planning already a Chinese production plant combined with a joint venture to overcome the 25% of import tax. In some parts of China such as Shanghai there are complementary policies such as free parking. Additionally, Chinese companies that invest in NEV technologies can claim subsidies from the government.
TESLA MOTORS, INC. COMPANY REPORT
PAGE 7/32
The Japanese government is providing tax breaks to its EV customers, which includes for BEVs the exemption of acquisition, tonnage and ownership tax. The mentioned tax breaks are available for domestic EV manufacturers as well as for foreign. The total tax break can amount up to $7,800 for a model of Tesla.
Germany, Norway, Netherlands and France mainly determine the European EV market, whereas other countries have either no substantial EV stock or no valuable government incentives for EVs.
Norway, seen as the pioneer within the EV market with a market share of 23.3%, is incentivizing its customers with registration tax exemption and VAT exemption3, where the registration is worth around $12,000 depending on the purchasing price. Norway is additionally allowing free access to toll roads, reduced ferry fees, free parking in municipal parking lots, free charging at public chargers and access to bus lanes. We are considering the goal of exclusively electric vehicle sales by 2025 in Norway as feasible.
The Netherlands was very successful with its incentive program the last years. The government set in 2011 the goal of 20,000 electric cars within 2015. With a budget of €65.0 million for registration tax and ownership tax exemption, the government reached in 2014 already 44,000 registered vehicles. The success was mainly reach because the tax exemption is worth around €11,000 depending on the CO2 emission of the vehicle. Additionally, €500.0 million were invest in R&D projects, infrastructure investments and education programs. These actions are summing up in an electronic vehicle market share of 9.7% in 2015.
Germany with its domestic automotive industry seems to be left behind in comparison to its European peers. In Germany, EV customers are exempt from the circulation tax for a period of 10 years from the date of the first registration. Secondly, the ownership tax was reduced for BEV customer. These incentives are complemented by a €4,000 one-time subsidy for all BEVs with a maximum vehicle price of €60,000. Tesla with its Model S and Model X is excluded from this subsidy because its models exceed the mentioned threshold. Additionally, the German government set up a €1.0 billion budget in 2016 for additional support of the EV industry, where €600.0 million are for one-time subsidies, €300.0 million for infrastructure investments such as the charging network and €100.0 million for the government itself to buy an EV fleet.
France is making registration tax exemption available and a mechanism that is penalising high emission vehicles (>130 g/km) and is giving the funds to customers
3
25% of the vehicle price before tax
EV deployment is highly dependent on the value of
TESLA MOTORS, INC. COMPANY REPORT
PAGE 8/32
that are buying a low emission vehicle (<110 g/km). This bonus can go up to €6,300, while the government is gaining penalties up to €8,000. This enables the government to incentivize the electric vehicle sales without needing multimillion incentive budgets. Additionally, it is possible to get a conversion bonus up to €3,700 when scrapping an old diesel vehicle. The purchase of a Tesla in France with scrapping an old diesel would result in approximately €10,000 of subsidy. Additional incentives are dependent on local policies. Paris is granting free parking with a low emission vehicle card. Complementary to these incentives, it is possible to get R&D funding. Further government incentives from other countries are summarized in Appendix 3.
Bottom line, government incentives can have enormous influence on EV deployment. Nonetheless, it is interesting that countries such as Norway or Netherlands with no domestic car manufacturers have EV market shares of 23.3% and 9.7% respectively, while Germany with its domestic automotive industry is lacking substantial market shares. According to our analysis, the actual value of the incentives disparate from country to county. Incentives in Norway can be worth more than $12,000 in tax savings while in Germany the same vehicle would end up with approximately $420 in tax savings. Additionally, indirect incentives such as free parking and fast lane access as it is practised in Norway contributes to the EV market growth immensely.4
Incentives and its values are important but what matters most is the actual budget that is distributed for these incentives. Governments in the main markets have environmental budgets, mostly as a percentage of total government expenditures. In the following, we will assess if these budgets are sufficient to further boost EV market shares and if there is any space to further raise these funds.
Europe (Euro 28) with total general expenditures of €6,954.0 billion is distributing in 2015 0.68% or €99.2 billion in environmental expenditures. The share of government incentives is estimated by taking Germany, Norway, France, Netherlands, Portugal and UK as a proxy for European government incentives.5 As a result of the approximation, we state that in Europe 0.62% of environmental expenditures are distributed as government incentives in 2016. We conclude that the share is considerably low, which should be raised over the next years to further support EV market shares. The Analysis shows that government incentives can grow from 0.62%of total environmental expenditures in 2016 to 18.86%regarding
4
Comparison of leading electric vehicle policy and deployment in Europe, P. 65
5
Regarding EV incentives as % of total environmental expenditures and average value of EV
incentives per customer
Environmental budgets are expected
to increase substantially in
TESLA MOTORS, INC. COMPANY REPORT
PAGE 9/32
our combined scenario in 2040. The current structure and amount of government incentives in Europe leads us to the conclusion that Europe will contribute in a significant way to future EV market growth.
The United States are spending 33.8%of their GDP in total general expenditures, whereas 0.13% are environmental expenditures in 2015. The estimation of government incentives in 2016 states that 6.79% of total environmental expenditures are government incentives for the EV market support. The comparison to Europe shows that the United States already contributing relatively more of their environmental budget, which brings us to the conclusion that future EV market growth contributed by government incentives is limited in the United States. The estimation for 2040 gives us 16.66%of environmental expenditures in government incentives regarding our combined scenario.
China as the biggest electronic vehicle market as of sales is expected to spend 4.0% of their GDP in environmental expenditures in 2016. Total government incentives are as of our estimation at 0.27% of environmental expenditures in 2016. China has also relatively low expenditures in government incentives as of environmental expenditures. We expect that China to be able to raise these funds to further promote EV market shares. Based on our estimation we expect government incentives to grow to 18.12% of environmental expenditures in in our combined scenario in 2040.
We attribute the factor in our overall estimation model with 20%influence on EV market share, which makes it to a major influence factor in our forecast.
The combined scenarios of government incentives in the mentioned markets merged to total EV market share growth. Overall, we expect that Government incentives can rise current EV market shares of about 0.45% in 2015 to 1.13%, 4.99% and 34.4% for the years 2020, 2030 and 2040 in our combined scenario. Global EV sales are expected to grow at 24.19% annually in our combined scenario.
Commodities
This part of the market analysis concentrates on the breakdown of the most important commodities that have influence on EV deployment. Mainly, we analyse our future expectations regarding oil and electricity prices. Furthermore, the battery prices for EVs have a major impact on the cost structure and ultimately on the distribution price.
Figure 3 EV deployment based on government incentives
The US are limited regarding EV incentive expansion
China is expected to be the leading market
TESLA MOTORS, INC. COMPANY REPORT
PAGE 10/32
Electricity Prices
Electricity prices, as the equivalent to gasoline or diesel prices of ICE vehicles is the fuel commodity of EVs. The future electricity price mainly determines how economically better EVs running cost per mile is in comparison to ICE vehicles, which has ultimately an effect on total cost of ownership.
The IEA is expecting as of its Annual Energy Outlook 2016 average retail electricity prices at 10.1- 10.9 c/kWh. Taking the United States average electricity price as a proxy for average worldwide electricity prices, we estimate electricity prices by 2040 at 9.96, 10.9 and 11.40 c/kWh in our best, base and worst-case scenario respectively. These scenarios result in annual price growth or decline of -0.18%, 0.18% and 0.36% for our best, base and worst-case scenario respectively. Bringing our estimation and the estimation of the IEA together, we can derive further EV market share development dependent on future electricity prices. The marginal expected price volatility and its minor effect on global EV market share growth let us attribute 5% influence in the overall EV markets share growth coming from electricity price development. We expect in our combined case EV market share growth to 0.34%, 0.20% and 0.15%of EV market shares in the years 2020, 2030 and 2040 respectively. Overall, this is implied by an annual EV market growth of -0.12% annually until 2040.
Oil Prices
The global progression of the oil price within the next 25 years is crucial for the success of EV adoption. A high oil price makes it economically more reasonable for customers to buy an EV, whereas the current low oil price is more a motivation to stick with internal combustion engine (ICE) vehicles. The Energy Information Administration (EIA) issued a summary of oil price projections from different organisations such as Strategic Energy & Economic Research (SEER), Energy Ventures Analysis, ArrowHead Economics and their own scenario projections.6 The EIA is projecting with current policies a rise to $130/b within 2030 and $150/b within 2040. Worst case for the EV industry would be the low oil price case of the EIA with oil prices of $91.6/b, $104.0/b, $119.6/b and $136.2/b for the years 2025, 2030, 2035 and 2040 respectively. Throughout the different projections we estimate 3 different scenarios of the oil price progression until 2040.
We attribute the oil price factor with 5.0% in our overall estimation model and estimate the result on EV market shares at 0.54%, 0.79% and 1.18% for the years
6
Annual Energy Outlook 2016
Figure 4 EV deployment based on electricity price development
Figure 5 Oil price progression
Figure 6 EV deployment based on oil price development
TESLA MOTORS, INC. COMPANY REPORT
PAGE 11/32
2020, 2030 and 2040 respectively in our combined scenario. This market share development is estimated with an annual growth of EV sales at 8.52%, 10.96%, 7.97%, 3.99% in our combined, best, base and worst case scenario respectively.
Battery Prices and Durability
The prices and durability of battery packs within EVs is first one of the biggest cost drivers and second an important factor that drives the economic expediency of EVs in comparison to ICE vehicles. The major objectives are improvements in the cost structure, size, weight, energy density and efficiency improvements. Improvements in these factors will result in a leaner battery cost structure with relatively higher density and durability on smaller battery sizes.
Electronic vehicle manufacturer are mainly using lithium-ion batteries, because of its lightweight and high energy density in comparison to other battery systems. Tesla and Panasonic together are using lithium-ion batteries with a cobalt cathode, whereas LG Chem the major competitor when it is coming to battery manufacturing, is using a lithium-ion polymer gel with a manganese cathode. Both components are having advantages and disadvantages in comparison to each other in terms of cycle times, number of possible charging processes before significant capacity loss and instabilities while dysfunction.7
In the cost structure analysis of EVs, the battery price accounts for approximately 25-30% of the overall total vehicle costs. The battery costs are mainly determined by raw material costs (60%), second by overhead costs (depreciation, energy costs, R&D, sales and administration) (30%) and third by labour (10%). Past cost reductions were mainly possible by capacity expansion; whereas future cost reductions are going to be reached by process automation and efficiency improvements in the production, where we see the Gigafactory at the leading edge of technology. In the long term, we expect gradual material mix, pack design and battery management improvements by constant R&D investments is most likely to occur. Additionally, we expect raw material costs to be constant in the future, without having its supply at risk.8
Looking at different battery price estimations, we set the price at $275.0/ kWh as current industry average for long range battery packs with battery sizes of approximately 60-70 kWh. Tesla is estimated to have battery pack costs of approximately $150 – $200 /kWhand General Motors is claiming to have costs at around $140/ kWh with its new Chevy Bolt. We expect battery prices at around
7
Powertrain 2020 – The Future Drives Electric, Roland Berger, Page 46
8US Department of Energy (DOE)
Figure 7 EV deployment based on battery prices
The battery counts for more than 25% of
total EV manufacturing costs
TESLA MOTORS, INC. COMPANY REPORT
PAGE 12/32
140.0/ kWh within our combined scenario by 2030, which implies cost reductions at 4.82%, 4.37% and 3.60% annually in our best, base and worst case scenario respectively.
The estimate regarding the effect of battery prices on EV market share growth an annual growth of EV Sales at 9.04% within our combined scenario. The combined scenario is estimating EV market shares implied by battery price reductions at 0.56%, 0.87% and 1.33% for 2020, 2030 and 2040 respectively. We evaluate battery prices as a minor factor of EV market share growth and attribute 5% influence within our overall EV market share estimation.
Electronic Vehicle Specifics
Having analysed factors that are affecting the EV market from outside or by third parties, we are starting to analyse factors coming directly out of the EV industry and are mainly influenced by EV vehicle specifics.
Charging Facilities
The network of fuel stations for EVs, better known as charging stations are directly connected with EV deployment. Ultimately EV customers want to charge up at home and on the road, as convenient and quickly as possible. Raising EV sales imply a need for a sufficient charging network to overcome customers range anxiety. Furthermore, the mix out of slow (Level 2) and fast (DC) charging stations will determine how convenient customers can also travel long distances that exceed the actual range of an EV.
Slow chargers are more likely to find at customers’ homes, shopping centres, hotels, company parking lots and always there where EV customers are expected to stay for at least a few hours. The charging speed is approximately at around 10-25 miles of range in an hour. Fast charging stations are more likely to be located at nodal points of highways, where EV customers can charge up within less than an hour (depending on the battery pack size), with a charging speed of 80% charge in 30 minutes. Tesla has its super charger network, which is so far only available for Tesla customers, other EV manufacturer such as Nissan are using collaborations with CHAdeMO an association for quick charging networks. We see the current state and setup of the charging landscape in most main markets as insufficient to overcome customers range anxiety. Being responsible for major investments to overcome this problem is new to established car manufacturer but all major car manufacturer that are expected to release EVs invest in the network or collaborate with charging network companies.
TESLA MOTORS, INC. COMPANY REPORT
PAGE 13/32
Joint Ventures, Collaborations and companies for open standard-based technology are initiatives to overcome this problem. The coverage of charging stations should be raised to ensure customers not only long range drives but also the possibility to drive wherever they want to drive, meaning that countries such as Spain, Portugal and Italy lacking a sufficient network.
Currently, there are 189,509 charging stations available in the main Markets such as Europe, United States, China and Japan. We expect the charging network to grow substantially in the next years based on active involvement of different parties. Car manufacturer are joining associations to build up the network. BMW, Daimler, Ford and Volkswagen for example lately announced that they are building until 2020 at 400 identified sites thousands of fast charging points in Europe.9 In the US, the DOE is working with the private sector to raise EV deployment but also charging infrastructure.
Throughout the involvement from not only EV manufacturer but also from utility and charging network companies we expect a fast-growing charging network within the next years. We expect charging stations to grow at 16.40% annually within our combined case scenario, which entails approximately 1.8 million charging stations by 2030 and 8.5 million charging stations by 2040, with a mix of 85% slow charging station and 15% fast charging stations.
The effect on EV sales coming from the charging network development is expected at a growth rate of 21.67% annually within our combined case scenario and EV market shares of 0.97%, 4.46% and 20.62% in the years 2020, 2030 and 2040 respectively. We attribute this factor with 15% influence in the overall EV market share development.
Model Diversity
The current model availability is mainly determined by either luxury long range or short range compact EVs. Lately, car manufacturer such as Chevrolet or Tesla are planning to launch long-range compact vehicles for the mass market.
The current supply of EVs is very limited, but our analysis of upcoming vehicle launches states that all major car manufacturers are planning to launch EVs in all vehicle classes. Especially, Volkswagen AG and Daimler AG are planning major expansions into the electrification of their product range. Audi for example is launching a completely new business segment with its Etron line and non-car manufacturer such as Google and Apple are expected to enter the EV market as
9
https://techcrunch.com/2016/11/29/bmw-daimler-ford-and-vw-to-build-high-power-european-ev-charging-network/
Figure 8 EV deployment based on charging network development
All major car manufacturer are expected to enter the
EV market within the next decade
TESLA MOTORS, INC. COMPANY REPORT
PAGE 14/32
well. As of our own analysis, we expect more than 59 new EVs coming from a wide range of manufacturers within 2025, which is more than double the diversity that is available as of today. The confidence into the new market and its future development is testified by high investments from major car manufacturers. We expect that the extended availability of EVs will have ultimately a positive effect on the EV deployment, because customers have more options regarding vehicle type, price category and range. A comprehensive list of all available EVs is summarized in Appendix 4.
Applying our analysis to the EV market share development in the future we can state that we expect an annual EV market share growth of 22.51% annually in our combined scenario, coming from the expected model diversity expansion. According to our analysis we expect in our combined scenario EV market shares of 0.75%, 3.28% and 24.48% in the years 2020, 2030 and 2040 respectively. Since model variety is crucial for further EV deployment we assign 20% to this factor within our whole EV market projection.
Total Cost of Ownership
The Total cost of ownership (TCO) is a measurement system that analyses all accrued cost during a specified period. The calculations are informative about total loss in value per mile or running costs per mile.
In order to assess and compare TCO of ICE vehicles to EVs we set up the following assumptions. The calculated TCO are based on a 5-year horizon in which the vehicle is driving 12,000 miles per year. We applied a price per gallon of $2.20, which is the 2016 average retail price. EV fuel costs are assumed at 0.11 c/kWh. We are taking the US market as a proxy for worldwide TCO which implies a sales tax of 9%.
In order to assess the differences in TCO we compared a Nissan Leaf and Nissan Versa Note, which stands for the comparative group of compact cars. Additionally, we compare a Tesla Model S with an Audi A8 standing for luxury sedans and a Tesla Model X with a Porsche Cayenne standing for luxury cross over SUVs. EVs have as of today a higher purchase price as ICE vehicles in all defined categories. The average estimated price of currently available EVs without any government incentive is $44,557.65, while the AVSP of ICE vehicles are at $33,420.0.10 The depreciation over the defined period is as well different from ICE vehicles. EVs are having as of today residual values of 30%-40% after 5 years, which is influenced by high uncertainties regarding battery power loss and
10
Statista, New Average Vehicle Price 2015
Figure 9 EV deployment based on model diversity
TESLA MOTORS, INC. COMPANY REPORT
PAGE 15/32
durability of EVs. Even though, Tesla has with its Model S and X a considerably higher residual value and a more stable resale market, which can be explained by the very high quality Tesla is applying to its products and their residual value guarantee programme (RVG). This programme showed high confidence into the product itself.
Furthermore, the most important advantage of EVs in comparison to ICE vehicles are the fuel costs. EVs are having in all applied categories fuel cost saving from $2,549.5 – $4,050.9 as of our own estimations. Maintenance and Repair costs for EVs are cheaper because all oil related maintenance procedures and exhaust system repairs are not necessary, which can result in savings as of our own estimations in the mentioned vehicle categories of $359.0 – $2,800.0 over the applied period of 5 years. Insurance costs on the other side are as of today cheaper for ICE vehicles as for EVs.
The calculations of TCO have shown that EVs in the compact class are having considerably higher TCO as its ICE vehicle peer. In the luxury sedan class, our calculations are estimating that TCO of EVs are marginally lower than its peers. Our estimation can be supported by the fact that the Model S is the only large luxury vehicle in the United States with positive sales growth and a market share growth large luxury sedans from 16.7% to 25.8% in 2015. The comparison of luxury cross over SUVs is showing a very high difference in TCO, which is mainly determined by the very high selling price of the Model X in comparison to its peers. In all vehicle categories, EVs have always a higher loss in value per mile and lower running costs per mile.
Applying our future expectations regarding TCO and the influence on EV market shares we can state that EV sales are expected to grow annually by 11.41% in our combined case, which entails EV market shares of 0.62%, 1.18% and 2.28% for the years 2020, 2030 and 2040 respectively.
Since, TCO is a crucial determining factor within the EV development because it economically justifies an EV purchase; we attribute this factor with 10%within the overall EV market share development estimation.
Market Assessment & Outlook
The status quo of the EV market is mainly characterised by its size and growth rates. In the last years, new registrations of EVs increased from 58,060 in 2012 to 328,770 in 2015, which shows an enormous growth. The mentioned growth occurred in the main markets, which are China, United States, Europe and Japan. In 2014 the United States were the main market for electronic vehicles, which
Figure 10 EV deployment based on TCO development
The Model S is already very cost competitive regarding
TESLA MOTORS, INC. COMPANY REPORT
PAGE 16/32
changed to China in 2015. We expect China to further expand its position as the leading market regarding new registrations and EV stock, not only because of the actual size of the automotive market but also because of the political and social desire to minimize GHG emissions in urban areas. Furthermore, we expect as well from Europe with its domestic car producer in Germany and France substantial growth in the next years. Even though, the United States and China are responsible for more than 90% of EV sales, they can nearly register an EV11 market share of 1%, whereas the Netherlands and Norway already reached in 2015 market shares of 10% and 23% respectively.12
EV manufacturing is characterised by higher margins than usual ICE vehicle manufacturing, which is an additional stimulus for established manufacturer to expand into EV manufacturing. Gross margins from established ICE vehicle manufacturer are ranging at 12.58%13, whereas Tesla as a pure EV manufacturer can register gross margins at around 24.2%14. Most established car manufacturer are producing or expected to launch compact sedans in the price range of $25,000 – $40,000 with growing ranges over 150 miles, which further promotes the mass adoption of EVs.
The analysed factors are summarised with their respective influence factor in a comprehensive EV market share forecast. The mentioned 328.770 EV sales in 2015 are expected to grow to 1.3 million, 8.1 million and 44.6 million in 2020, 2030 and 2040 respectively in our combined scenario. The EV sales are contributing to EV market shares of 1.35%, 5.09% and 20.76% in 2020, 2030 and 2040 respectively. The best-case scenario is anticipating an EV market share of 36.87% in 2040, whereas our worst-case scenario is expecting 9.58% in the same year. The EV stock would consequently grow from 739,810.0 to 4.6 million, 44.9 million and 271.8 million vehicles in the alluded years. Additionally, the combined scenario is forecasting an EV sales growth of 21.7% annually. The analysis is a combined calculation out of every influence factor and their applied assumptions. Furthermore, we expect worldwide passenger car sales to grow at 4.5% annually until 2040, which implies that sales of more than 100,000 are reached by 2021.15 Passenger car sales are the base for our market share calculations. Our Analysis is further detailed in Appendix 1, which includes EV sales per year, EV market shares and the annual EV stock.
11
In this case BEVs and PHEVs
12
Global EV Outlook 2016, International Energy Agency (IEA)
13
http://csimarket.com/Industry/industry_Profitability_Ratios.php?ind=404&hist=1
14Average gross margin from 2013-2016
15
Statista, Number of cars sold worldwide
Figure 11 EV market share estimation
EV deployment will increase but significant market
shares are not expected before 2030
TESLA MOTORS, INC. COMPANY REPORT
PAGE 17/32
Company Setup & Analysis
Business Unit Analysis
The focus of the business unit analysis is on the automotive revenue streams because 88.98% of its revenue in 2016 is expected to come from automotive sales. Automotive revenue is generated as of today by the sales of Model S and Model X. Model S were launched in 2012 and could scaled up rapidly in the last years. The Model X got launched in September 2015 with some problems regarding technical miss functions, which are as of Tesla already rectified. Tesla is with its current product positioning a premium niche manufacturer of EVs. Tesla presented its Model 3 in 2016, which is expected in mid-2017. The Model 3 is expected to bring Tesla from a niche product producer to the mass production of EVs. Furthermore, we expect in 2020 the launch of the Model 3 variant, which will be a variation of the Model 3 but with the same cost structure and pricing.
Roadster
The Tesla Roadster was the first vehicle Tesla launched in March 2008. The production was possible through a joint venture between AC Propulsion and Lotus. AC Propulsion is a US based producer of alternating current-based drive train systems for EVs and Lotus is a British sports car manufacturer. The Tesla Roadster was limited to 2,450 vehicles and was the first sold EV with a Lithium-ion battery exceeding the range of 200 miles. The Tesla Roadster was the first demonstration that it is possible to produce EVs capable of longer ranges than 200 miles. We see that Tesla mainly used the success with the Tesla Roadster to further develop new models.
One of the main critics regarding EVs is that it is unsure how persistent the Lithium-ion batteries are. Since, the battery as earlier discussed is a main cost driver, the durability plays a major role. Due to the fact, that the Tesla Roadster got produced from 2008 to 2012, we analysed the durability and loss of range as of today. Most of the available used Tesla Roadster over 100.000 miles exhibit marginal loss in range and battery durability. Additionally, we can see resale values at more than 40%-50%, which is also driven by the limited availability of this model. Elon Musk mentioned earlier this year that Tesla is planning to launch a new Roadster with further improvements. We take the Tesla Roadster because of its minor quantities and unsure launch not into account of our revenue estimation calculation.
Roadster batteries show relatively high
TESLA MOTORS, INC. COMPANY REPORT
PAGE 18/32
Model S
The Tesla Model S is a luxury sedan that is available in 8 different versions with anticipated ranges of 218 miles to 315 miles. The Model S got launched in June 2012, right after the Tesla Roadster got sold out. As of today, Tesla already sold more than 160,000 Model S worldwide. We assume in our Model a selling price of $100,000, which is growing with 1% annually because of inflation effects. In our analysis regarding the competitiveness, we saw that the Model S has a slightly higher selling price as its ICE peers, but that the TCO are in comparison to an Audi A8 only marginally higher. Additionally, we saw in our analysis that the Model S is missing on average 144.0 miles in range in comparison to its luxury sedan peers. Nonetheless, the Model S was in the US as of our own analysis the only luxury sedan with growing sales, all other large luxury vehicles had declining sales from 2014 to 2015. Even though, the Model S is an all-electric vehicle with all mentioned risks and inconveniences, more than 9% of luxury sedan customers decided to change from an ICE vehicle to a Model S, which ensured a growth in US Model S market shares from 16.7% to 25.8% in the luxury sedan segment.
In our revenue estimation, we expect that the Model S stays the main revenue driver of Tesla regarding deliveries until 2019 and that Model S sales are growing at 6.9% annually until 2025. We expect that the Model S can further expand its competitive position in the luxury sedan segment globally to reach sales of 100.000 units within 2024, especially when a sufficient access to the Chinese market is assured.
Model X
The Model X is a luxury cross over SUV which got sold for the first time in September 2015. The Model X is available in 3 different variations with driving ranges from 237 miles to 289 miles. We expect Model X sales at 26,980 in 2016, making the Model X to the second main revenue driver of Tesla. In our analysis regarding the competitiveness of the Model X we recognised a considerable high difference to its peers. The average list price of Model X peers such as the BMW X5 or the Audi Q7 is at around $56,103.9, whereas the Model X is listing at $88,800. The high difference in prices and the lack of driving range compared to its peers makes the Model X a less attractive vehicle for customers. Looking at the US sales of midsize luxury SUVs in 2015 and 2016 we can see that the Model X could position itself at sales that can be compared to Audi Q7 or Volvo XC90 sales. Even though, the Model X is as of our analysis not very competitive, we expect sales growth rates of luxury SUVs to stay at its level in 2016 of 15.1%.
Figure 12 Model S delivery development
Figure 13 Model X delivery development
Chinese market access is crucial for
Model S sales expansion
TESLA MOTORS, INC. COMPANY REPORT
PAGE 19/32
We expect in our revenue estimation regarding the Model X an average growth in deliveries of 23.5% until 2020, which entails a production capability increase of currently 100,000 to 150,000 vehicles per year in the Fermont, CA production site. Overall, we assume an average selling price of $90,000 and sales growing at 12.8% annually until 2025. The higher annual growth in sales in comparison to the Model S is mainly determined by the fact that the Model X just got recently launched. In 2016, we expect total deliveries of 85,000 coming from confirmed deliveries of 54,06116 until the end of the 3rd quarter and an average production pace of 2,000 vehicles per week for the last quarter.
Model 3
The Tesla Model 3 is a compact luxury sedan capable of 215 miles of driving range with one charge and got unveiled in March 2016. Tesla confirmed again during their Q3 announcement that the assembly of the production line is in time and first deliveries are planned for mid-2017. The pricing of the Model 3 is advertised at $35,000 list price but we expect a higher selling price at $45,000 due to optional extras. The Model 3 ramp up is a crucial factor for the future success of Tesla because it includes the transition from a luxury niche automotive producer to an electronic vehicle manufacturer that can serve a mass market adoption with its production. Furthermore, we expect that Tesla will launch in 2020 a Model 3 variant, that is based on the Model 3 platform but address different customer groups.17 Tesla Motors accepted since the release of the Model 3 launch reservations. Customers can deposit $1,000 at Tesla upfront to reserve the right to buy a Model 3 once the production started. As of Tesla’s last update in May 2016, already 373,000 customers made a reservation for the Model 3. The reservations would be worth 16.8 billion in revenues, but we expect many customers to cancel their reservations once the actual payment and order is due. Customers can cancel the reservation without any given reasons within 3 weeks. In our analysis of the Model 3 to its EV peers such as the BMW i3, the Chevrolet Bolt or the Nissan Leaf we found out that the Model 3 has the best ratio regarding the list price and the driving range, which is ultimately, what matters for customers in the compact vehicle class. Therefore, we expect that the Model 3 will have considerably high competitiveness within its EV peers.
We expect Tesla to have 330,000 Model 3 deliveries within 2020, starting with 21,023 deliveries in 2017, which is comparable to the ramp up of the Model S in 2013. Model 3 variant deliveries are starting as well with 20,000 in 2020. Overall,
16
Q3 Filing
17
We expect Model 3 variant such as a Model 3 SUV or Coupe
Figure 14 Model 3 delivery development
Rapid Model 3 ramp up is essential for Tesla Motors future
TESLA MOTORS, INC. COMPANY REPORT
PAGE 20/32
we expect that Model 3 deliveries increasing on average at 46.53% annually within 2025, making almost 500,000 Model 3 deliveries possible by 2025.18
Automotive Revenue Summary
The most important risk to mention regarding Tesla’s automotive revenue is the execution risk. Tesla main success is dependent on how fast it is possible to ramp up on one hand the Fermont production facility and second the assembly of the Model 3 production line within the Gigafactory in Nevada. We estimate three different scenarios to display our expectation regarding the production ramp up of the mentioned models.
We expect as of our analysis that the next 4 years are decisive for Tesla to take the lead in the EV market or not. The main factor within our estimation is the Model 3 ramp up. We expect in all our scenarios that Tesla will further produce at the confirmed pace of 2,000 vehicles per week in 2017 in their production facility in Fermont, whereas 60% are expected to be Model S and 40% are Model X deliveries throughout 2020. Furthermore, we expect that Tesla is able to increase its production pace from 2,000 vehicles per week in 2017 to almost 3,000 vehicles in 2020, reaching 40% of the by Tesla mentioned maximum capacity of 500,000 vehicles per year in 2025.
The Model 3 makes the difference in our scenario estimation. We expect in our base case scenario that Tesla delivers the first 21,203 Model 3 in the last two quarters of 2017. This production volume is comparable with the first deliveries of the Model S and Model X in 2013 and 2016 respectively. We anticipate 8,203 and 38,203 Model 3 deliveries within our worst and best case scenario in 2017. Furthermore, we estimate cumulative deliveries of the Model 3 till 2020 at 313,312, 500,712 and 61,684 in our base, best and worst case scenario respectively. Elon Musk repeatedly mentioned that he is expecting the production capacities of the Gigafactory at 500,000 within 2018 and 1.0 million vehicles per year by 2020. We consider the mentioned goals as very ambitious and estimate more conservative production capabilities. We expect Tesla to reach 500,000 vehicles as of our base case scenario in 2023 and in our best-case scenario already in 2021. We expect in our best, base and worst case scenario cumulative deliveries until 2025 of 4.6 million, 3.4 million and 1.7 million respectively. The rate at which Tesla generates economies of scale is uncertain, and many execution risks remain as the company increases capacity and introduces new models through 2020 and
18
Considerable conservative estimation since Elon Musk is claiming capabilities of 1 million
vehicles by 2020
Figure 16 Automotive revenue split 2025 Figure 15 Automotive revenue split 2015Figure 17 Scenario analysis by total deliveries per year
TESLA MOTORS, INC. COMPANY REPORT
PAGE 21/32
beyond. If EVs fails to gain traction beyond enthusiasts, then the volume the company need for scale may not be materialized.
Bringing the EV market share analysis and our expectations regarding Tesla’s production ramp up together we can derive expected market shares of Tesla until 2025. As of today, Tesla has with its deliveries in 2017 market shares of 15.41% within the electronic vehicle market. Bringing our estimations together, we see that Tesla will lose substantial amounts of market shares within the worst-case scenario. In this case, Tesla’s market shares are expected to go down to 8.37% until 2025. The base and best-case scenarios derive growing market shares until 2020, underlining Tesla’s growing lead in the EV market. Nonetheless, established car manufacturers are expected to enter the EV market until 2020, which adjusts Tesla’s market share by a few percentage. In the base case scenario, Tesla Motors market shares are expected at 24.47% and 21.46% in 2020 and 2025 respectively. In the best-case scenario, we expect market shares of 31.87% and 30.43% in the mentioned years.
Energy
Tesla Motors second revenue stream next to automotive revenue is the energy division. The launch of the energy division was in 2015 with its first product the Powerwall. The Powerwall which is a lithium-ion battery pack, that customers can install in their home to store solar electricity, to use this electricity when the solar electricity production is not possible. The Powerwall in connection with solar panels makes it possible to use solar energy even during times when solar energy is not available and to stay completely off-grid. Additionally, Tesla offers the Powerpack, which has the same function as the Powerwall but in a different scale more suited to large-scale utility companies or commercial customers. In October 2016, launched with aiming the approval of the Solar City merger a second generation of the Powerwall. The first generation of the Powerwall was capable of storing 6.4 kWh and the Powerwall 2.0 is able to store 14.0 kWh. The production is as well as it is from the Model 3, the Gigafactory.
The concept of storing non-used electricity in a Powerwall that can be used later solves the main problem of solar panels. Logically, solar panels can only produce electricity during the day and only with sufficient sunlight. Customers without a Powerwall consequently must use grid electricity, which is more expensive. Furthermore, it is important to state that solar panel customers must pay for their generated electricity; it is not the case that they are able to consume the generated electricity free of charge. The costs per kWh from solar panels are nevertheless cheaper as from the grid. As of our analysis regarding the actual use of the
Figure 18 Market share development by scenario
Figure 19 Energy revenue estimation
Powerwall storage capacity and actual
stores vary immensely
TESLA MOTORS, INC. COMPANY REPORT
PAGE 22/32
Powerwall, we assume a selling price of $5,500 for the 14.0kWh Powerwall 2.0 and approximately $500 of instalment costs.
The average citizen in the US is consuming 909 kWh per month with a grid peak demand rate of 0.19 c/kWh.19 Additionally, we expect the solar panel rate to be at 0.14 c/kWh. Even though, the Powerwall 2.0 can store up to 14.0 kWh, it is not the case that it stores 14.0 kWh daily. Solar panels are running at approximately 30% of the daytime and generate 25% more electricity as the customer uses, which implies that 7.5% of the monthly electricity use can be stored from the Powerwall 2.0. Ultimately, each Powerwall 2.0 stores only 68.2 kWh from the 909 kWh of month electricity consumption, which comes together to approximately $40.9 in cost savings per year for the average US citizen that has solar panels and a Tesla Powerwall 2.0.
We estimate that approximately 5% of Solar City customers become a Powerwall 2.0 customer and additionally 5% non-Solar City customers. Expecting an AVSP of $5,500 we expect revenues of $91.8 million 2016. The commercial selling price is as of Tesla at $250 per kWh for the Powerpack. We expect commercial revenues in 2016 to be at 12% of maximum commercial revenue, which implies revenues of $450.0 million in 2016. We forecast revenues coming from the energy division at 13% as of total revenues within 2025.
Powertrain & Service
The Powertrain & Service division sells powertrain components to other automotive manufacturers. Furthermore, Tesla offers component and prototype testing within this division. Tesla’s most important powertrain customers are Toyota, Daimler and Freightliner. Toyota is implementing Tesla powertrains in their RAV 4 EV, Daimler for its Smart ED and Freightliner for its electric van.
We expect Powertrain revenues to grow from $450.0 million in 2016 to $2.0 billion in 2025, making this division responsible for approximately 4% of total revenues throughout 2025.
Tesla Motors Key of Analysis
Gigafactory
The Gigafactory is a joint venture between Tesla Motors, Panasonic Corporation and different other strategic partners. The Gigafactory is planned to be first, the production facility of the Model 3 and second the production facility of all batteries
19
Per EIA, in 2013 average annual U.S. residential utility customer used 10,908 kWh
Figure 20 Powertrain and Service revenue estimation
TESLA MOTORS, INC. COMPANY REPORT
PAGE 23/32
needed for the vehicles, the Powerwalls and Powerpacks. We expect that Tesla Motors will finish the equipment installations during 2017 to make a production launch by mid-2017 possible. Total costs of the Gigafactory are ranging between $4.0 - $5.0 billion, whereas Tesla will undertake more than $2.0 billion in capital expenditures until its full capacity is reached. Tesla is claiming a total capacity of 50 gigawatts, which are in total 50,000,000 kWh production capacity per year. We expect as of our own analysis a total capacity for energy storage products of 15 gigawatts and 35 gigawatts for battery productions annually. Tesla would be consequently generating at full capacity Powerwall revenues of $5.8 billion, which we do not expect before 2025. Furthermore, considering the assumption that Tesla is using 35 gigawatts for the vehicle battery production, we estimate a maximum battery production capacity of 500,000 per year, which meets the battery needs for our production ramp up until 2025.20
Super Charger & Tesla Store Network
Tesla Motors provides next to its mentioned business segments also a Network of Super Charger and Tesla Stores. The Super Charger network was until this year free of charge for Tesla customers to provide the opportunity at more than 788 locations21 worldwide to charge 80% of the battery within 30-40 minutes.22 Tesla announced that their plan to further expand its charging network within the next years and as well encourage third parties such as hotels, cinemas, shopping centres and large corporations to install destination chargers. Tesla announced in its 2014 annual statement, that their plan to grow its charging network by 50% within 2015 which would cost 5% of the anticipated $1.5 billion in CAPEX. Consequently, we assume an average construction price per super charging station of $367,647.1. Tesla said in February 2015 that Super Chargers are now accessible from coast to coast and networks are also being built in Australia, China, Europe and Japan. Consequently, we expect that Tesla will further expand its super charger network to 4325 stations worldwide, which anticipates an annual growth of 20.8% until 2025. The expansion will also imply expenditures, that are expected to rise from $75.0 million in 2016 to almost $220.0 million in 2025. Overall, the Super Charger network helps to further enhance Tesla’s brand equity because it gives customers a reason not only to buy an EV but to buy a Tesla model, by mitigating range anxiety.
20
Assuming an average battery capacity of 70 kWh
21Own estimation super charger installed by end of 2016
22Depending on the battery size
Figure 21 Super Charger CAPEX estimation
Vehicle production of 500.000 not before
2024
Super Chargers help to mitigate range anxiety for Tesla
TESLA MOTORS, INC. COMPANY REPORT
PAGE 24/32
The second network Tesla is building is the distribution and service network. Tesla’s distribution strategy and setup is fundamentally different from usual car manufacturer. Instead of distributing its vehicles over a franchise dealership network, Tesla is taking care of its sales by building up their own Tesla stores. We are convinced that Tesla is mainly building up its own network to make sure that the communication with the customer is impeccable because every new customer is most probably buying for the first time an EV. Tesla has the chance through its sales network to educate customers. Furthermore, Tesla is complementing its store network with connected service facilities for maintenance and reparations. We expect Tesla to open primarily service plus facilities, which connects a Tesla store with a service centre. The total expenditures per service plus facility are expected to range at $700,000 to $800,000. We expect in our estimation that Tesla can hold its pace of 200 new facilities per year and even expand this growth from 2020 on with new facilities per year over 300. As of today, we expect Tesla to operate 270 service and store locations. Tesla could grow its sales and service network on average by 30% in the last year, what we anticipate as a reasonable growth for the future as well. As of our own analysis we expect Tesla to operate 2177 sales and service locations around the world, implying cumulative capital expenditures of almost $1.4 billion until 2025.
Financial Outlook & Valuation
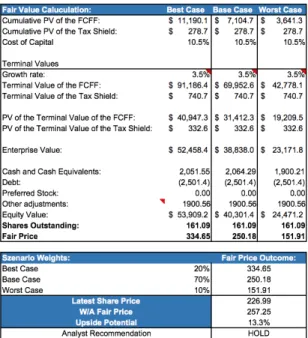
In order to determine a target share price for Tesla Motors for the end of 2017, we applied a DCF and more specifically an Adjusted Present Value (APV) valuation. Furthermore, we constructed 3 scenarios to take the high uncertainty regarding Tesla Motors future performance into account. Consequently, we applied a best, base and worst case scenario with the weights of 20%, 70% and 10% respectively, which comes together at a weighted average target price.
Financial Statement Adjustments
We recognised throughout our first analysis of the financial statements that Tesla Motors has launched in April 2013 a customer program that has implications on the financial statements of Tesla. The program enabled customers to finance a Tesla Model, where Tesla assures an option to the customer that he can give the vehicle after 36-39 month back at a predefined residual value. This program also known as the Residual Value Guarantee Program (RVG) had some accounting implications we wanted to resolve. This program implies two GAAP mechanism; first Tesla must book these revenues into deferred revenues with an amortization over the whole period and second a separate liability for the repurchase value of
Figure 22 Store & Service facility CAPEX estimation
TESLA MOTORS, INC. COMPANY REPORT
PAGE 25/32
the vehicle that must be booked into operating leases. Since, Tesla gets the cash up front, regardless if the customer wants to give back the vehicle, we declassed the deferred revenue and related COGS into normal revenues and eliminate the liabilities from the balance sheet.
Additionally, we estimate the present value of the possible costs that occur when customers decide to give back their car and deduct the value from the enterprise value at the end of our valuation. The assumptions regarding the RVG program include that 10% of Tesla Motors sales were part of the program, we expect 75% of the customers to give their vehicle back to Tesla with an average repurchase price of $65,000 and that Tesla is able to recover the costs to 95% by selling the returned vehicles. As of our analysis, the present value of all expected costs regarding the RVG is $41.8 million.
Forecast
The operating model is forecasting until 2025 to capture the full production ramp up and to get to a point where Tesla Motors is expected to be a stable and an established car manufacturer, since the terminal value is accounting for more than 80% of the total enterprise value. Total vehicles delivered over 10-year explicit forecast period and midcycle operating margin including stock option expenses are key drivers of our three scenarios.
Our base-case fair value estimate of 250.18 assumes an EBIT margin of 8.6% and Tesla selling nearly 700,000 units in the last year of our 10 year explicit forecast period and 3.4 million in total over 10 years. We expect Tesla to have a strong revenue growth until 2020 with a CAGR of 31.9% and a continuously normalising growth after 2020 with a CAGR of 14%. Tesla is expected to have in the last year of our estimation a revenue growth of 11.8% which shows the reach of a stable and growing car manufacturing company. Furthermore, we are expecting gross margins between 24%-25%, which can be justified by our expectations regarding EV manufacturer and past margin ranges. We anticipate R&D expenses at 7%-10% of revenues making it for Tesla indispensable to further improve their cost structure and product range, to make sure they stay at the edge of technology. The best-case scenario determined by its delivery expectations has a revenue CAGR until 2020 of 37% and after that an expected CAGR of 15.7%. Furthermore, the best case is anticipating gross margins between 25%-27%, considering major improvements in the production efficiency coming from the faster ramp up of the production capacities of the Gigafactory. R&D expenses are expected to be the same as in the base-case because it is implied by a % of revenues.
Figure 23 Net costs resulting from RVG
Figure 25 Revenue estimation worst-case (in million)
Figure 24 Revenue estimation base-case (in million)
Figure 26 Revenue estimation best-case (in million)